
Investment in the private sector, of which construction activity is a key component along with purchases of machinery and equipment, depends on a host of factors including the level of interest rates; utilization and vacancy rates; revenue flows and corporate profits; and the availability of risk capital and/or government funding help.

All these factors come together in a two-word phrase, ‘investor confidence’.
Currently, investor confidence is riding high.
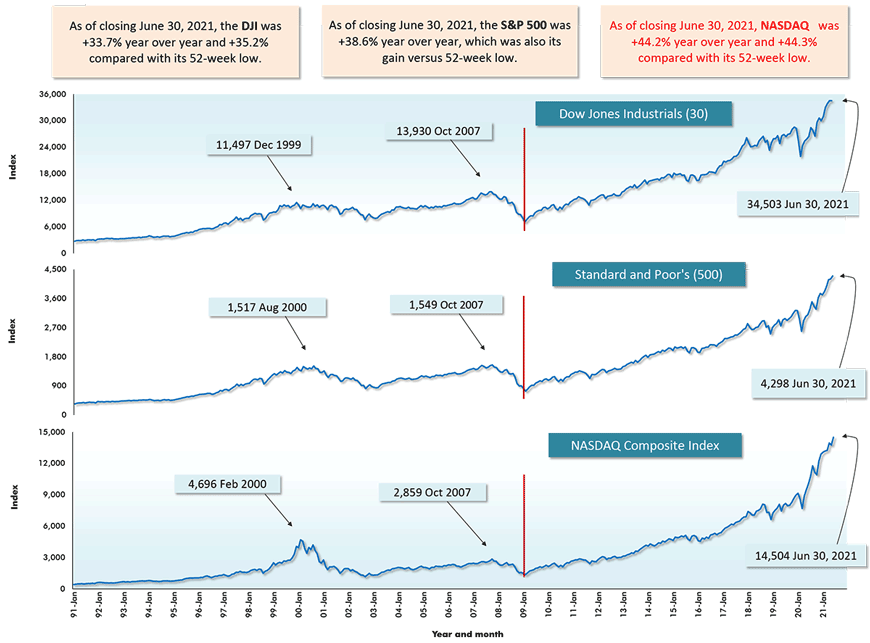
One primary indicator of investor confidence can be found in the stock market. In North America at least, stock market indices are humming along more than just nicely.
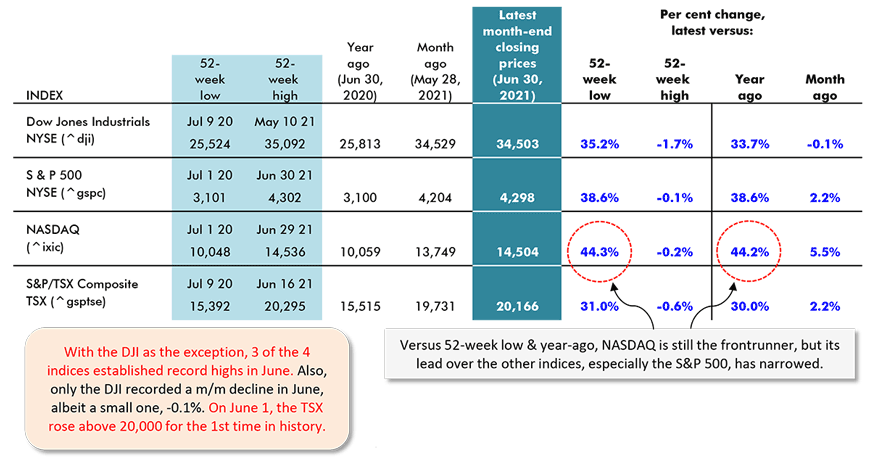
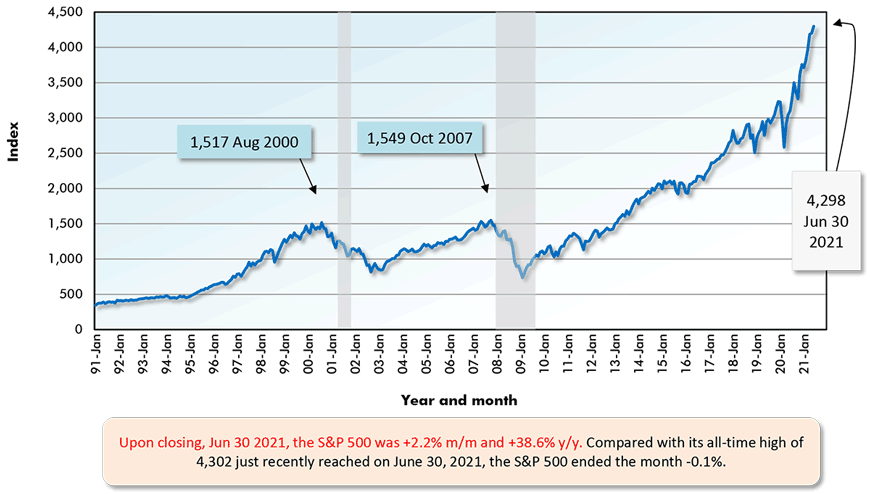
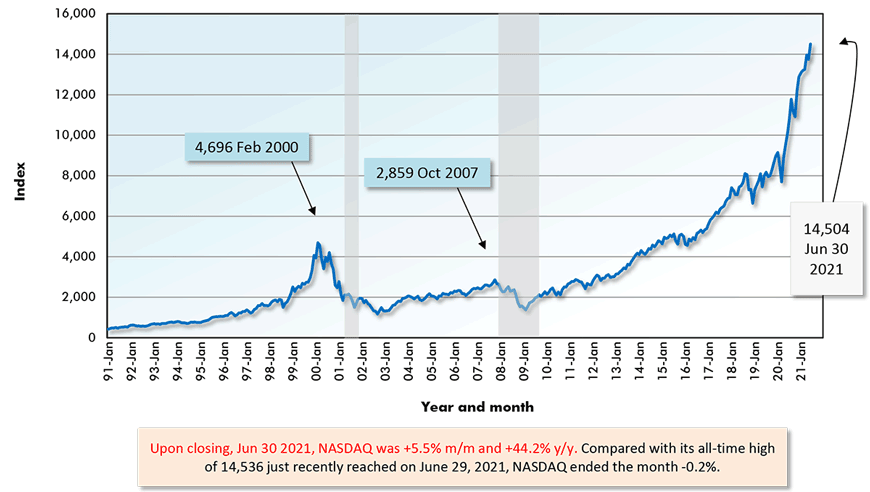
NASDAQ took a breather in May, but in June it resumed its march upwards, again setting a record. The S&P 500 and the Toronto Stock Exchange (TSX) joined NASDAQ in climbing to new peaks in the latest month. Only the Dow Jones Industrials index, which established a record high in May, failed to scale to a new summit in June.
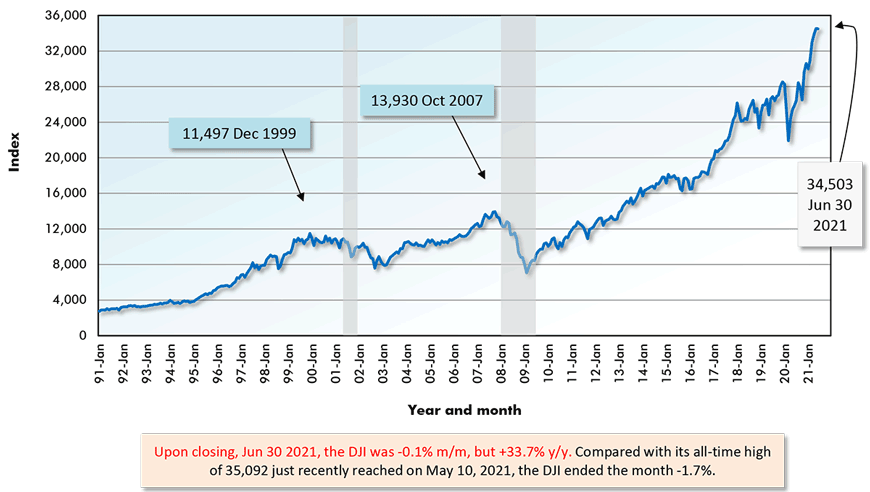
The DJI was the only one of the four principle indices shown in Table 1 to record a month-to-month decline in June and it was barely negative, -0.1%.
NASDAQ was +5.5% month to month in June and +44.2% year over year. As impressive as that y/y gain was, though, the Russell 2000 index, which captures the equity performances of small cap firms in the U.S., was +60.4% y/y.
With the exceptions of some iShares indices for emerging and pre-emerging markets, the five North American indices have again taken the lead on the world stage (see Table 2 and Graph 4).
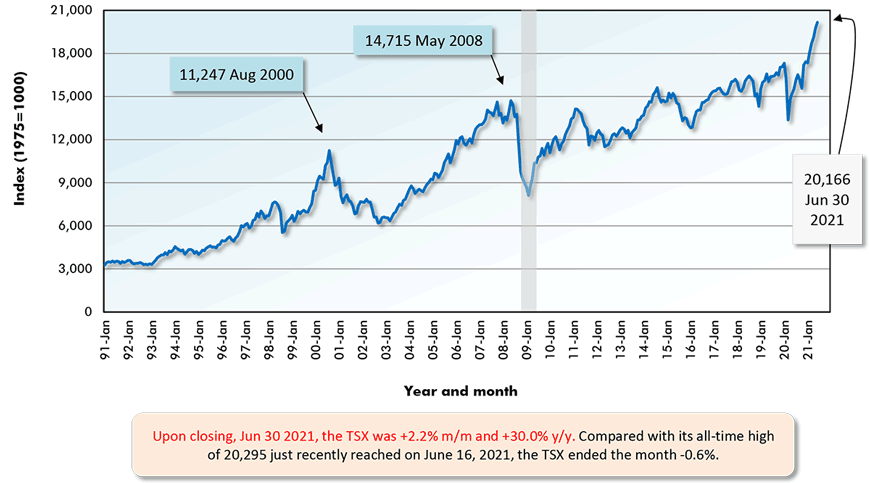
The Nikkei 225, STOXX Europe, German DAX 30, Shanghai Composite, Hong Kong Hang Seng and London FTSE indices have recorded respectable year-over-year increases ranging from +14% to +29%. Nevertheless, they trail the smallest climb made by the five U.S.-Canada indices, the +30.0% y/y made by the TSX.
Construction-related Equities
If NASDAQ is +44.2% y/y and Apple (AAPL) is +50.2% y/y, an equity appreciation by half y/y would seem to be a good target to shoot for. How have publicly traded companies in construction-related areas been doing?
The following gives the y/y (i.e., June 2021 ‘closing’ versus June 2020 ‘closing’) share price results for a representative sample: United Rentals Inc. (URI), +114.0%; Caterpillar Inc. (CAT), +72.0%; Pulte Group Inc. (PHM), +60.4%; Stantec (STN), +44.6%; Armstrong World Industries (AWI), +37.6%; and The Home Depot Inc. (HD), +27.3%.
Securities Dealers Automated Quotations (NASDAQ), Toronto Stock Exchange (TSE) and Reuters.
Table: ConstructConnect.
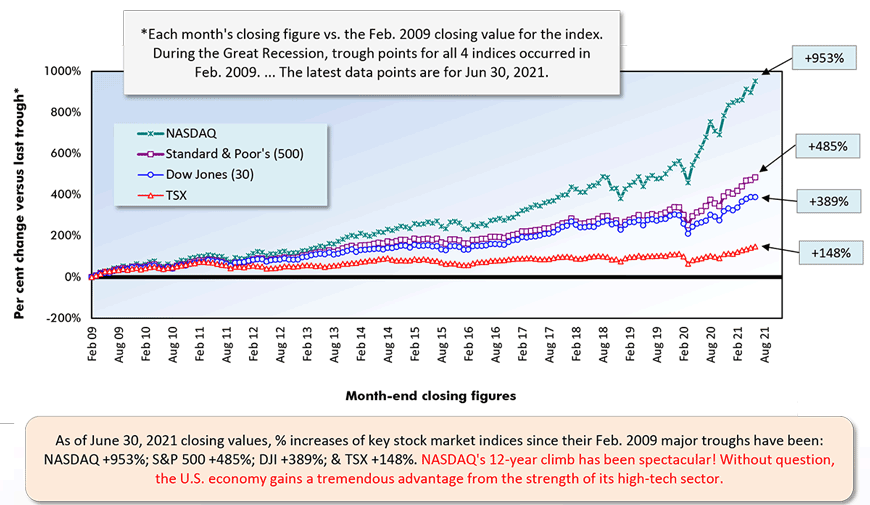
Red vertical lines denote Feb 2009 major ‘troughs’ for the indices.
Securities Dealers Automated Quotations (NASDAQ), Reuters & Yahoo.
Chart: ConstructConnect.
Securities Dealers Automated Quotations (NASDAQ), Toronto Stock Exchange (TSE) and Reuters.
Chart: ConstructConnect.
Securities Dealers Automated Quotations (NASDAQ), Toronto Stock Exchange (TSE) and Reuters.
Chart: ConstructConnect.
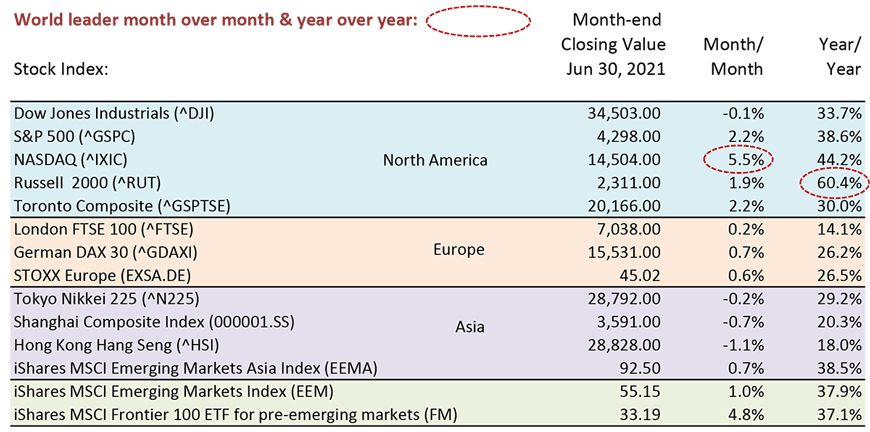
Table: ConstructConnect.
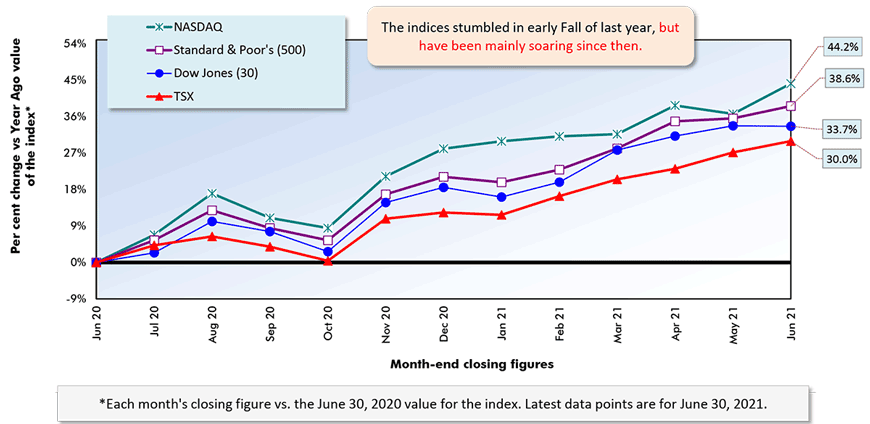
Year over Year as of Month-end Closings, June 30, 2021
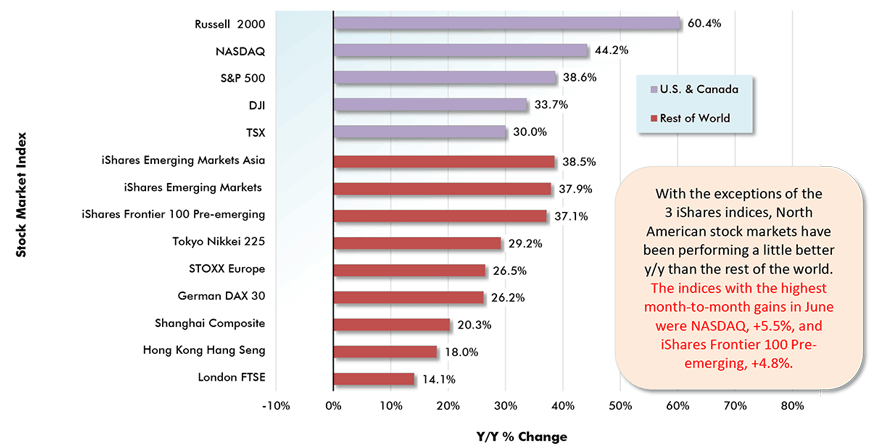
Chart: ConstructConnect.
Securities Dealers Automated Quotations (NASDAQ), Toronto Stock Exchange (TSE) and Reuters.
Chart: ConstructConnect.
Securities Dealers Automated Quotations (NASDAQ), Toronto Stock Exchange (TSE) and Reuters.
Chart: ConstructConnect.
Securities Dealers Automated Quotations (NASDAQ), Toronto Stock Exchange (TSE) and Reuters.
Chart: ConstructConnect.
Securities Dealers Automated Quotations (NASDAQ), Toronto Stock Exchange (TSE) and Reuters.
Chart: ConstructConnect.
Please click on the following link to download the PDF version of this article:
Economy at a Glance Vol. 17, Issues 105 and 106 – What are the Stock Markets Saying? Investor Confidence is Riding High – PDF
Alex Carrick is Chief Economist for ConstructConnect. He has delivered presentations throughout North America on the U.S., Canadian and world construction outlooks. Mr. Carrick has been with the company since 1985. Links to his numerous articles are featured on Twitter @ConstructConnx, which has 50,000 followers.


Recent Comments
comments for this post are closed