
U.S. Economy Stumbling Blocks
A year and a half into the coronavirus health crisis, the economies of the U.S. and Canada have been running into some stumbling blocks. In the U.S., GDP growth in Q1 and Q2 of this year, at +6.3% and +6.5% respectively (quarter to quarter annualized), were looking pretty good, and not far out of line with the +7.0% forecast figure for the full year adopted by many analysts. But the third quarter has not been looking as sparky.

Shortages of components and labor have cut into production across a wide swath. With some major automakers, motor vehicle assembly lines have temporarily ceased operations because computer chips have not been arriving from China as contracted.
With major retailers, imported consumer goods are not making it to the interior of the country because of tie-ups at the ports. There’s a logjam of container ships off the coast of California.
The cost of shipping goods from overseas has risen dramatically. When firms turn to the air as an alternative means of moving cargo, they’re finding there hasn’t yet been a sufficient increase in capacity.
General price inflation has climbed to +5.0% year over year. Wages have also been catching fire. They’re within sight of +5.0% year over year, both hourly and weekly.
But the biggest negative has been the resurgent coronavirus, with the Delta variant causing a fourth wave and a level of infections in August reminiscent of previous peak months. One consequence has been a blow to consumer confidence. The University of Michigan’s ‘Sentiment Index’ has fallen to 70.3 from 81.2 in the prior month. The current reading is lower than it was a year ago (70.3 versus 74.1).
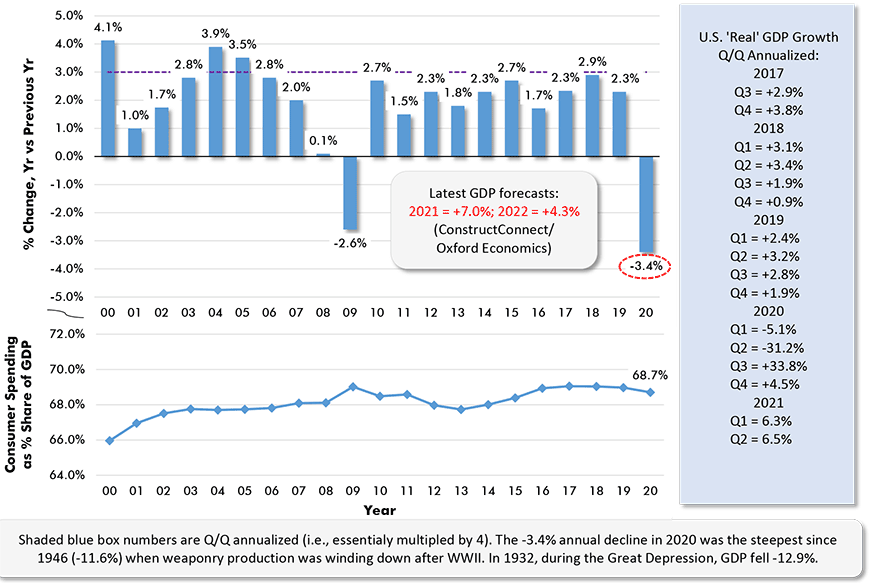
Chart: ConstructConnect.
Canadian Economy Suffers Q2 GDP Setback
The Canadian economy has been more prescient in reflecting the inhibiting influences presently underway. After a GDP climb of +5.6% in Q1, Canada’s economy shrank by -1.1% in Q2.
Again, a largely unexpected upsurge in C-19 has been the culprit, leading to re-imposition of some restrictions, or the exercise of more caution in re-opening drives.
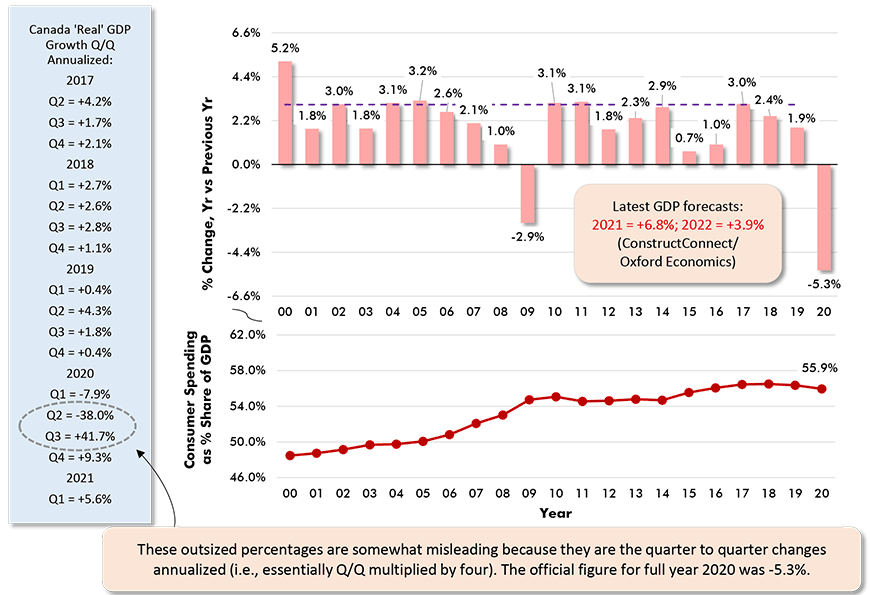
Chart: ConstructConnect.
The Stock Markets Pay No Heed
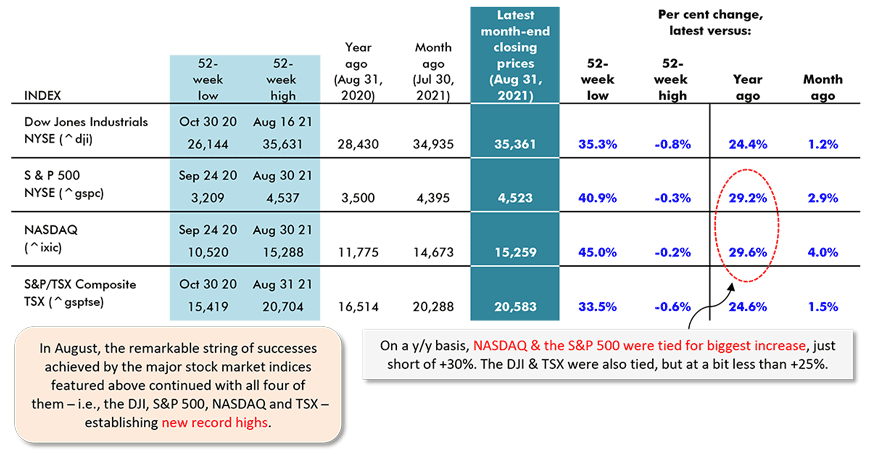
As Table 1 points out, however, the stock markets are having none of it. They’re discounting the questionable news and staying onboard with what they believe will hold true.
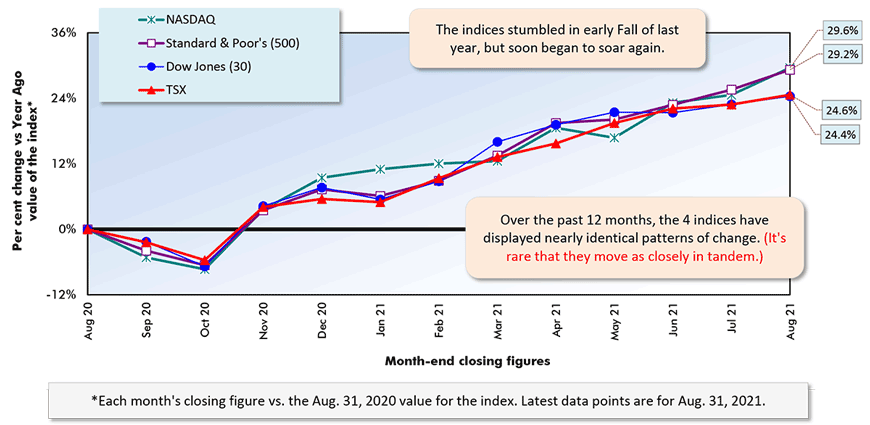
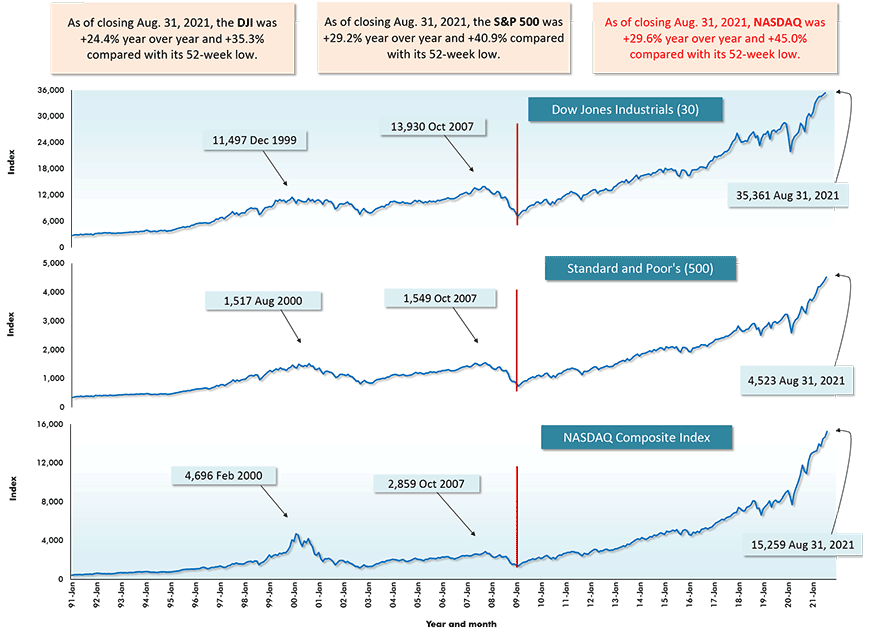
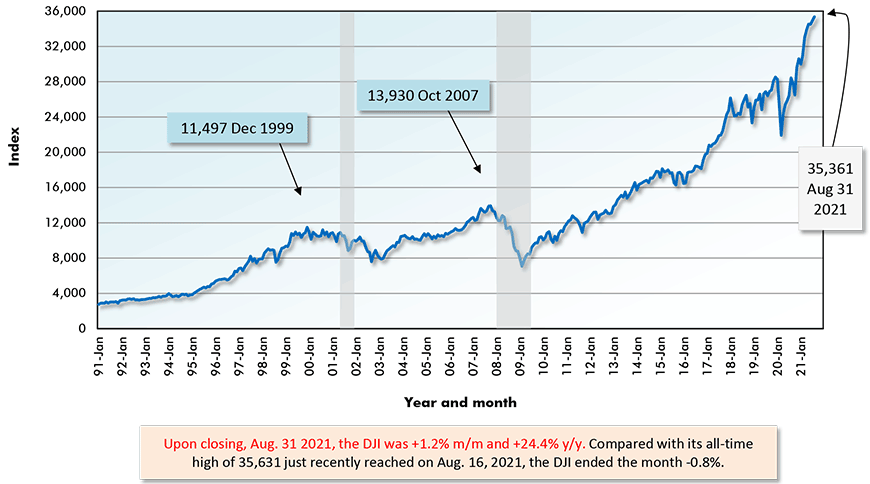
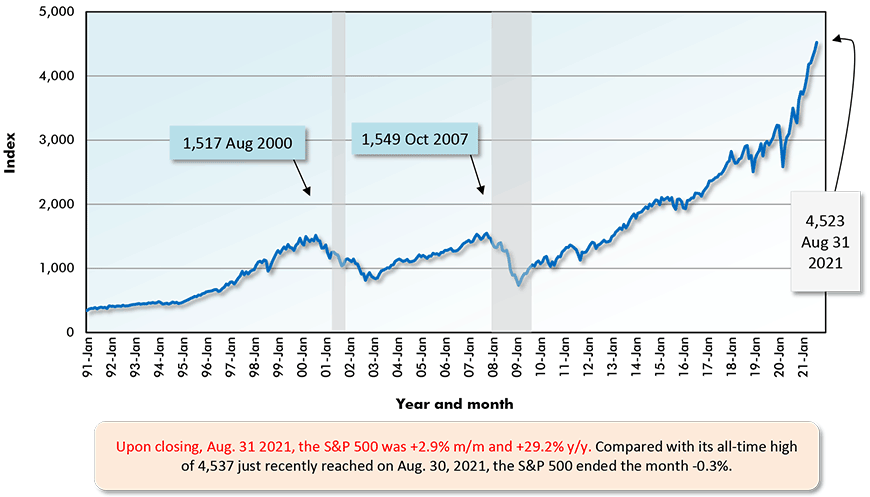
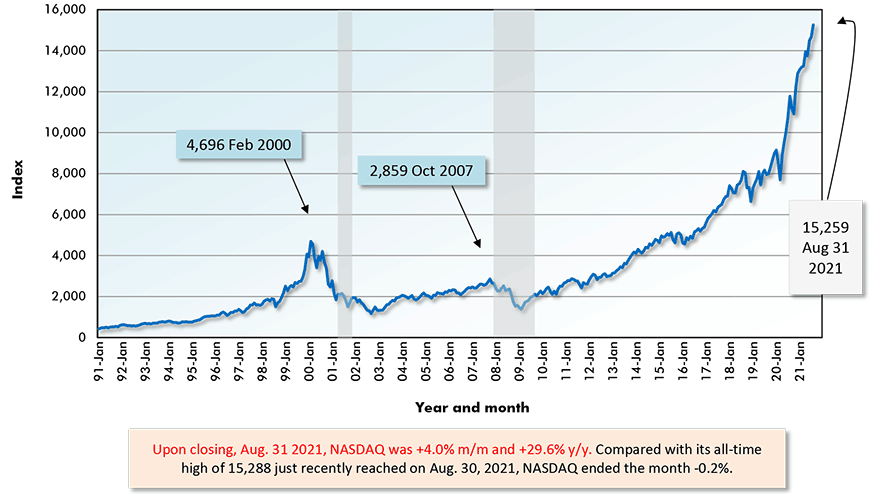
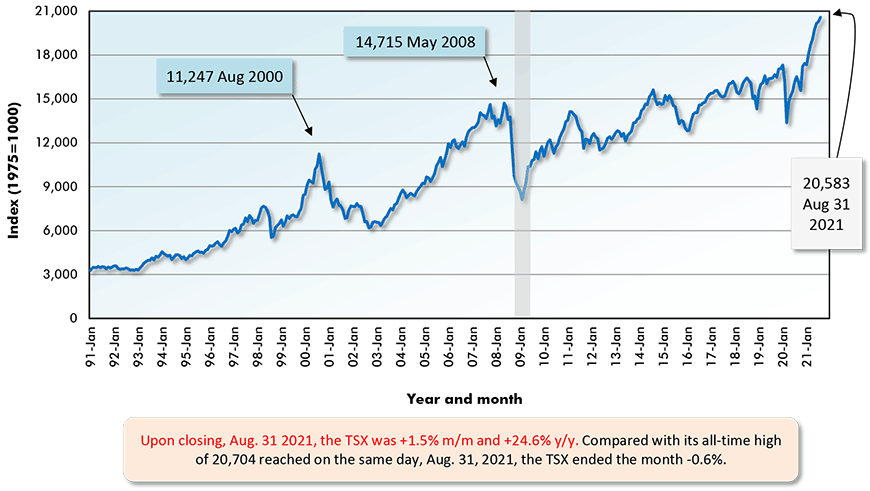
The four North American indices showcased in Table 1 all set new record highs in August. The long-term histories (from January 1991 onwards) of the index values for the DJI, S&P 500, NASDAQ and TSX appear in Graphs 7 through 10 at the end of this article.
A fifth North American index, the Russell 2000 (for firms with smaller capitalizations), has just turned in the biggest year-over-year increase among stock market indices worldwide, +45.6% (see Graph 3 and Table 2).
The runner-up to the Russell 2000 for y/y climb in August was the ‘iShares 100 Frontier Pre-emerging Economies’ index, +33.8%.
STOXX Europe managed a y/y gain (+28.9%) that was almost a match for NASDAQ (+29.6%) and the S&P 500 (+29.2%).
As for performances over a shorter time frame, the Shanghai Composite index was the leader at +4.3% month to month. China’s GDP growth this year is expected to be around +8%.
China’s Q1 2021 GDP increase was +18.3% (not annualized, but rather compared with Q1 2020). 2021’s Q2 (vs 2020’s Q2) GDP result wasn’t quite as strong, but it was still noteworthy, +7.9%. In Q1 2020, China’s GDP shrank by -6.8%, but the entire year still came in at +2.3%, the only increase among major nations.
With an eye to emulating the success of NASDAQ, Beijing is planning on setting up a new index for SMEs, small and medium-sized enterprises with a need for venture capital.
Finally, as a point of interest, the Toronto Stock Exchange, which has struggled to make significant headway over the past many years, beat (although just barely) the Dow Jones Industrials index on a y/y basis as of August’s closings. The TSX was +24.6% y/y to the DJI’s +24.4%.
The TSX is being given new life by the improved prospects for commodities markets. For the construction sector, higher demand and prices for raw materials will translate to more onsite activity. Historically, many of the projects reaching ‘mega’ status have been resource-extraction projects.
Securities Dealers Automated Quotations (NASDAQ), Toronto Stock Exchange (TSE) and Reuters.
Table: ConstructConnect.
Year over Year as of Month-end Closings, August 31, 2021
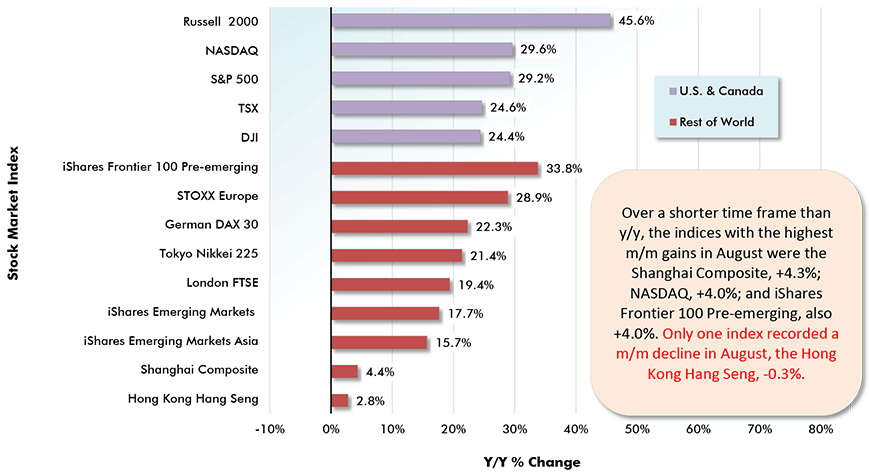
Chart: ConstructConnect.
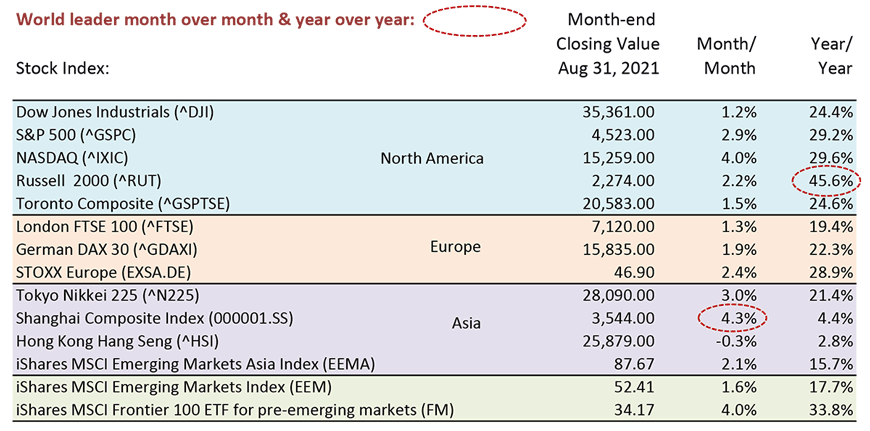
Table: ConstructConnect.
Securities Dealers Automated Quotations (NASDAQ), Toronto Stock Exchange (TSE) and Reuters.
Chart: ConstructConnect.
Securities Dealers Automated Quotations (NASDAQ), Toronto Stock Exchange (TSE) and Reuters.
Chart: ConstructConnect.
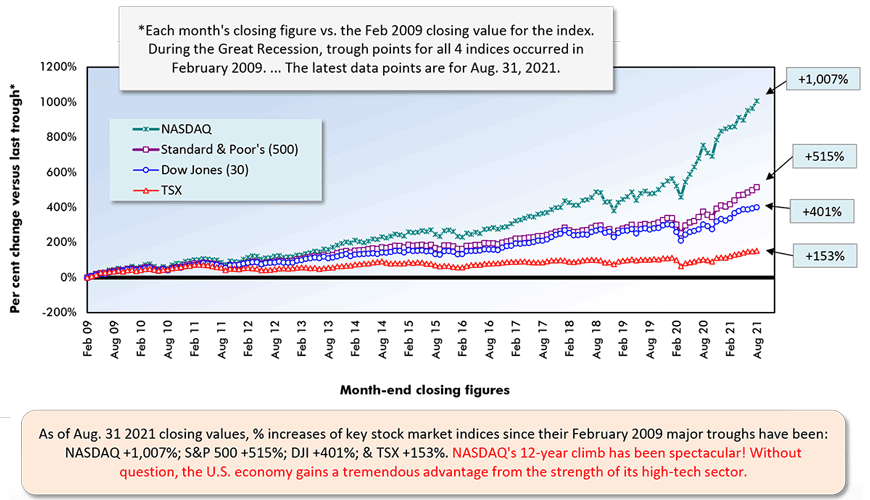
Red vertical lines denote Feb 2009 major ‘troughs’ for the indices.
Securities Dealers Automated Quotations (NASDAQ), Reuters & Yahoo.
Chart: ConstructConnect.
Securities Dealers Automated Quotations (NASDAQ), Toronto Stock Exchange (TSE) and Reuters.
Chart: ConstructConnect.
Securities Dealers Automated Quotations (NASDAQ), Toronto Stock Exchange (TSE) and Reuters.
Chart: ConstructConnect.
Securities Dealers Automated Quotations (NASDAQ), Toronto Stock Exchange (TSE) and Reuters.
Chart: ConstructConnect.
Securities Dealers Automated Quotations (NASDAQ), Toronto Stock Exchange (TSE) and Reuters.
Chart: ConstructConnect.
Alex Carrick is Chief Economist for ConstructConnect. He has delivered presentations throughout North America on the U.S., Canadian and world construction outlooks. Mr. Carrick has been with the company since 1985. Links to his numerous articles are featured on Twitter @ConstructConnx, which has 50,000 followers.
Please click on the following link to download the PDF version of this article:
Economy at a Glance Vol. 17, Issues 134 and 135 – Stock Markets Speed Along, Oblivious to Blind Spots – PDF


Recent Comments
comments for this post are closed