Graph 2 at the end of this article shows that the gap between high year-over-year material cost increases, as captured in two Producer Price Index (PPI) series, and relatively restrained year-over-year bid price increases from contractors (also coming from a PPI) is narrowing, but it remains immense.

The respective percentage-change figures in August, the latest month for which data is available, were +21% and +31% for materials, according to two alternative PPI measures, but +5% for bid prices.
Interestingly, +5% isn’t low. It’s a match for the currently concerning rate of general price inflation as reflected in the all-items Consumer Price Index (CPI). But +5% appears mild next to +31% or +21%.
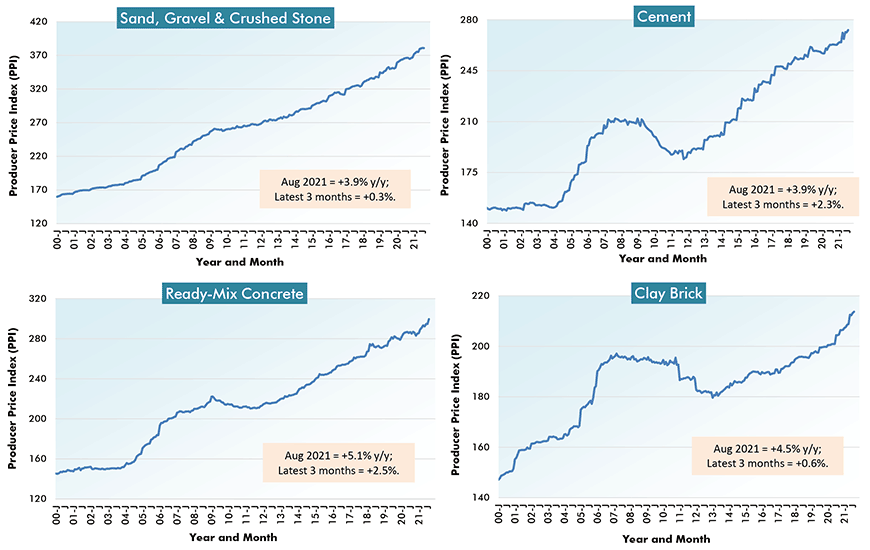
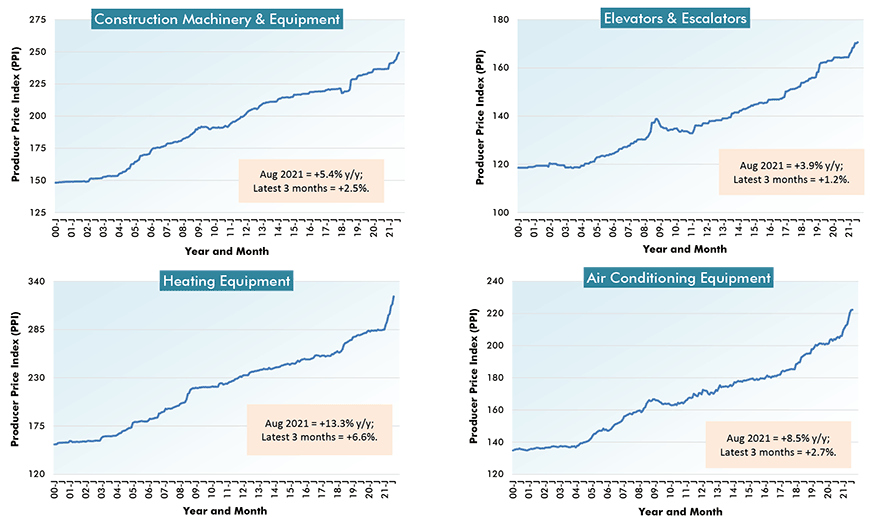
The journey to Graph 2 through this article showcases the latest inordinately large increases in material costs (Graph 1) and the history of price changes for 28 construction inputs (Cluster Charts 1 to 7). Also, Table 1 includes pricing results for some additional construction components, plus PPI compilations of materials going into certain types-of-structure.
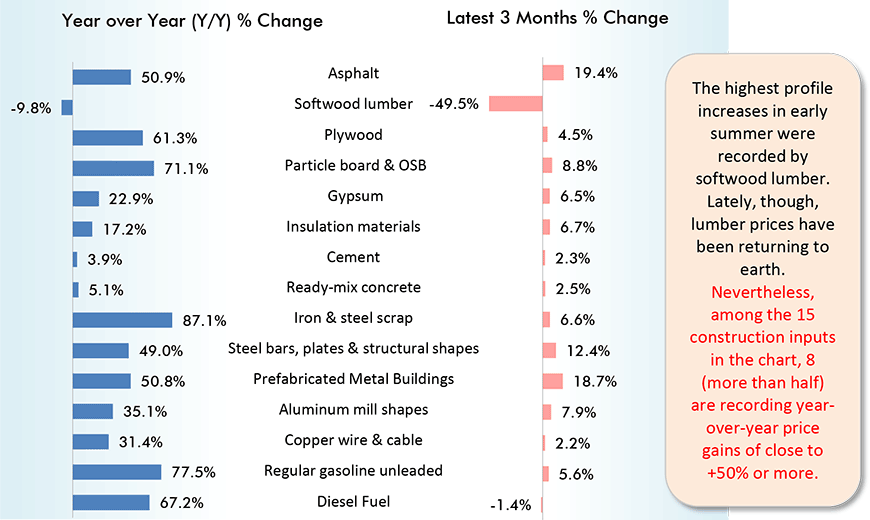
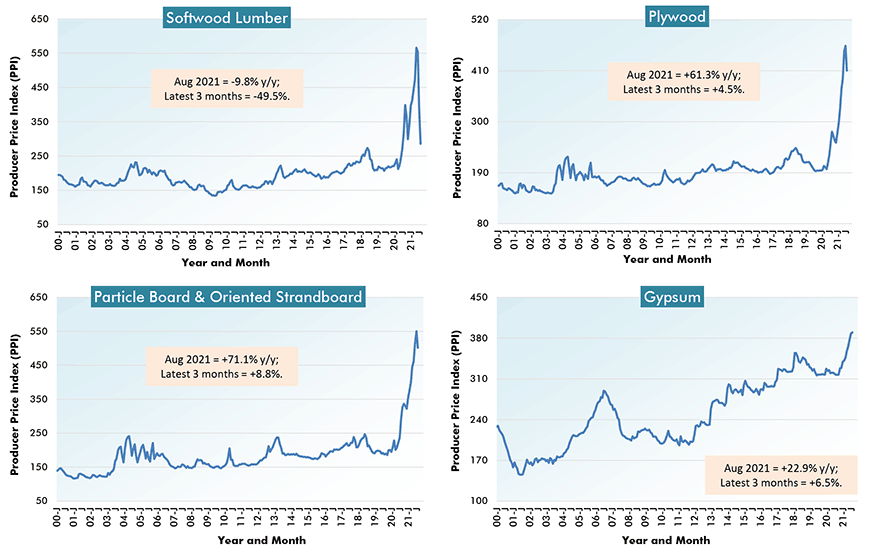
In late Spring, early Summer, huge hikes in the price of softwood lumber caught everyone’s attention. But that ‘madness’ has now passed. More sawmill capacity has been brought onstream, imports have been upped somewhat, the flurry of home renovation activity has eased with the onset of Fall and housing starts, after rising sharply, have leveled out.
In Graph 1, softwood lumber prices are shown to have dropped by half (-49.5%) over the latest three months. As a result, media headlines have moved on to different subject matter. But that’s surface coverage. There are plenty of other construction materials and components (including forestry products separate from softwood lumber) that are continuing to exhibit pricing strength.
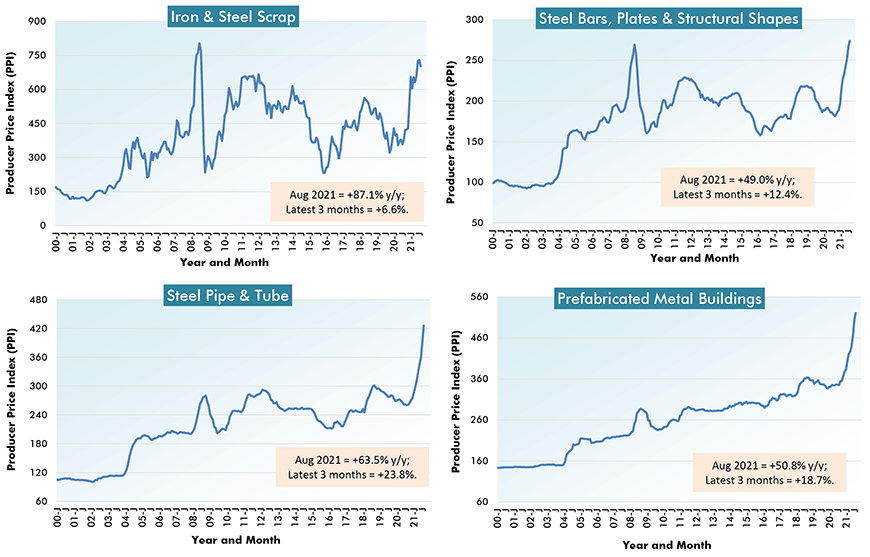
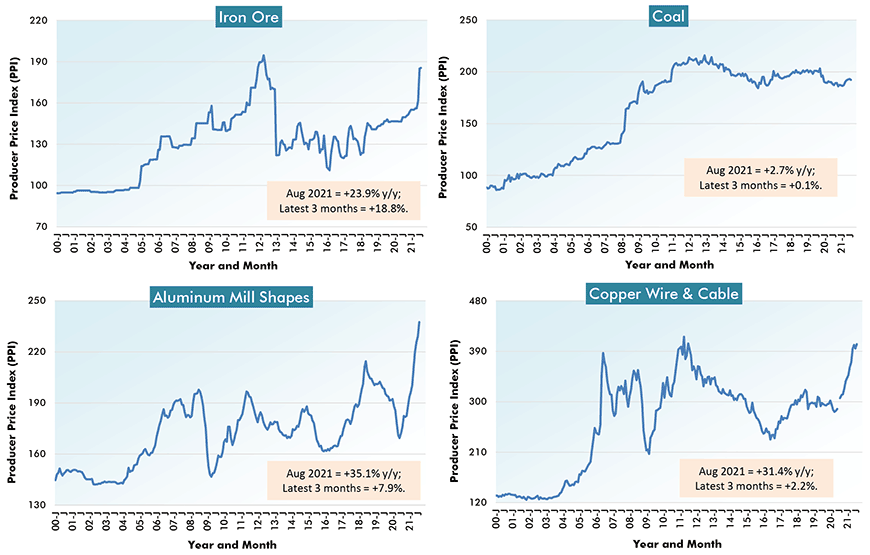
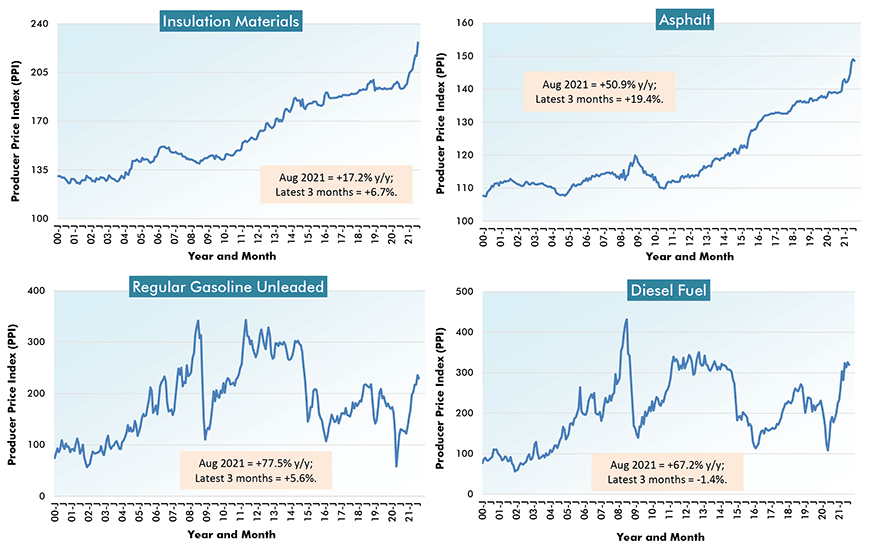
The curves with recent ‘mountain peaks’ among the cluster charts include plywood, particle board, steel items, aluminum mill shapes, copper wire and cable, asphalt and gasoline.
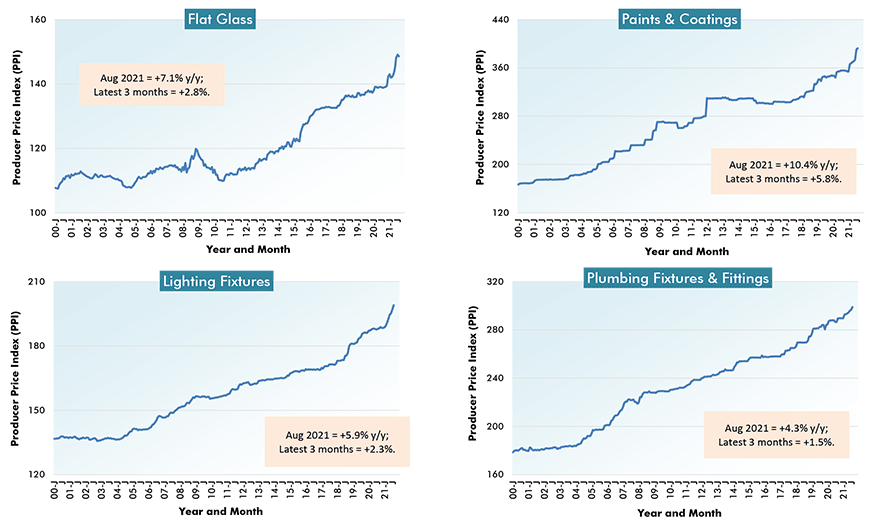
There are also big year-over-year price increases for gypsum (+22.9%), insulation materials (+17.2%), heating equipment (+13.2%) and paints and coatings (+10.4%). Not too alarming, but still attention-worthy, are the y/y price increases for air conditioning equipment (+8.5%) and flat glass (+7.1%).
From Producer Price Index (PPI) Series – August 2021
Charts: ConstructConnect.
Charts: ConstructConnect.
Charts: ConstructConnect.
Charts: ConstructConnect.
Charts: ConstructConnect.
Charts: ConstructConnect.
Charts: ConstructConnect.
Charts: ConstructConnect.
% Change in the August 2021 Index from:
| 3 Years | 1 Year | 6 months | 3 months | 1 month | |||||
| Ago | Ago | Ago | Ago | Ago | |||||
| Final Demand/Service/Commodity/Energy/Input: | |||||||||
| Final Demand Construction | 12.9% | 5.0% | 4.7% | 2.4% | 0.2% | ||||
| New warehouse building construction | 13.6% | 7.1% | 6.9% | 3.5% | 0.2% | ||||
| New school building construction | 13.1% | 3.4% | 3.7% | 2.6% | 0.1% | ||||
| New office building construction | 13.2% | 6.0% | 4.8% | 1.5% | -0.3% | ||||
| New industrial building construction | 15.5% | 5.0% | 4.9% | 4.0% | 1.1% | ||||
| New health care building construction | 11.7% | 4.4% | 4.7% | 1.4% | 0.6% | ||||
| Architectural & engineering services | 4.9% | 3.3% | 0.7% | 0.2% | 0.0% | ||||
| Construction machinery & equipment | 9.3% | 5.4% | 3.4% | 2.5% | 0.8% | ||||
| Asphalt | -4.0% | 50.9% | 26.1% | 19.4% | 1.1% | ||||
| Plastic construction products | 32.6% | 29.6% | 22.2% | 11.0% | 3.0% | ||||
| Softwood lumber | 18.6% | -9.8% | -30.8% | -49.5% | -27.3% | ||||
| Hardwood lumber | 28.2% | 44.3% | 21.2% | 5.9% | -0.3% | ||||
| Millwork | 23.1% | 16.8% | 9.8% | 0.8% | -2.3% | ||||
| Plywood | 78.0% | 61.3% | 38.2% | 4.5% | -11.5% | ||||
| Particle board & oriented strandboard (OSB) | 137.4% | 71.1% | 33.6% | 8.8% | -8.9% | ||||
| Gypsum | 12.4% | 22.9% | 14.2% | 6.5% | 0.5% | ||||
| Insulation materials | 15.1% | 17.2% | 10.5% | 6.7% | 4.4% | ||||
| Construction sand, gravel & crushed stone | 13.5% | 3.9% | 1.9% | 0.3% | -0.1% | ||||
| Cement | 8.0% | 3.9% | 3.1% | 2.3% | 0.6% | ||||
| Ready-mix concrete | 10.0% | 5.1% | 3.5% | 2.5% | 1.6% | ||||
| Precast concrete products | 17.3% | 9.5% | 5.9% | 1.9% | 0.5% | ||||
| Prestressed concrete products | 11.3% | 9.5% | 8.7% | 5.5% | -1.1% | ||||
| Brick (clay) | 9.2% | 4.5% | 2.9% | 0.6% | 0.2% | ||||
| Coal | -3.1% | 2.7% | 3.1% | 0.1% | -0.5% | ||||
| Iron ore | 29.6% | 23.9% | 19.6% | 18.8% | 0.2% | ||||
| Iron & steel scrap | 37.1% | 87.1% | 16.1% | 6.6% | -3.7% | ||||
| Steel bars, plates & structural shapes | 26.1% | 49.0% | 26.8% | 12.4% | 2.4% | ||||
| Steel pipe & tube | 42.6% | 63.5% | 42.8% | 23.8% | 9.2% | ||||
| Fabricated structural metal products | 32.9% | 32.4% | 25.0% | 12.1% | 3.2% | ||||
| Prefabricated Metal Buildings | 44.0% | 50.8% | 28.8% | 18.7% | 3.3% | ||||
| Aluminum mill shapes | 15.2% | 35.1% | 20.9% | 7.9% | 3.7% | ||||
| Flat glass | 9.3% | 7.1% | 4.6% | 2.8% | -0.3% | ||||
| Paints, architectural coatings | 22.0% | 10.4% | 7.2% | 5.8% | 0.5% | ||||
| Lighting fixtures | 13.4% | 5.9% | 5.1% | 2.3% | 1.0% | ||||
| Plumbing fixtures & fittings | 10.9% | 4.3% | 2.1% | 1.5% | 0.8% | ||||
| Elevators & escalators | 9.7% | 3.9% | 2.8% | 1.2% | 0.2% | ||||
| Heating equipment | 19.5% | 13.3% | 11.0% | 6.6% | 2.8% | ||||
| Air conditioning equipment | 14.3% | 8.5% | 5.4% | 2.7% | 0.1% | ||||
| Copper wire & cable | 26.7% | 31.4% | 15.8% | 2.2% | 1.9% | ||||
| Regular gasoline unleaded | 7.5% | 77.5% | 36.6% | 5.6% | -2.8% | ||||
| Diesel Fuel | 25.6% | 67.2% | 20.8% | -1.4% | -2.0% | ||||
| Inputs to new construction | 24.5% | 21.0% | 12.0% | 3.2% | -1.4% | ||||
| Inputs to new residential construction | 25.1% | 19.9% | 10.8% | 2.0% | -3.2% | ||||
| Inputs to new non-res construction | 23.1% | 21.4% | 12.4% | 4.0% | -0.1% | ||||
| Inputs to commercial construction | 23.0% | 21.4% | 12.9% | 4.7% | 0.4% | ||||
| Inputs to healthcare structures | 23.1% | 20.3% | 11.9% | 3.9% | -0.1% | ||||
| Inputs to industrial structures | 24.1% | 20.2% | 12.1% | 5.3% | 0.8% | ||||
| Inputs to highways & streets | 19.3% | 20.8% | 12.7% | 4.6% | 0.6% | ||||
| Inputs to power & communication structures | 22.0% | 22.1% | 13.0% | 3.9% | -0.2% | ||||
| Inputs to educational & vocational structures | 24.1% | 20.1% | 11.5% | 3.1% | -0.5% | ||||
| Construction materials (PPI ‘Special Index’) | 31.9% | 31.1% | 19.3% | 4.1% | 0.1% |
The ‘service’, ‘commodity’ and ‘energy’ indices (in the middle section of the table) are based on ‘factory-gate’ sales prices.
The ‘input’ indices (at bottom) reflect costs faced by contractors. They exclude capital investment (i.e., machinery & equipment), labor & imports.
The ‘input’ indices are built up from the ‘service’ (design, legal, transport & warehousing, etc.) ‘commodity’ and ‘energy’ indices.
Table: ConstructConnect.
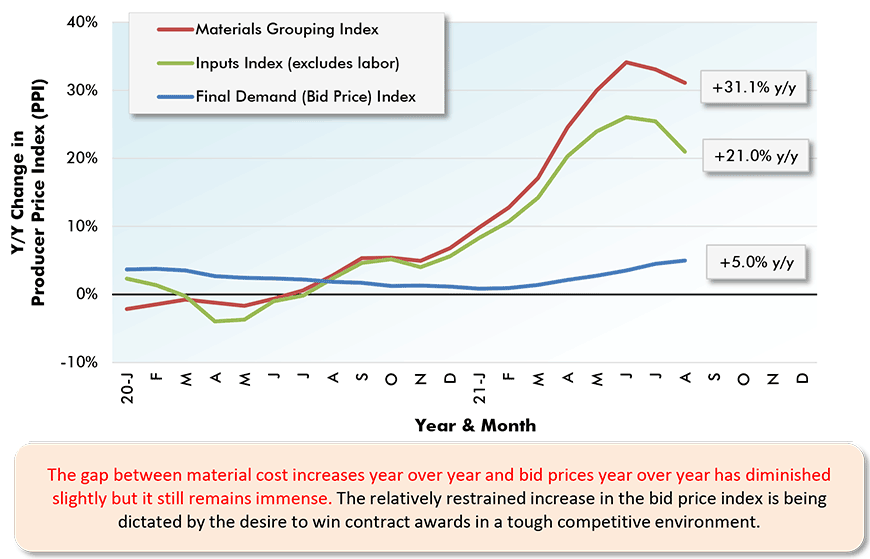
Chart: ConstructConnect.
Alex Carrick is Chief Economist for ConstructConnect. He has delivered presentations throughout North America on the U.S., Canadian and world construction outlooks. Mr. Carrick has been with the company since 1985. Links to his numerous articles are featured on Twitter @ConstructConnx, which has 50,000 followers.
Please click on the following link to download the PDF version of this article:
Economy at a Glance Vol. 17, Issue 142 – Gap Between Increases in Material Costs & Bid Prices Shrinks; Still Immense – PDF


Recent Comments
comments for this post are closed