
U.S. Housing Starts Stay Elevated
Construction activity in the U.S. is currently being sustained almost exclusively by residential work. Year to date through August, the put-in-place capital spending figures from the Census Bureau show the residential dollar volume to be +25.8% compared with Jan-Aug 2020 and nonresidential to be -6.7%. The grand total is +7.0%.

The usual proportions of residential to nonresidential in the total PIP numbers are 40% to 60%. Presently, residential has increased its prominence to claim an almost equal share, at 49.5%, to nonresidential construction’s 50.5%.
Among nonresidential construction’s 16 type-of-structure sub-categories, only one has managed a year-to-date increase in spending, ‘sewage and waste disposal’, +3.6%. Furthermore, that gain is tied to the burst of new single-family homebuilding that is taking place.
Housing starts in the U.S., as the average of the monthly seasonally adjusted and annualized (SAAR) figures through August of this year, have been ahead by one-fifth (+20.3%) versus the first eight months of last year.
The monthly average of single-family starts (in units) has been +23.9%, setting a pace nearly twice as fast as multi-family starts, +12.6%.
Year to date, singles have been 70.5% of total starts in units; multis, at 29.5%, have been less than a third.
U.S. new home starts have been maintaining their strength. Nor are there indications of a letup. ‘Permits’ are a leading indicator for starts and in August, the former clocked in at 1.728 million units to the latter’s 1.615 million units.
Graph 8 is based on the difference each month between the number of permits and the number of starts, both expressed as actual number of units (i.e., neither seasonally adjusted nor annualized).
Graph 8 then plots the 12-month moving totals of those differences. The curve illustrates that permits are continuing to run nicely ahead of starts.
The demand for new housing is being partly spurred on by the significant increases in prices occurring among existing homes.
The S&P CoreLogic Case-Shiller resale housing price index in July was +19.7% year over year nationally. The 10-city composite index was +19.1% y/y and the 20-city composite index, +19.9%. The three cities with the largest sales price advances were Phoenix, +32.4% y/y; San Diego, +27.8%; and Seattle, +25.5%.
Before leaving the U.S. to move on to Canada, there’s a development in Graph 5 that warrants mention. Cities in Texas hold positions one, two and four in the ranking of residential ‘permits’ issued year to date in America’s 36 most populous urban centers. Dallas-Ft Worth is the frontrunner, followed by Houston, with Austin in fourth spot.
Graph 1: U.S. Total Monthly Housing Starts
Seasonally Adjusted at Annual Rates (SAAR)
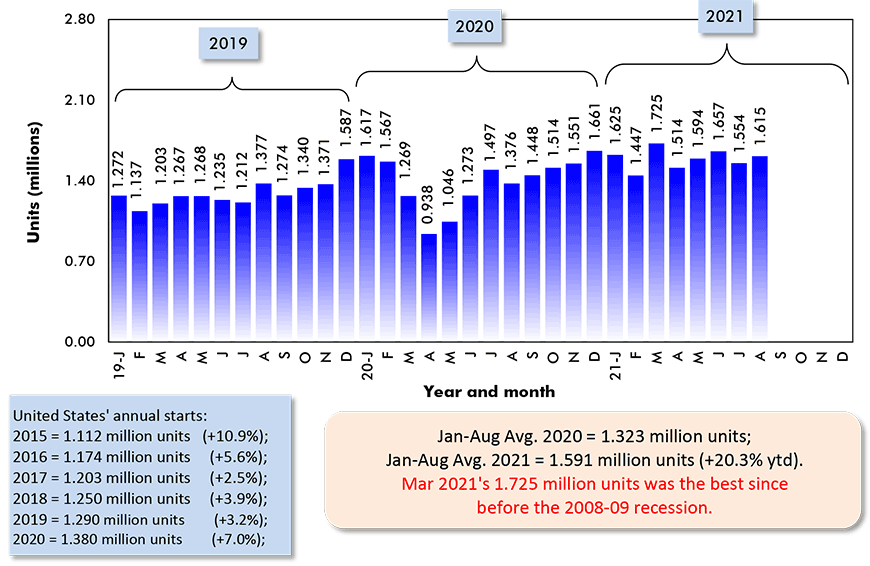
The last data points are for August 2021.
Data source: U.S. Census Bureau (Department of Commerce).
Chart: ConstructConnect.
Graph 2: U.S. Single-Family & Multi-Family Monthly Housing Starts
Seasonally Adjusted at Annual Rates (SAAR)
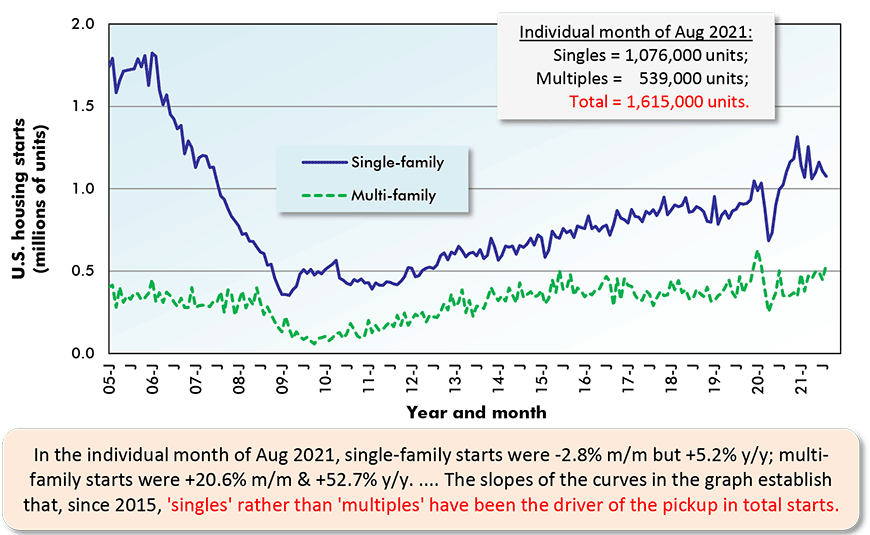
The last data points are for August 2021.
Data source: U.S. Census Bureau (Department of Commerce).
Chart: ConstructConnect.
Graph 3: U.S. Total Monthly Housing Starts
Seasonally Adjusted at Annual Rates (SAAR)
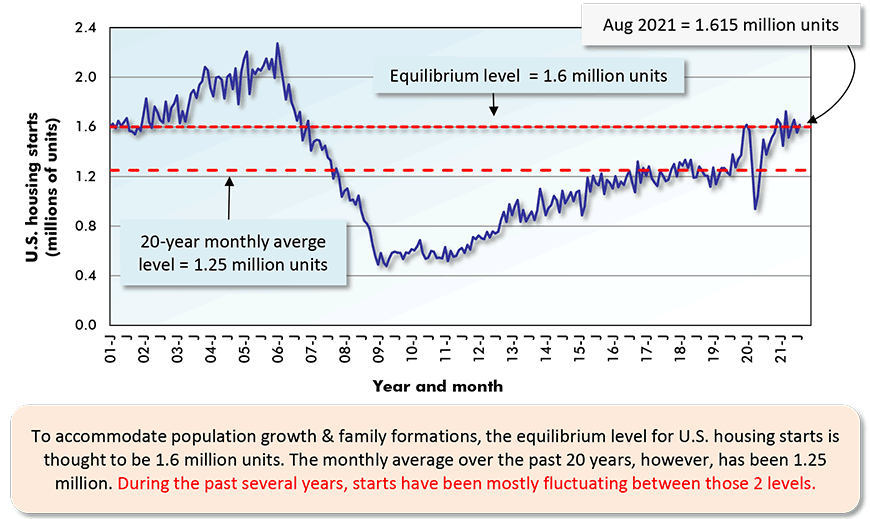
The last data point is for August 2021.
Data source: U.S. Census Bureau (Department of Commerce).
Chart: ConstructConnect.
Graph 4: U.S. Housing Starts
Jan-Aug 2021 vs Jan-Aug 2020 % Changes
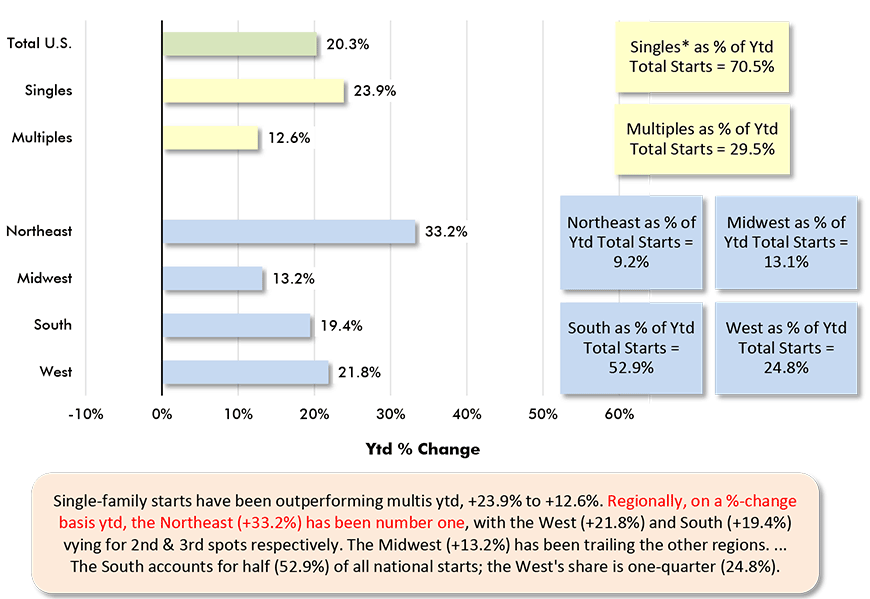
Based on averages of monthly seasonally adjusted and annualized (SAAR) unit starts.
* ‘Singles’ includes townhouse complexes, except when multiple units have common heating & air conditioning.
Data source: U.S. Census Bureau.
Chart: ConstructConnect.
Graph 5: Year to Date Residential Permits Issued (Units) in the 36 Most Populous U.S. Metro Statistical Areas (MSAs)
(Jan-Aug 2021)
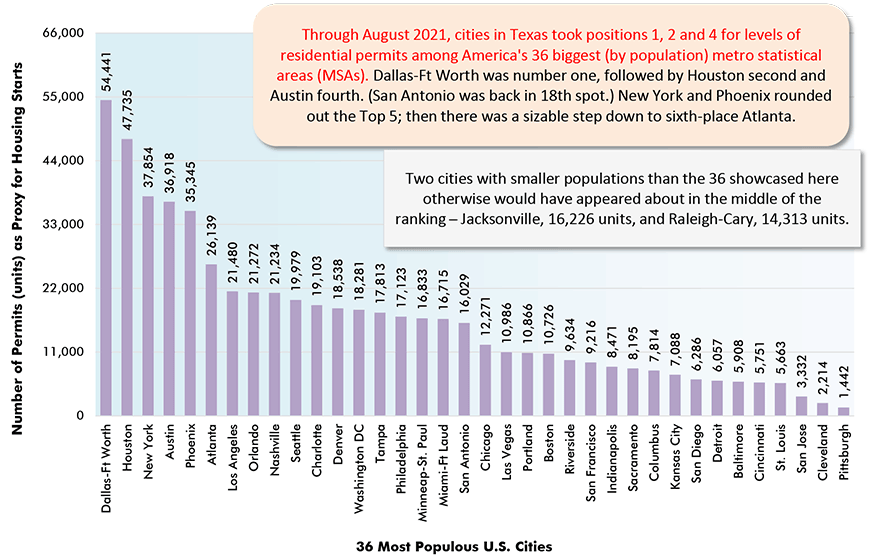
At the city level, the number of residential building permits issued serves as a proxy for housing starts.
Data source: U.S. Census Bureau.
Chart: ConstructConnect.
Graph 6: Percent Change in Year-to-Date Housing Permits Issued (Units) in the 36 Most Populous U.S. Metro Statistical Areas (MSAs)
(Jan-Aug 2021 vs Jan-Aug 2020)
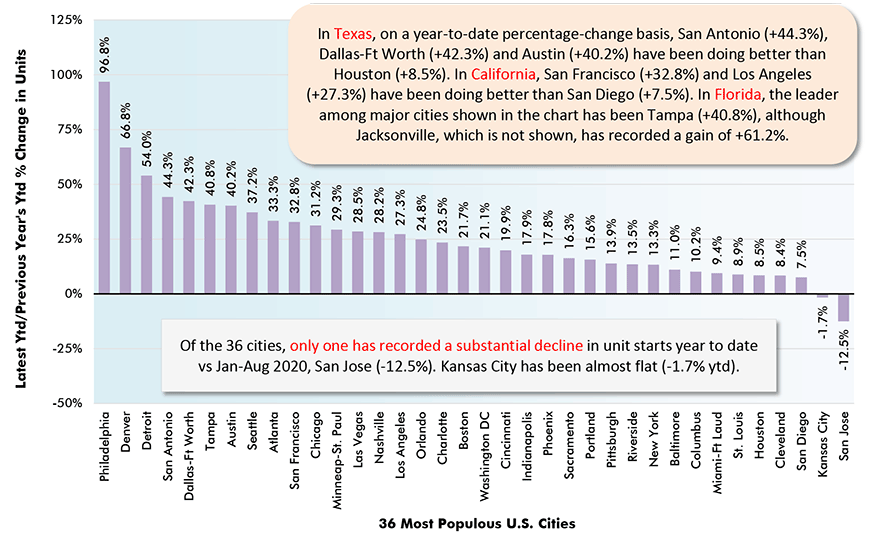
At the city level, the number of residential building permits issued serves as a proxy for housing starts.
Data source: U.S. Census Bureau.
Chart: ConstructConnect.
Graph 7: U.S. Monthly Residential Building Permits
Seasonally Adjusted at Annual Rates (SAAR)
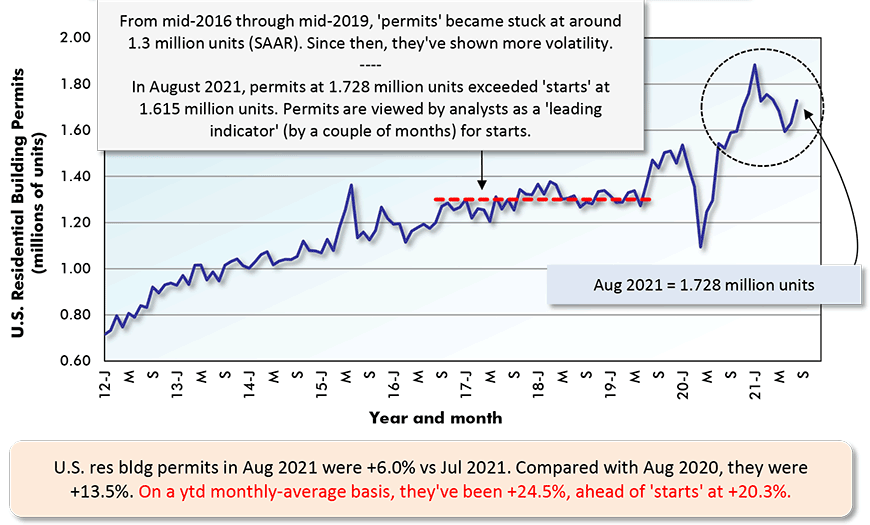
The last data point is for August 2021.
Data source: U.S. Census Bureau (Department of Commerce).
Chart: ConstructConnect.
Number of Housing Starts, Total U.S.
(From Not Seasonally Adjusted/NSA Actuals)
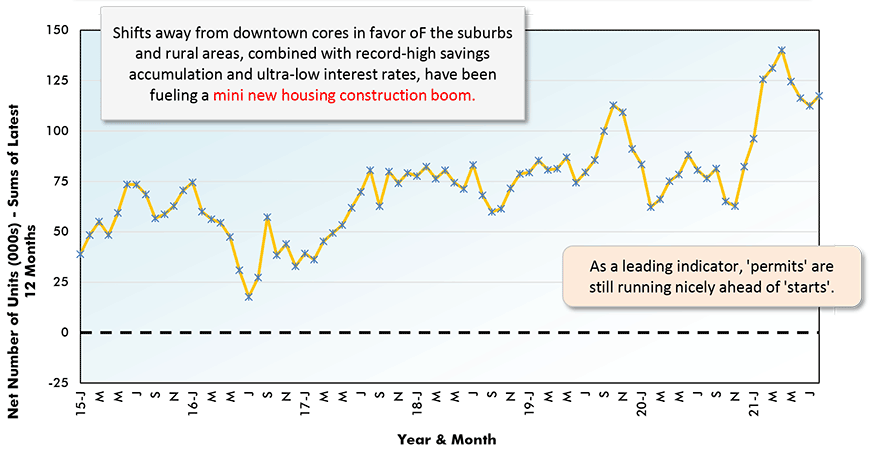
Chart: ConstructConnect.
Canada’s Housing Starts are Tailing Off Somewhat
Canada’s housing starts in August (260,000 units SAAR) were high compared with any month prior to this year. But within 2021, they were the weakest monthly result to date. Unlike the U.S., Canadian new home groundbreakings do appear to be tailing off.
Earlier this year, the monthly average of Canadian housing starts was ahead by one-half versus the long-term average of 200,000 units. Presently, the eight-month average of 286,000 units is up by one-third (+34.6%) compared with 2020’s Jan-Aug average of 212,500 units.
Among Canadian cities, Toronto is still leading in terms of ‘level’ of starts in ‘singles’, ‘multis’ and total. But Toronto’s total starts are -4% year to date. Cities in Toronto’s periphery, however, are having an excellent year for starts pickups. Guelph is +125%; Barrie, +122%; Oshawa, +84%; and Hamilton, +48%. A little further afield, Kitchener is +69%; and London, +110%.
In terms of year-to-date percentage changes, and for Canada’s six cities with populations greater than a million, Calgary is in the vanguard (Graph 14): singles, +72% vs Jan-Aug 2020; multiples, +74%; and total, +73%.
As for home resale prices north of the border, the Canadian Real Estate Association (CREA)’s MLS® Home Price Index (HPI) is +21.3% year over year nationally.
Prices are advancing more quickly in smaller population centers than in the super-sized metros.
According to CREA, among Canada’s three biggest (by resident count) cities, average home resale prices are +21.7% y/y in Montreal; +17.4% in Greater Toronto; +13.2% in Greater Vancouver. In the smaller communities of Okanagan Mainline (Kelowna), B.C. near the West Coast and in Saint John, New Brunswick on the East Coast, though, they are +29.1% y/y and +22.5% respectively.
Graph 9: Canada Monthly Housing Starts
Seasonally Adjusted at Annual Rates (SAAR)
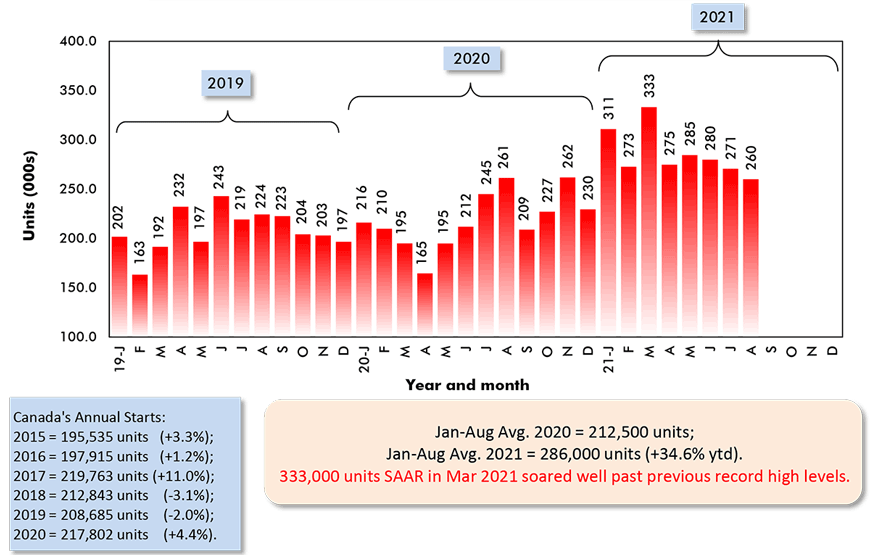
Data source: Canada Mortgage and Housing Corporation (CMHC).
Chart: ConstructConnect.
Graph 10: U.S. and Canada Monthly Housing Starts
Seasonally Adjusted at Annual Rates (SAAR)
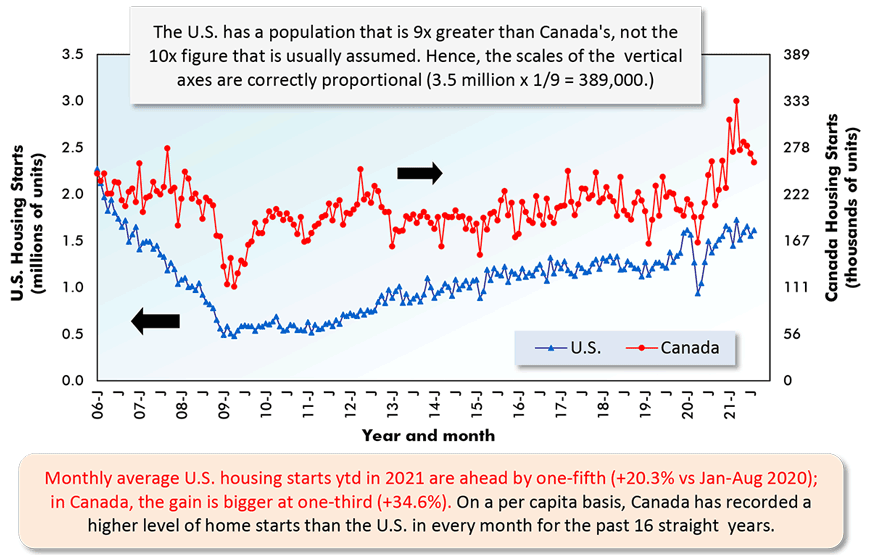
The last data points are for August 2021.
ARROWS: U.S. numbers to be read from left axis; Canadian from right axis.
Data sources: U.S. Census Bureau & Canada Mortgage and Housing Corp (CMHC).
Chart: ConstructConnect.
Graph 11: Percent Change in Year-To-Date Housing Starts –
Ranking Of Canada’s Provinces
(Jan-Aug 2021 vs Jan-Aug 2020)
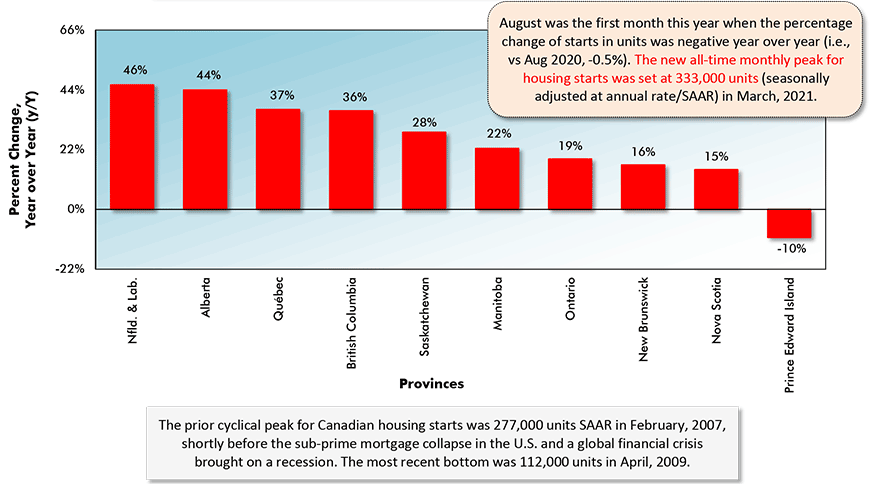
Data source: Canada Mortgage & Housing Corporation (CMHC) based on actuals rather than seasonally adjusted data.
Chart: ConstructConnect.
Graph 12: Percent Change in Year-To-Date Housing Starts –
Ranking Of Canada’s Major Cities
(Jan-Aug 2021 vs Jan-Aug 2020)
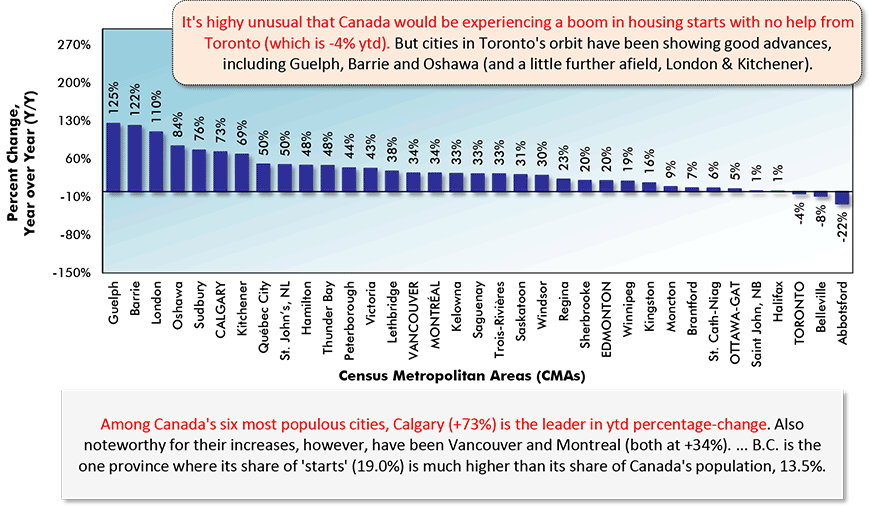
Canada’s Census Metropolitan Areas (CMAs) have core populations of 50,000 plus.
Canada’s 6 CMAs with populations in excess of 1 million are in capital letters.
Data source: Canada Mortgage & Housing Corporation (CMHC) based on actuals rather than seasonally adjusted data.
Chart: ConstructConnect.
Graph 13: Housing Starts in Canada’s 6 Most Populous Cities
January to August 2021 Actuals
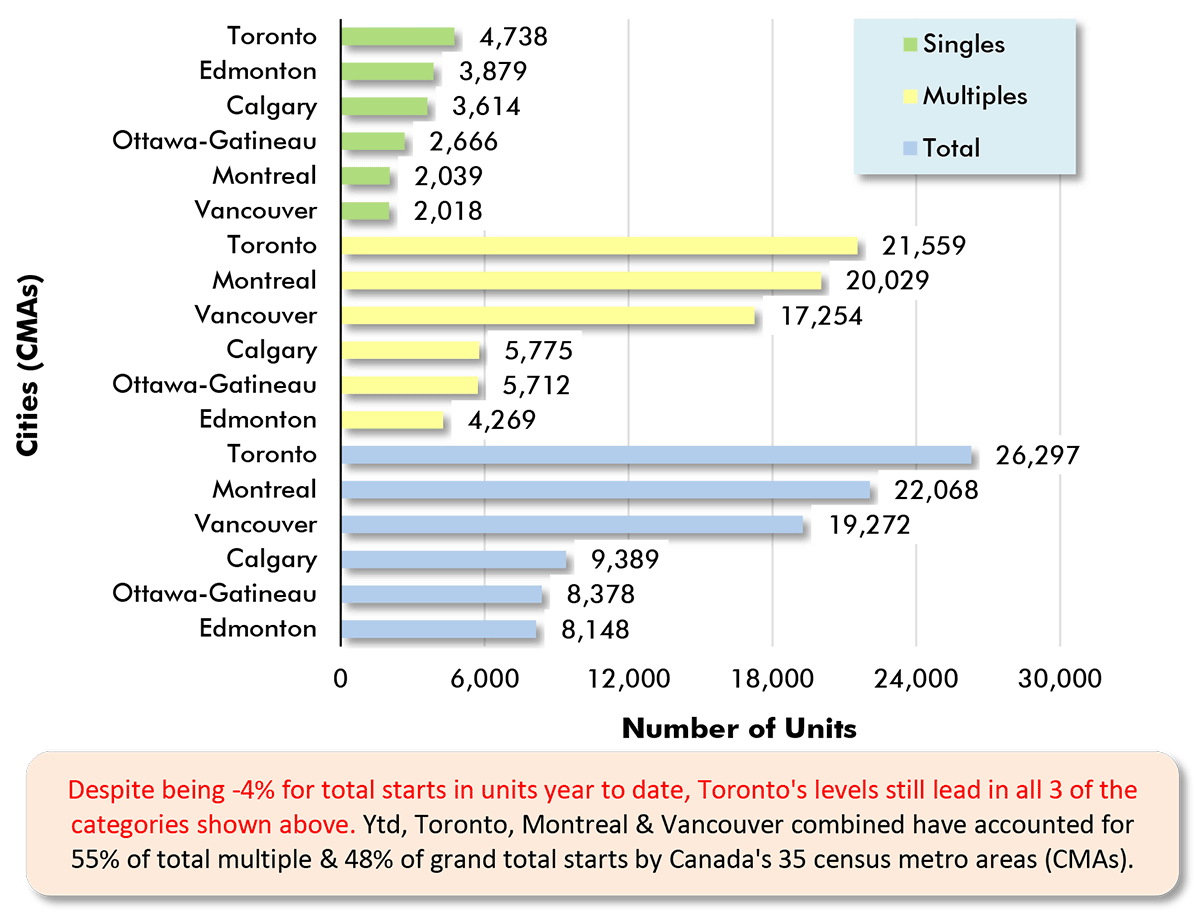
Data source: Canada Mortgage & Housing Corporation (CMHC).
Chart: ConstructConnect.
Graph 14: Housing Starts in Canada’s 6 Most Populous Cities
Jan-Aug 2021 vs Jan-Aug 2020
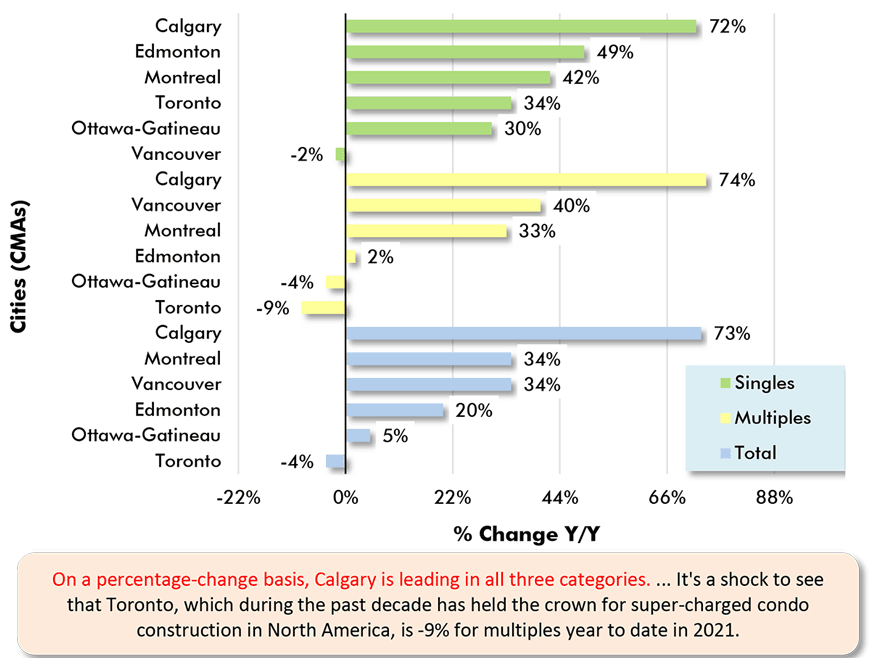
Data source: Canada Mortgage & Housing Corporation (CMHC).
Chart: ConstructConnect.
Alex Carrick is Chief Economist for ConstructConnect. He has delivered presentations throughout North America on the U.S., Canadian and world construction outlooks. Mr. Carrick has been with the company since 1985. Links to his numerous articles are featured on Twitter @ConstructConnx, which has 50,000 followers.
Please click on the following link to download the PDF version of this article:
Economy at a Glance Vol. 17, Issues 139 and 140 – The Homebuilding Juggernaut Keeps on Rolling in U.S. and Canada – PDF


Recent Comments
comments for this post are closed