
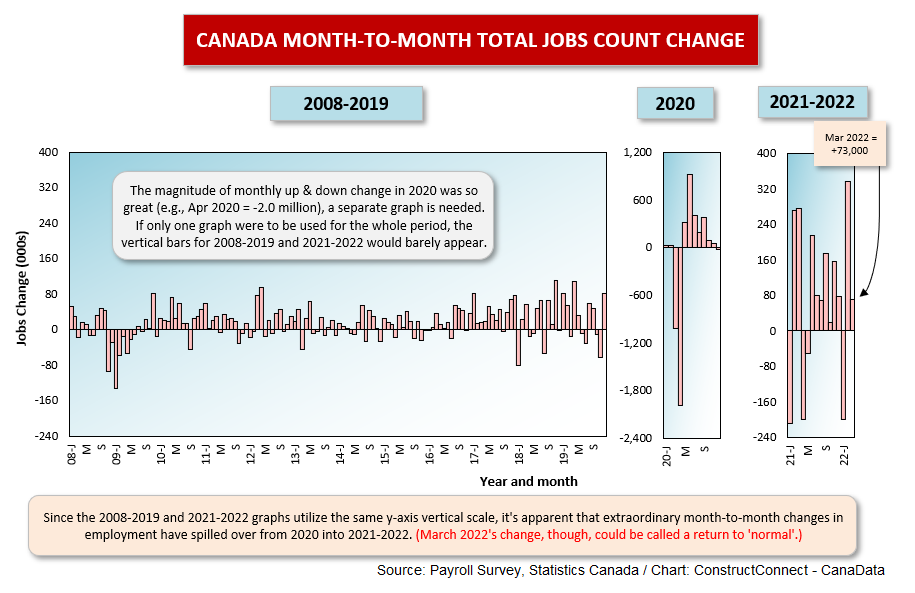
Statistics Canada’s Labour Force Survey for March speaks of a +73,000 month-to-month gain in total number of jobs in the land of the red maple leaf.
The +73,000 figure is a respite from the wild swings in February and January that came in at +337,000 and -200,000 respectively.
In the context of the long-term pre-pandemic record of jobs change from month to month in Canada, +73,000 is quite okay.
Construction’s employment increase in March was +14,000. Construction, with a total level of employment of 1.534 million jobs, is catching up with manufacturing, with a total level of employment of 1.760 million jobs.
 It’s by no means a foregone conclusion, however, that the total number of jobs in construction will eventually reach parity with manufacturing. Due to shortages of labor throughout the economy, construction work is likely to become more modular in nature, and that will slow the drift.
Nevertheless, there are numerous factors pointing to further robust increases in construction employment in the months and years ahead.
Housing starts in the nation have been booming. But international comparisons of existing housing stock (in units) per capita are placing Canada behind other industrialized nations, especially in Europe. To address this issue, the just-released federal budget includes provisions to hit the accelerator even more on residential homebuilding.
The target is to raise the 2000-2020 annual average number of units built from 200,000 to 400,000 over the next decade. A prime motivator for such an aggressive upswing will be Canada’s rapid rate of population increase, likely to range from +1.2% to +1.5% per year, dependent on whether the number of immigrant arrivals stays super-elevated (i.e., 400,000-plus per year).
Also, commodity prices are finally on the rebound, after lying mainly dormant for a decade. A new wave of resource development projects is already underway. Examples include a potash mine in Saskatchewan; a gold mine in Ontario; a hydrogen plant, employing electrolysis, in Quebec; and a possible doubling of LNG Canada’s capacity in B.C. The ‘old days’ of excessive demand for skilled trades people to work on mega projects appears set to return.
Plus, there are rapid transit projects to add to the construction mix in almost every major Canadian city. Toronto alone has a crosstown line (Ontario Place to the Ontario Science Centre) and the Hazel McCallion line (Port Credit to Brampton).
Startlingly Low Unemployment Rates
The most startling numbers from the latest Statcan jobs report relate to unemployment rates.
The seasonally adjusted (SA) national U rate dropped to just 5.3%, its all-time lowest level since the current methodology for the out-of-work number was first adopted in 1976.
Within industrial sectors, wholesale trade now has an NSA U rate of just 1.3%. A year ago, the figure had been 5.2%
The finance and insurance sector now has an NSA U rate of 1.0%; real estate rental and leasing, 1.3%; and health care and social services, 1.7%.
The services-providing sector in its entirety has an NSA U rate of just 2.8%. That’s exceedingly tight. In March 2021, the figure had been 4.9%.
Canadian construction’s NSA U rate is now 6.5%, down from 7.2% in February and 8.5% in March 2021.
Compensation Moving Gradually Higher
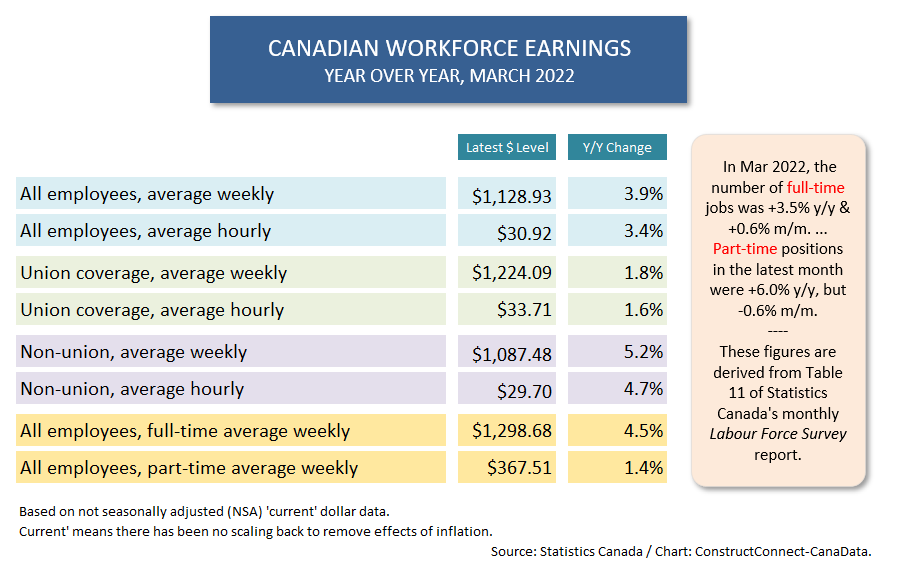
Compensation in Canada is moving higher, but at a slower pace than in the U.S. Where U.S. wages in the latest Employment Situation report were near +6.0% y/y hourly and weekly, in Canada the high range seems to be between +4.0% y/y and +5.0% y/y.
From Table 1, non-union wage increases are presently much heftier than ‘preset’ (i.e., negotiated earlier) union wage increases. For the former, the hourly rate is +4.7%; for the latter, +1.6%.
These numbers may well warn of possible labor strife ahead as organized workers seek to improve their lot, although it should also be pointed out that ‘gig’ workers (i.e., part-time workers) are only earning +1.4% y/y compared with full-time workers at +4.5% y/y.
Graph 1
Graph 2

Table 1
Graph 3

Alex Carrick is Chief Economist for ConstructConnect. He has delivered presentations throughout North America on the U.S., Canadian and world construction outlooks. Mr. Carrick has been with the company since 1985. Links to his numerous articles are featured on Twitter @ConstructConnx, which has 50,000 followers.


Recent Comments
comments for this post are closed