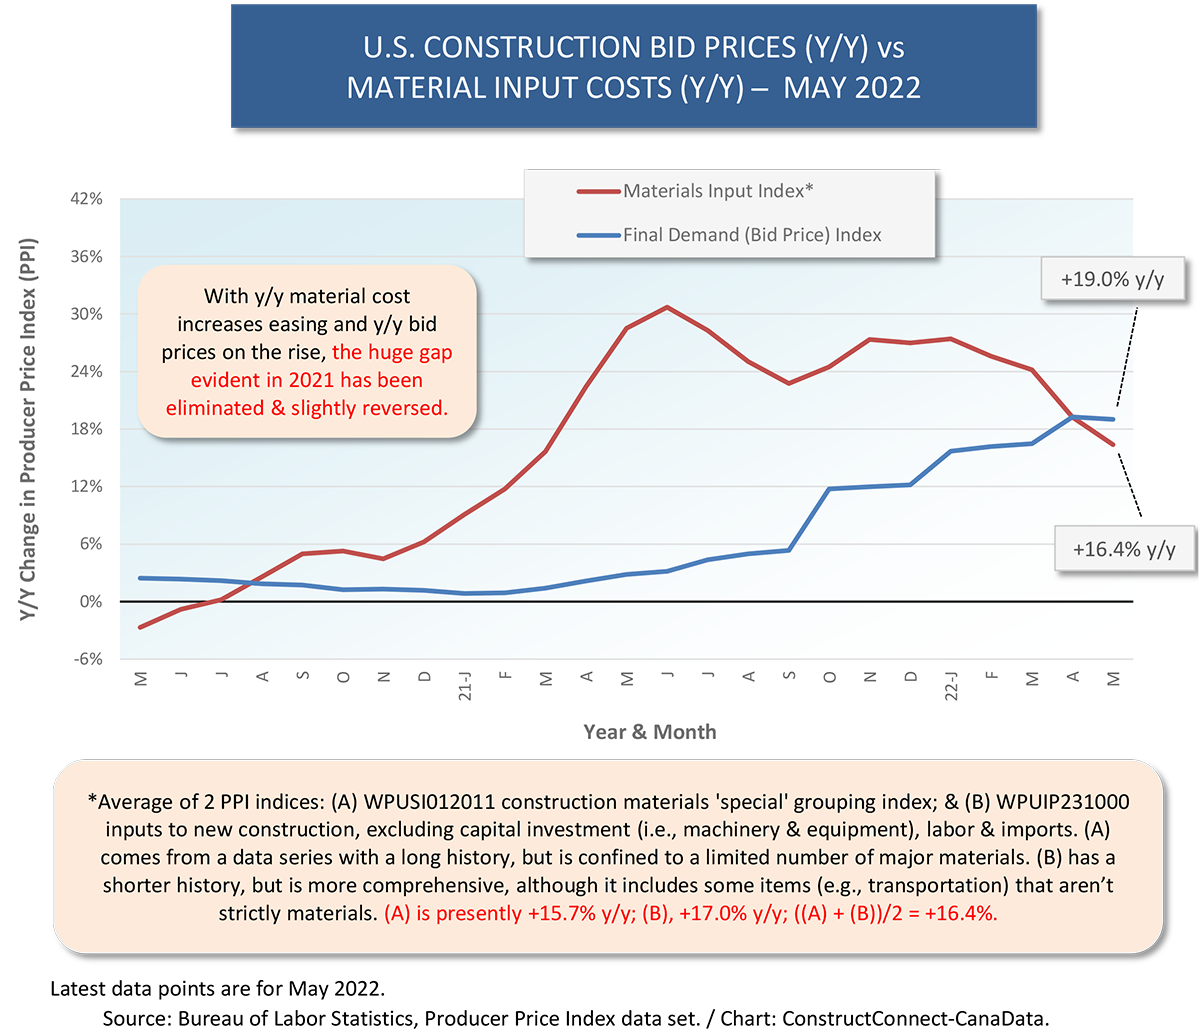
The enormous year-over-year increases in construction material costs evident in the middle of last year have eased substantially entering Summer of this year. Last year in June, the average y/y gain for the two Producer Price Index (PPI) series designed by the Bureau of Labor Statistics (BLS) to specifically capture construction input costs was +30.0%. The latest average y/y climb, for May 2022, is down by nearly half, to +16.4%.
 A year ago, the gap between the big jump in material costs year over year and the largely under-wraps bump in bid prices was enormous, plus-nearly-a-third versus plus-less-than-five percent.
Presently (May 2022), the material cost increase, as an average of the two key PPI indices, has retreated to +16.4%, while the PPI bid price index has ascended to +19.0% y/y. These patterns play out in Graph 1.
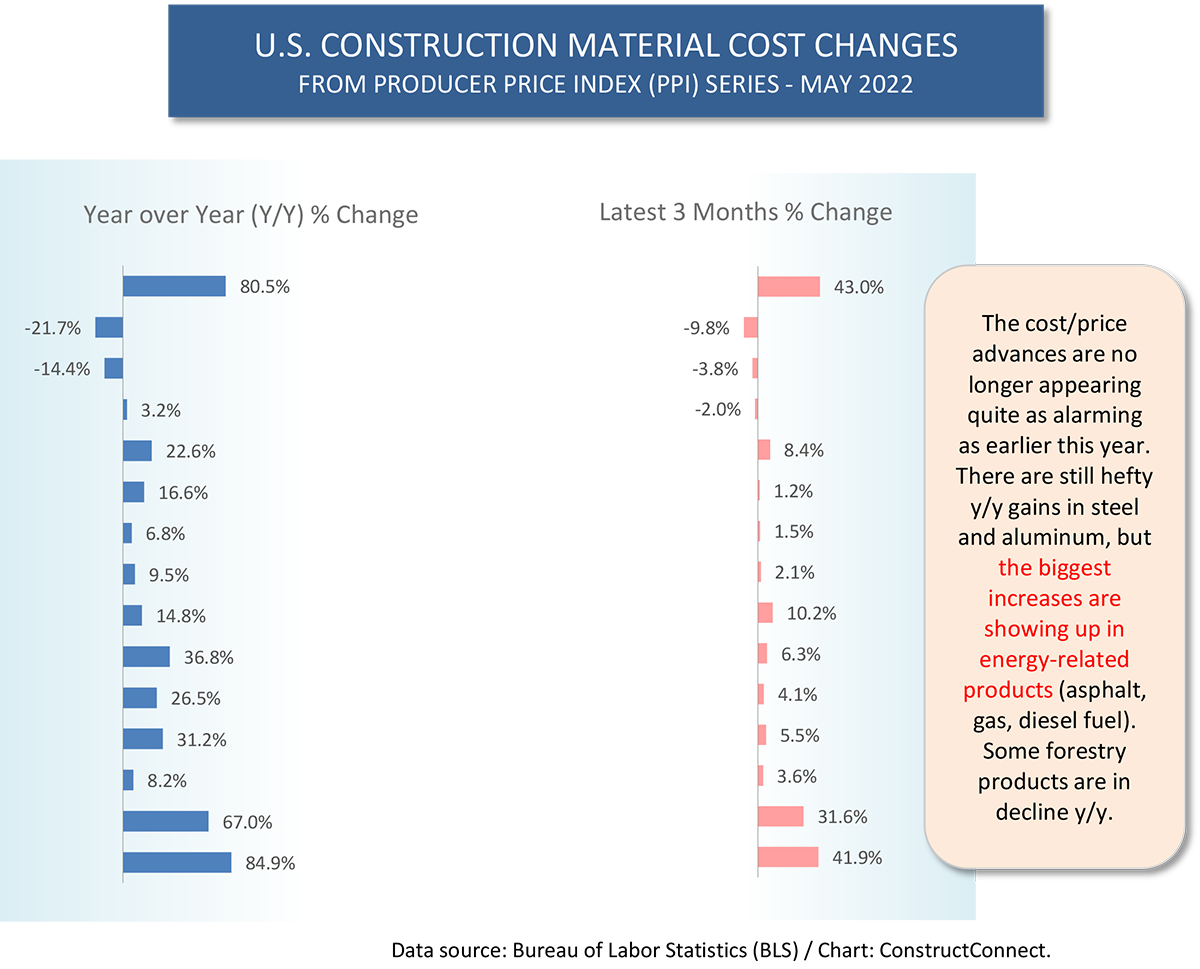
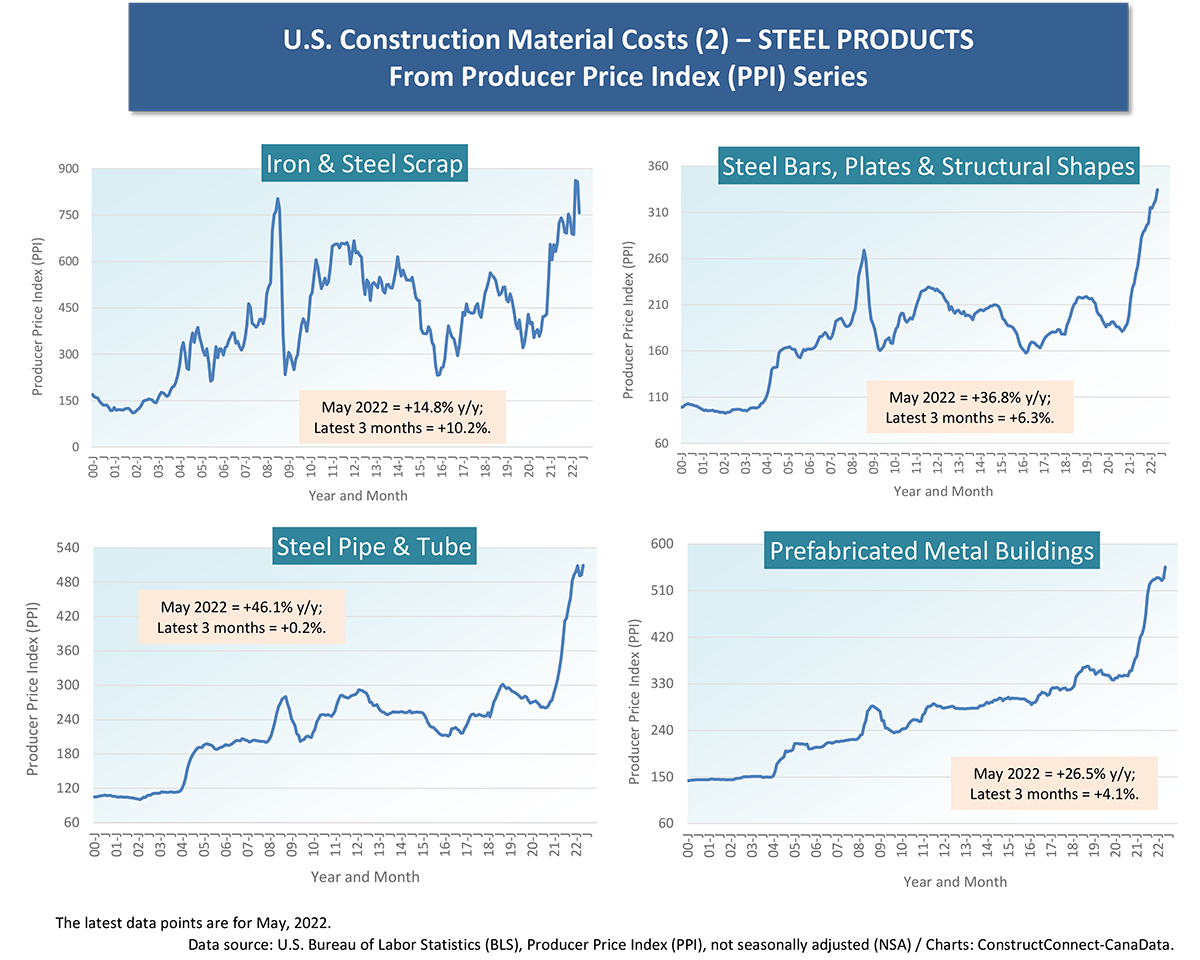
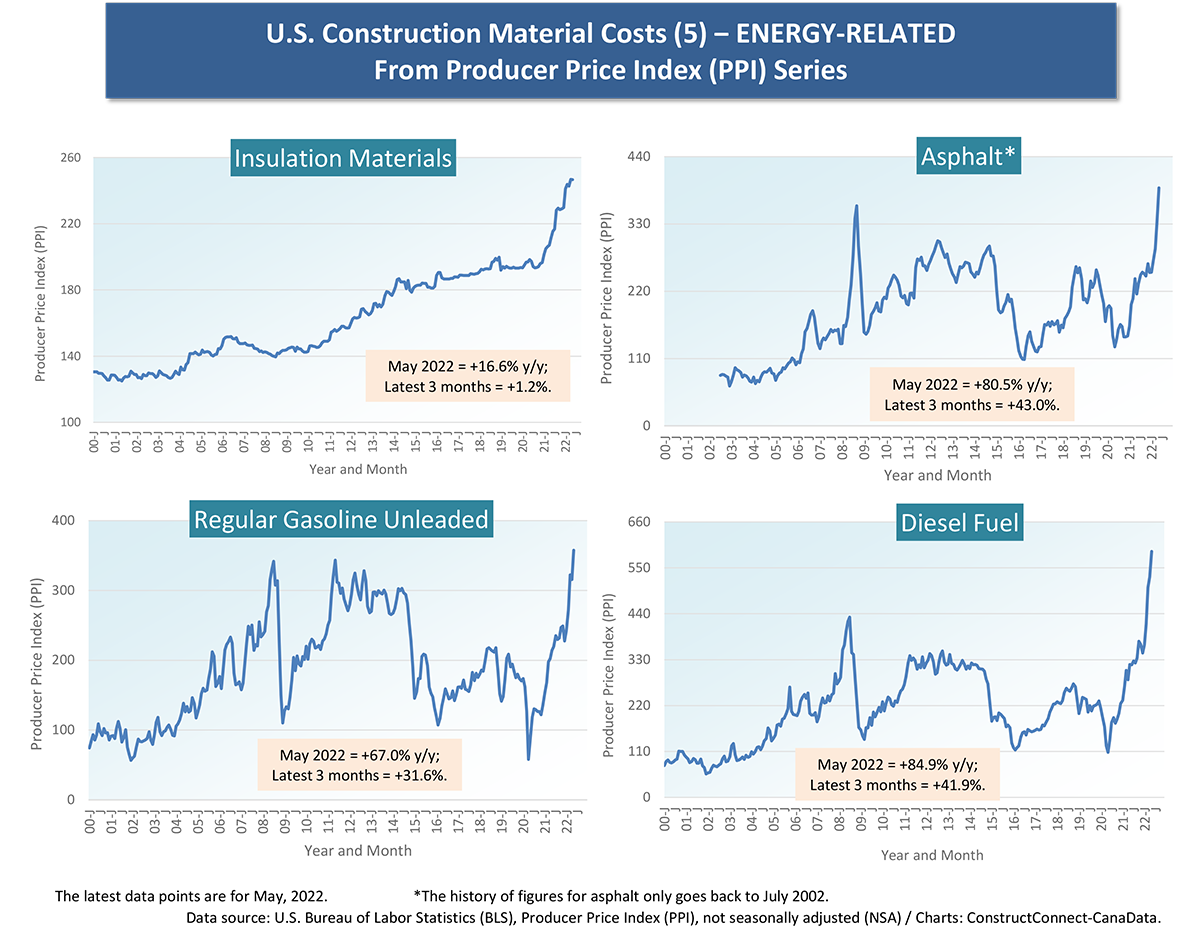
Graph 2 highlights that there are still hefty year-over-year price increases (or cost increases, depending on one’s perspective, as a seller or a buyer) for steel and aluminum products, but the largest jumps are being recorded by energy-related products. Diesel fuel is +84.9% y/y; asphalt, +80.5% y/y; and regular gasoline, +67.0%.
Nevertheless, the number of inputs with truly outsized percentage increases y/y is considerably less than earlier this year. Likewise for the latest three-month changes. Again, it’s mainly in the energy area where the biggest price surges are occurring.
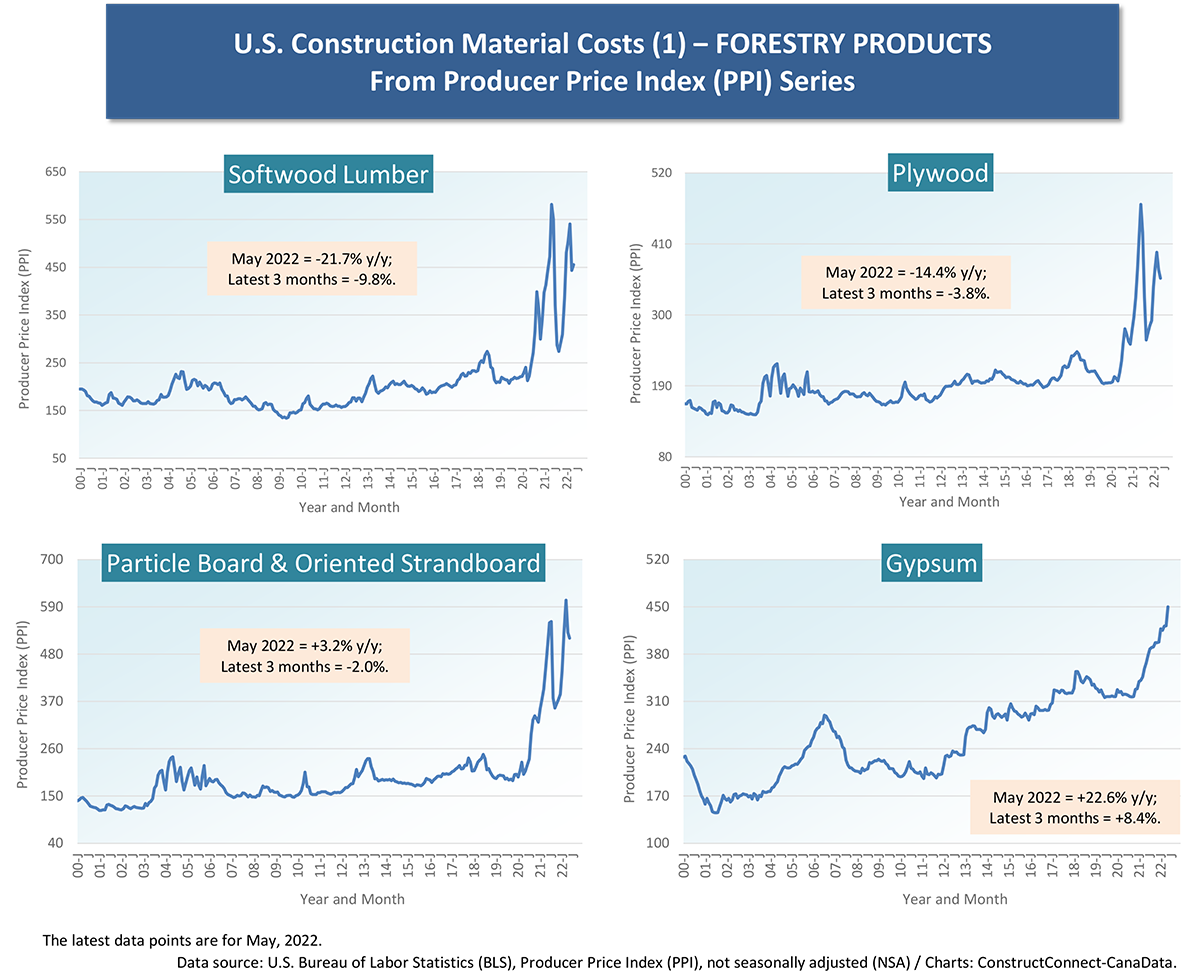
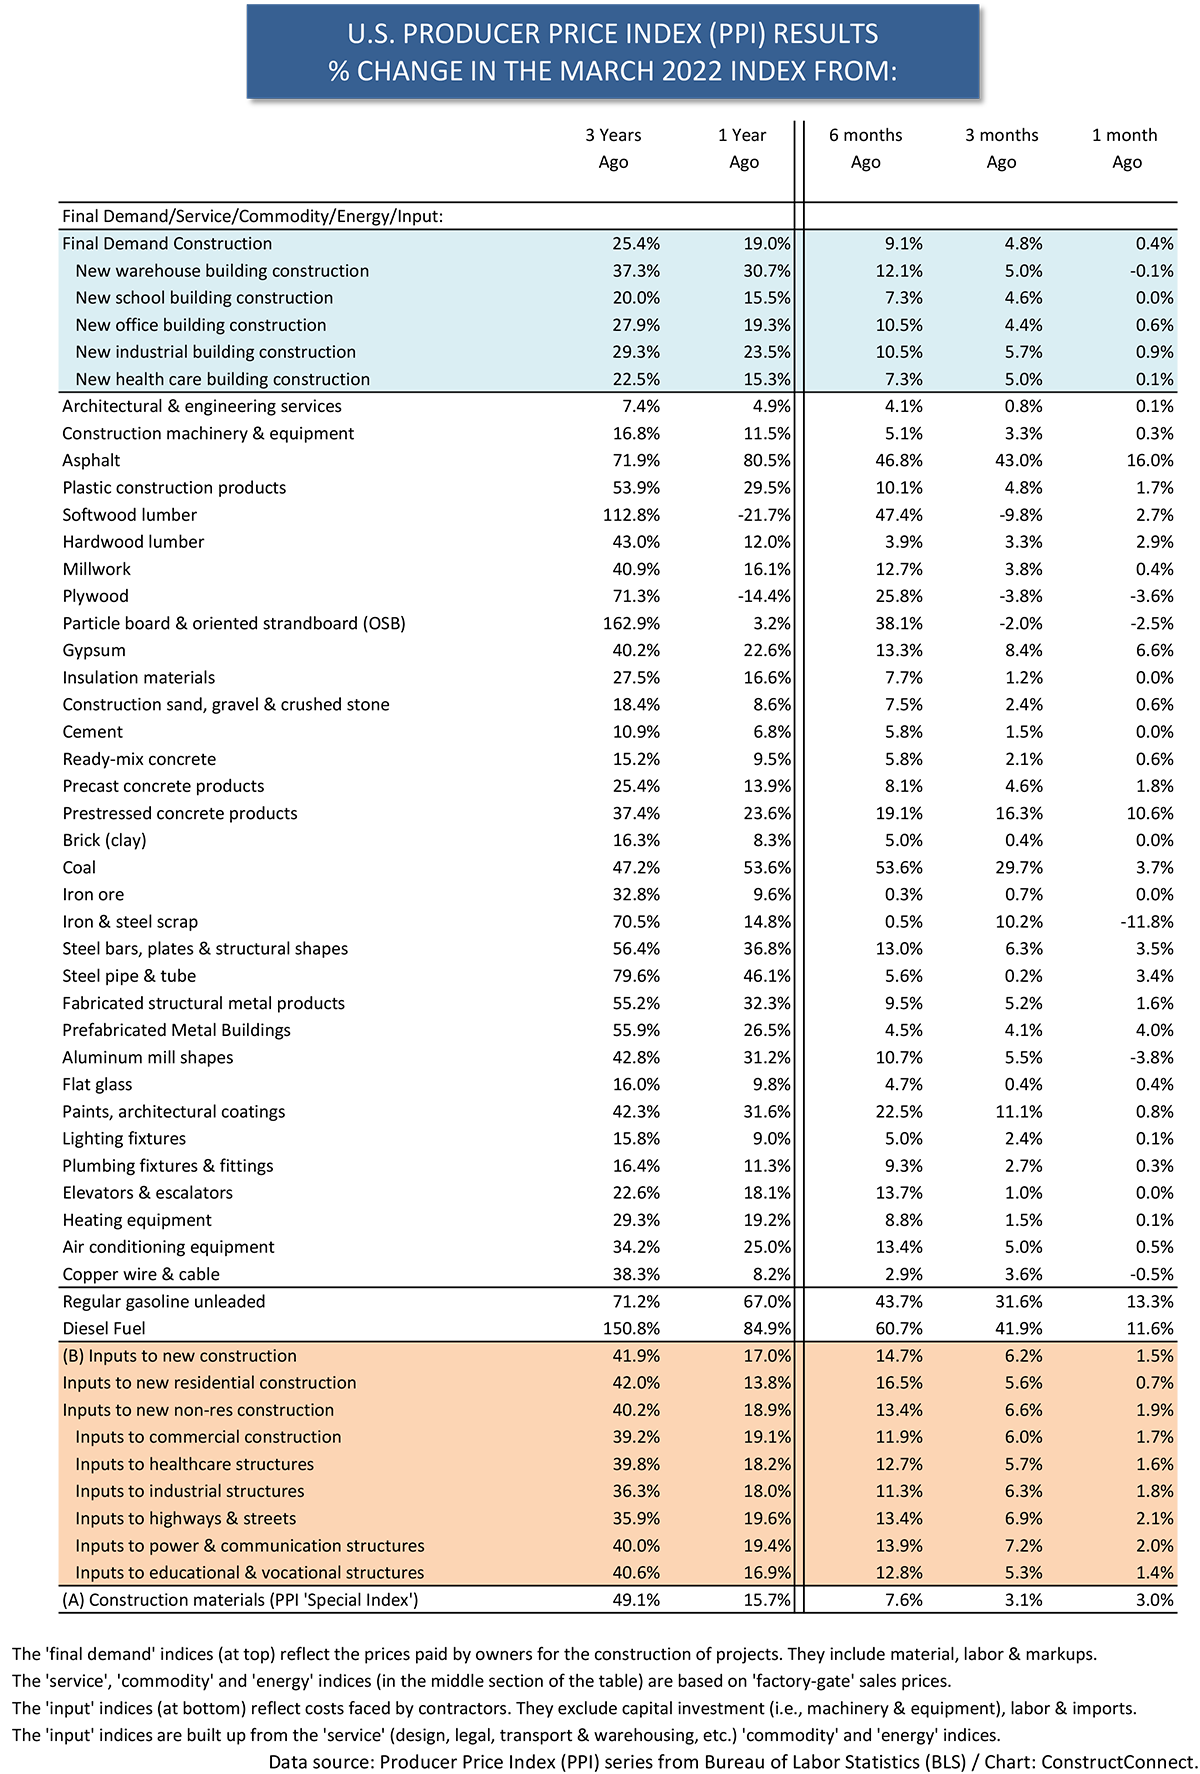
Also featuring prominently in Graph 2 are the pullbacks in forestry product prices. Softwood lumber is -21.7% y/y and -9.8% over the latest three months; plywood, -14.4% and -3.8%; and particle board and oriented strand-board, +3.2% y/y, but -2.0% since February.
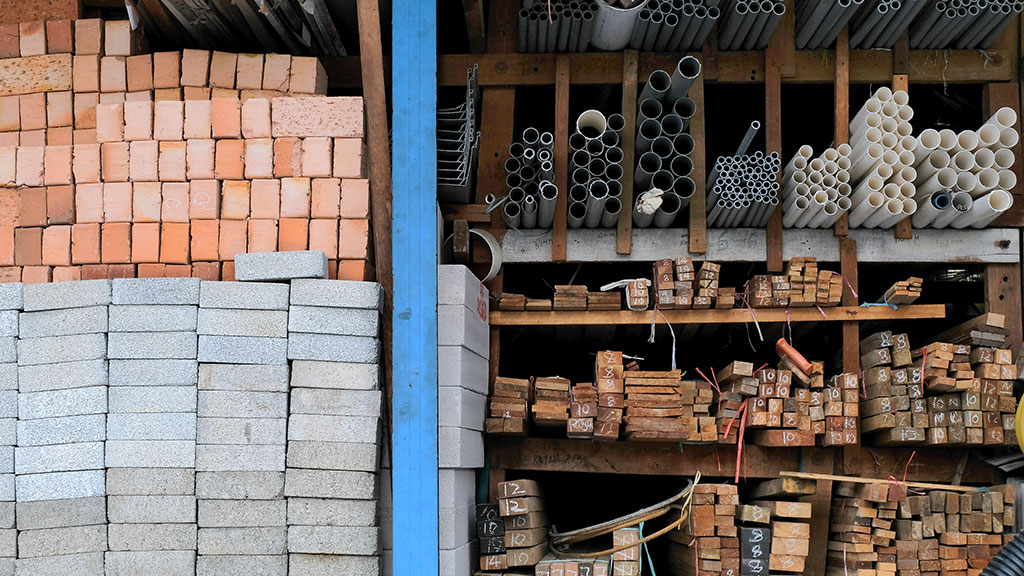
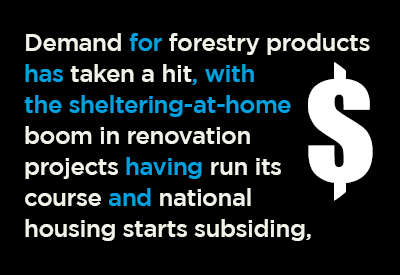
Demand for forestry products has taken a hit, with the sheltering-at-home boom in renovation projects having run its course and national housing starts subsiding to 266,000 units seasonally adjusted and annualized (SAAR) in May from 287,000 units in April.
Be aware, though, from Table 1 that hardwood lumber and millwork remain pricier year over year, +12.0% and +16.1%.
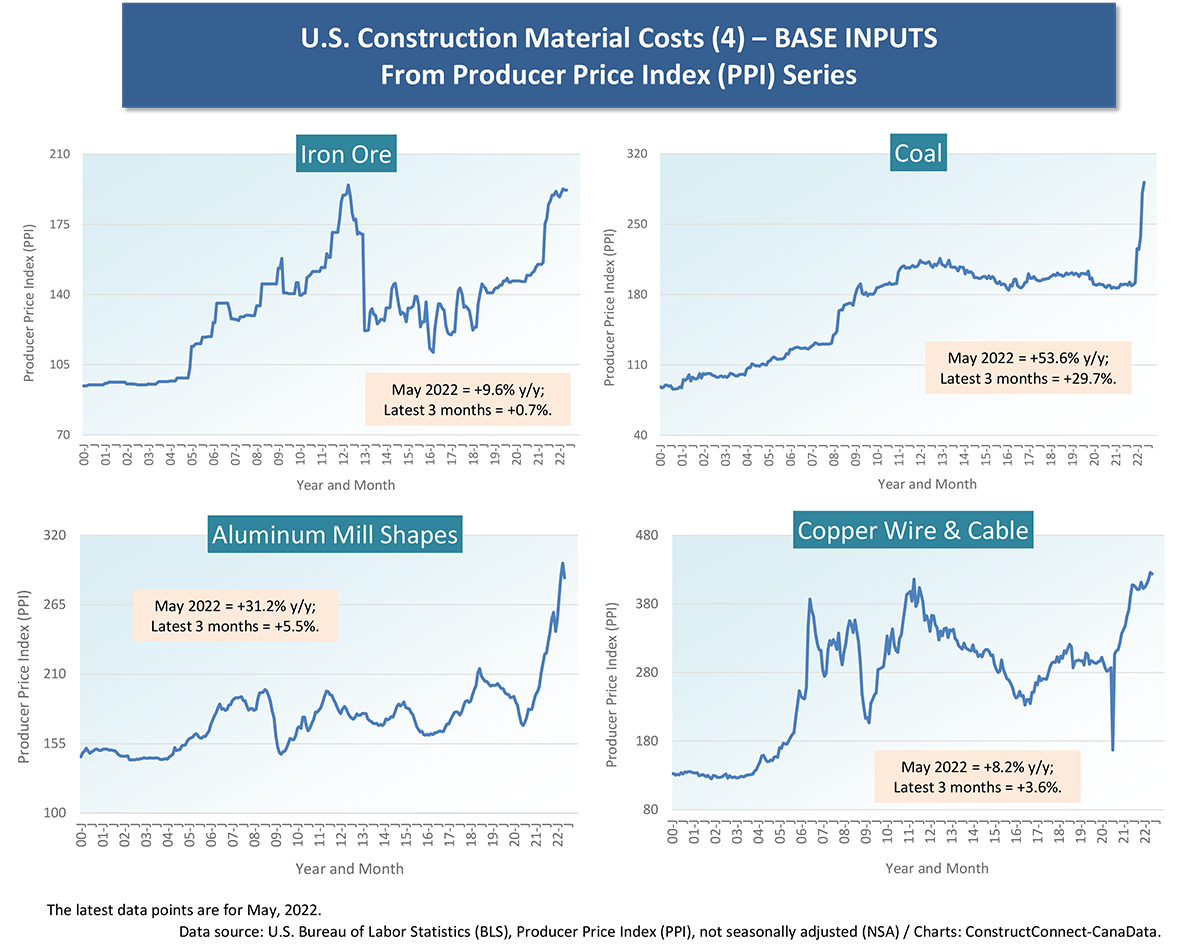
Table 1 does show some instances of softening prices month to month, in the final or far-right column. Iron and steel scrap is -11.8% m/m; aluminum mill shapes, -3.8%; and copper wire and cable, -0.5%. Be aware, though, that copper is a commodity expected to be in tight demand for years to come. Copper, thanks to its conductivity, will play a starring role in the greater electrification of the economy needed to attain decarbonization goals.
Also notable from Table 1 is the -0.1% m/m movement in the final demand price index for new warehouse building construction. The high intensity push to build giant-sized fulfilment and distribution centers of the last few years has quieted down. ConstructConnect’s dollar volume of warehouse construction starts year to date through May 2022 is off by a quarter, -24.9%.
Cluster charts 1 through 7 remain striking for the spikes in index values, in a historical context, evident in 23 of the 28 individual graphs. The only exceptions are iron and steel scrap, aluminum mill shapes, and forestry products where the curves have recently lost a little of their buoyancy.
Possibly, there’s encouragement to be taken from the following tables and charts that the worst of construction material input inflation may be receding. But one hesitates to speak too quickly, for fear of giving voice to wishful thinking.
Graph 1
Graph 2
Cluster Chart 1 – Forestry Products
Cluster Chart 2 – Steel Products
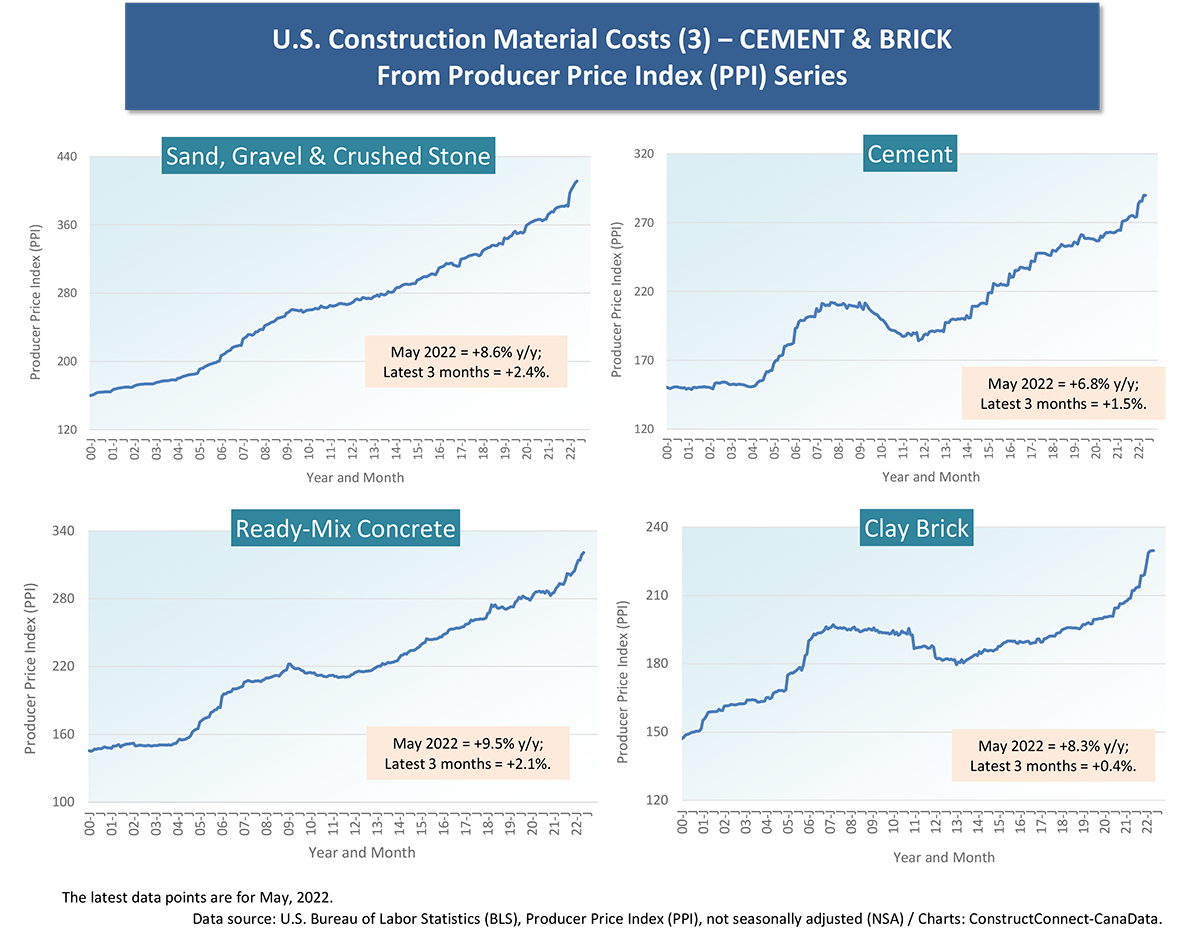
Cluster Chart 3 -Cement & Brick
Cluster Chart 4 – Base Inputs (Iron Ore, Coal, Aluminum, Copper)
Cluster Chart 5 – Energy-Related Products
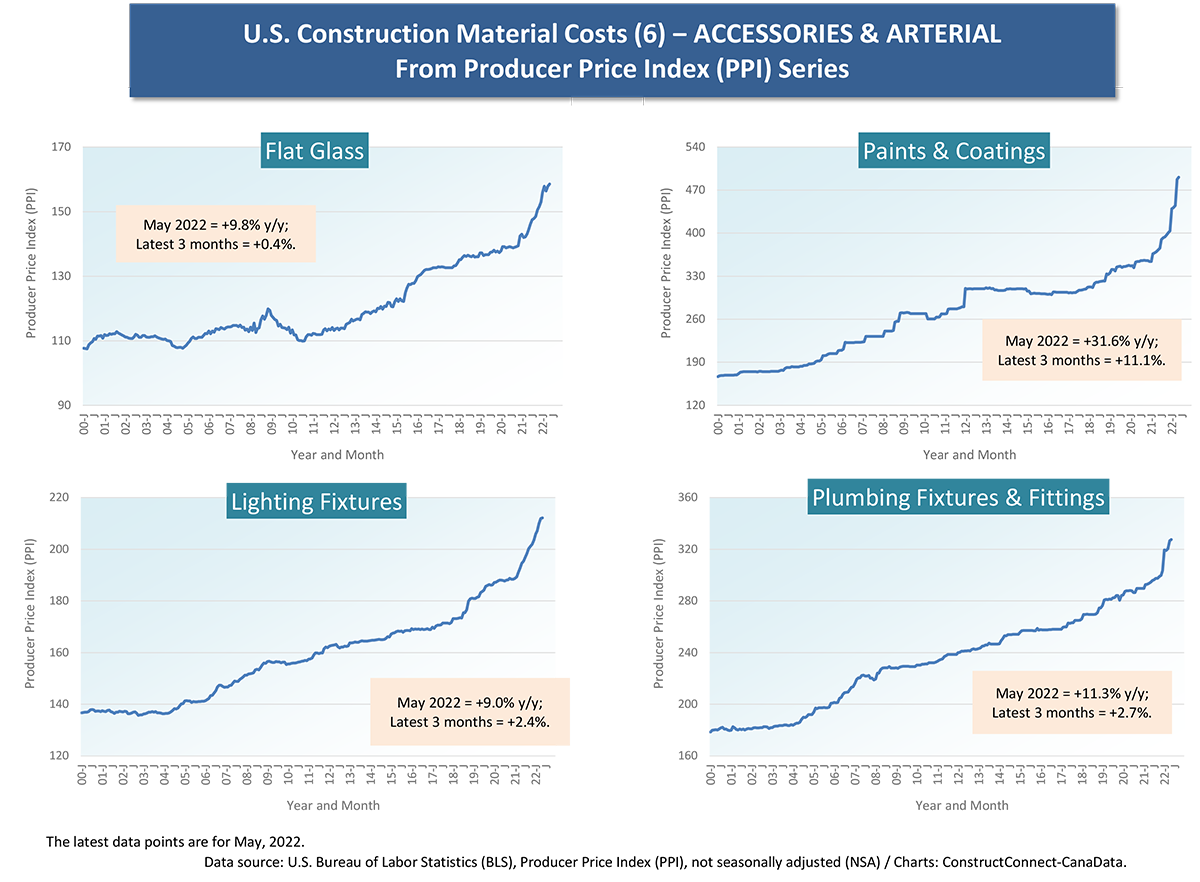
Cluster Chart 6 – Accessories & Arterial
Cluster Chart 7 – Equipment
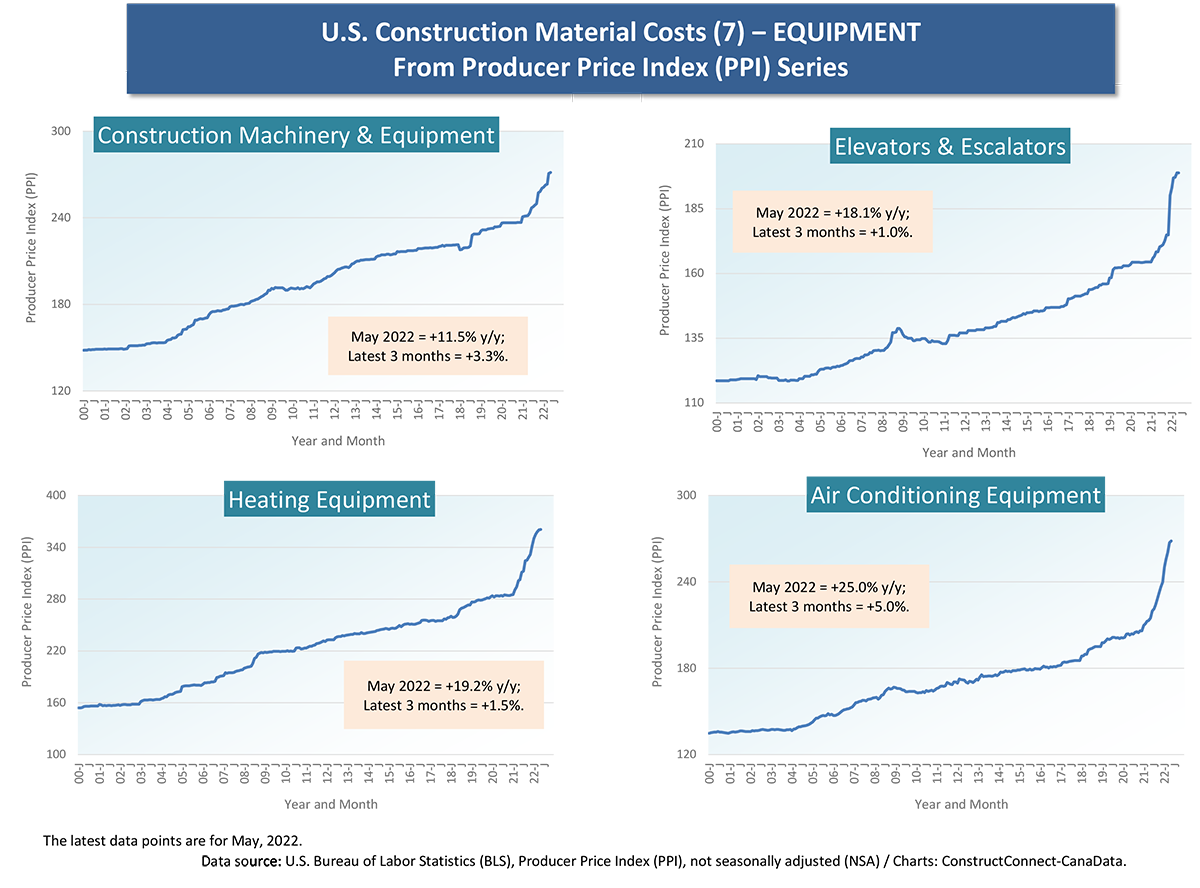
Table 1
Alex Carrick is Chief Economist for ConstructConnect. He has delivered presentations throughout North America on the U.S., Canadian and world construction outlooks. Mr. Carrick has been with the company since 1985. Links to his numerous articles are featured on Twitter @ConstructConnx, which has 50,000 followers.


Recent Comments
comments for this post are closed