The following is a companion piece to an earlier article on construction material cost changes in the U.S., which can be accessed by clicking on this link.
The story in a nutshell is that construction materials north of the border have been spiking in price to every bit the same degree as south of the border.
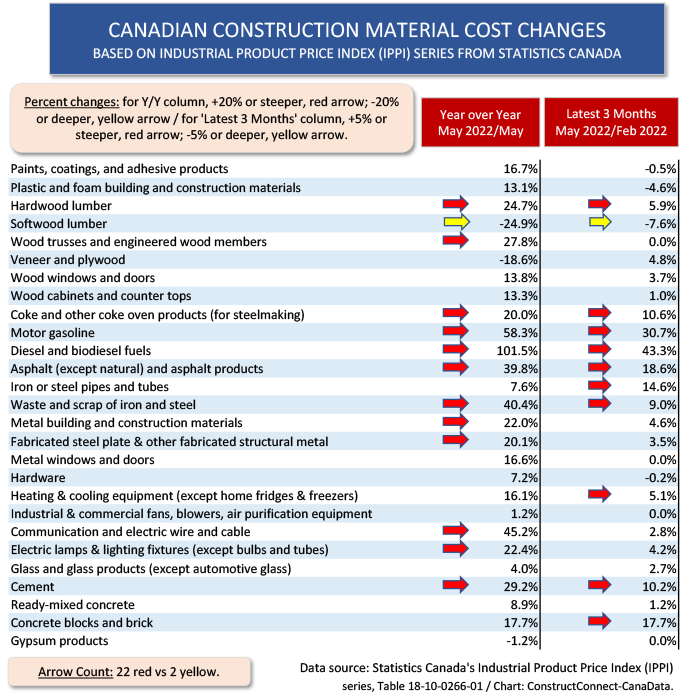
The exception in both countries has been softwood lumber, where there has been some variability and relaxation in price versus the ultra steep climb early last year. The Industrial Product Price Index (IPPI) for softwood lumber in Canada in May was -24.9% year over year and -7.6% compared with February, three months ago.
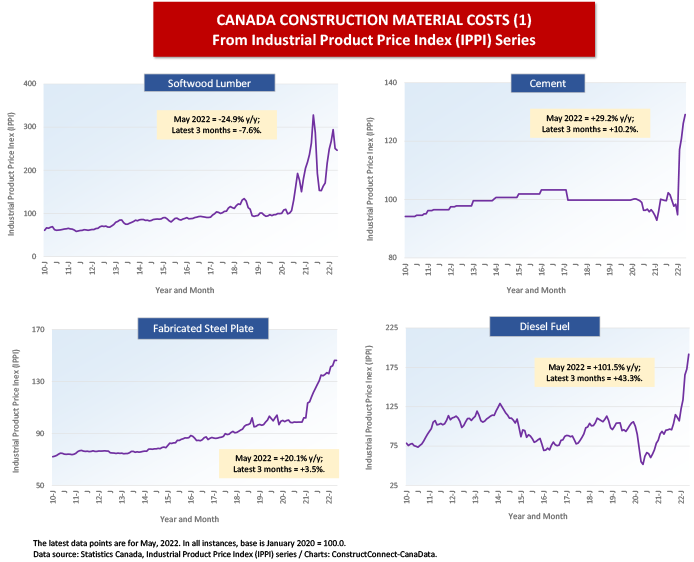
It doesn’t automatically follow that softwood lumber has now become a huge bargain. It’s still way pricier than historically, as is clearly shown in Cluster Chart 1 below.
The drop in the price of softwood lumber is easier to explain for the U.S. than for Canada. From May to April, U.S. housing starts receded from 1.810 million units seasonally adjusted and annualized (SAAR) to 1.549 million. Permits, as a leading indicator for ‘starts’, also fell off the pace, dipping month to month from 1.823 million units to 1.695 million units.
Housing starts in Canada, however, picked up steam in May, moving to 287,000 units SAAR from 266,000 units SAAR the month previously.
From Table 1, the price of ‘veneer and plywood’ is -18.6% y/y, but some other wood products continue to show strength. For example, hardwood lumber is +24.7% y/y and +5.9% over the latest three months.
In the U.S., the data to be consulted relating to the cost of construction materials is the Producer Price Index (PPI) series published by the Bureau of Labor Statistics (BLS). The PPI indices capture the price of goods as they leave a producer’s front gate. At least, that’s the official definition.
In Canada, the comparable information is to be found in the Industrial Product Price Index (IPPI) material compiled and published by Statistics Canada. IPPI data is said, by Statcan, to measure prices charged by manufacturers.
Table 1 sets out the year-over-year and latest-three-months percentage changes for 27 material inputs into construction activity. Red arrows denote increases of +20.0% or more for y/y results and +5.0% or more for latest-three month results. Yellow arrows point out decreases of -20.0% or deeper year over year and -5.0% or deeper for latest three months.
There’s nothing to be gained by ignoring the obvious. There are a lot of red arrows in Table 1. The count is 22 red arrows to just 2 yellow arrows.
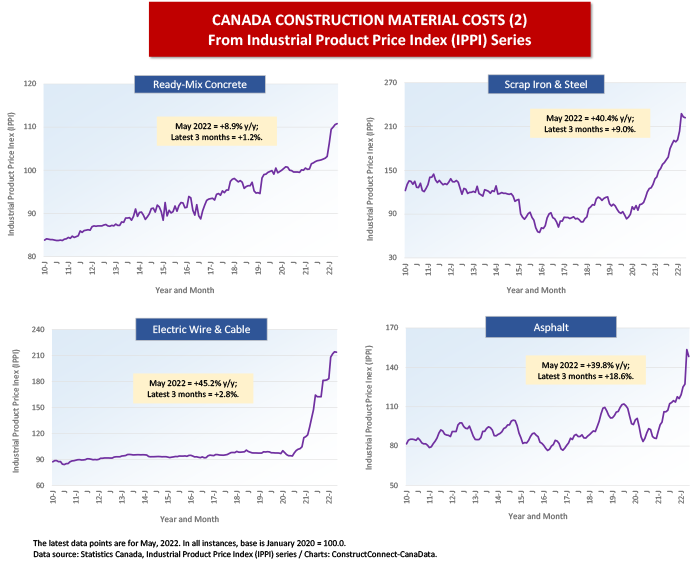
Cluster charts 1 and 2 further shine a spotlight on how construction material costs in Canada have generally been spiking. Most of the data series only go back to 2010. In almost all the graphs, the current index levels are higher than at any time since the 2008-2009 ‘financial crisis’ recession.
In fact, the curves in most of the graphs ascend with a steepness that would challenge a mountain goat.
The full IPPI data set has some other interesting year-over-year increases: ammonia, urea and other chemical fertilizers, +90.9%, helping to explain worries about no letup in food price hikes; paper (except newsprint), +18.9%, leading to headaches for the hardcopy publishers of novels, nonfiction works and textbooks; and jet fuel, +168.6%, coming just as the travel industry has been regaining its mojo, although a shortage of pilots has loomed large.
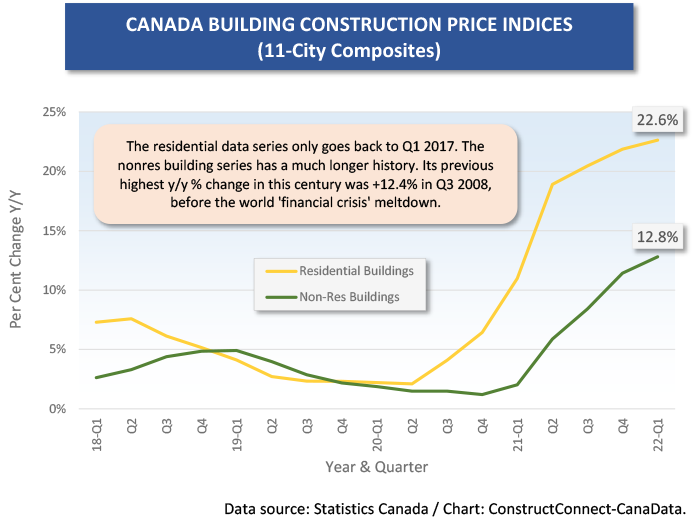
Finally, Graph 1 shows separately calculated Statistics Canada price indices for residential and nonresidential building construction. In each instance, they are composites based on the experience in 11 of the nation’s major cities. The latest (Q1 2022) residential y/y percentage change is nearly twice as fast as the nonresidential building figure, +22.6% to +12.8%.
One key factor in driving up costs is said to be the greatly heightened expense in transporting inputs to job sites.
Table 1
Cluster Chart 1
Cluster Chart 2
Graph 1
Alex Carrick is Chief Economist for ConstructConnect. He has delivered presentations throughout North America on the U.S., Canadian and world construction outlooks. Mr. Carrick has been with the company since 1985. Links to his numerous articles are featured on Twitter @ConstructConnx, which has 50,000 followers.







Recent Comments
comments for this post are closed