
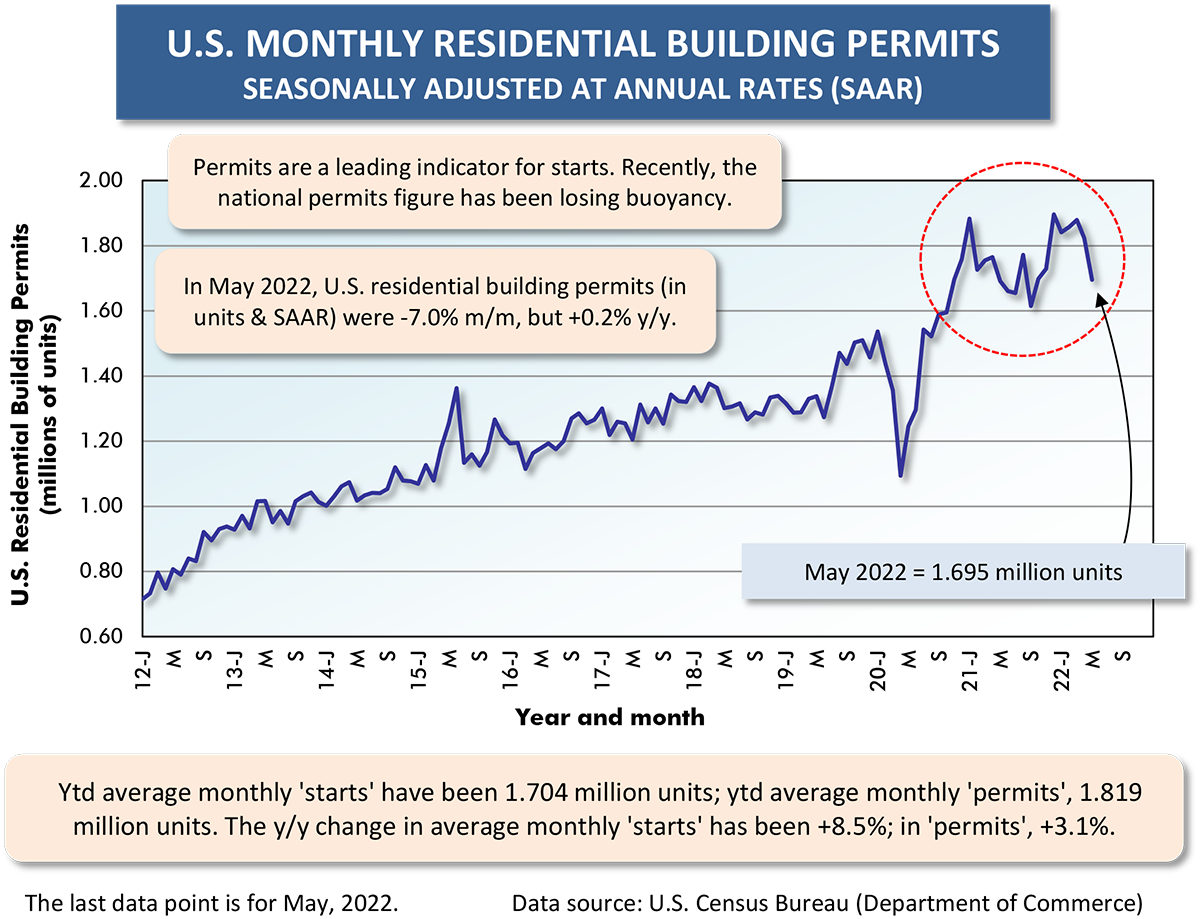
Triggered by mortgage rate increases, expectations concerning housing starts in the U.S. and Canada have been scaled back. Nevertheless, the starts statistics are holding up not too badly to this point in time.
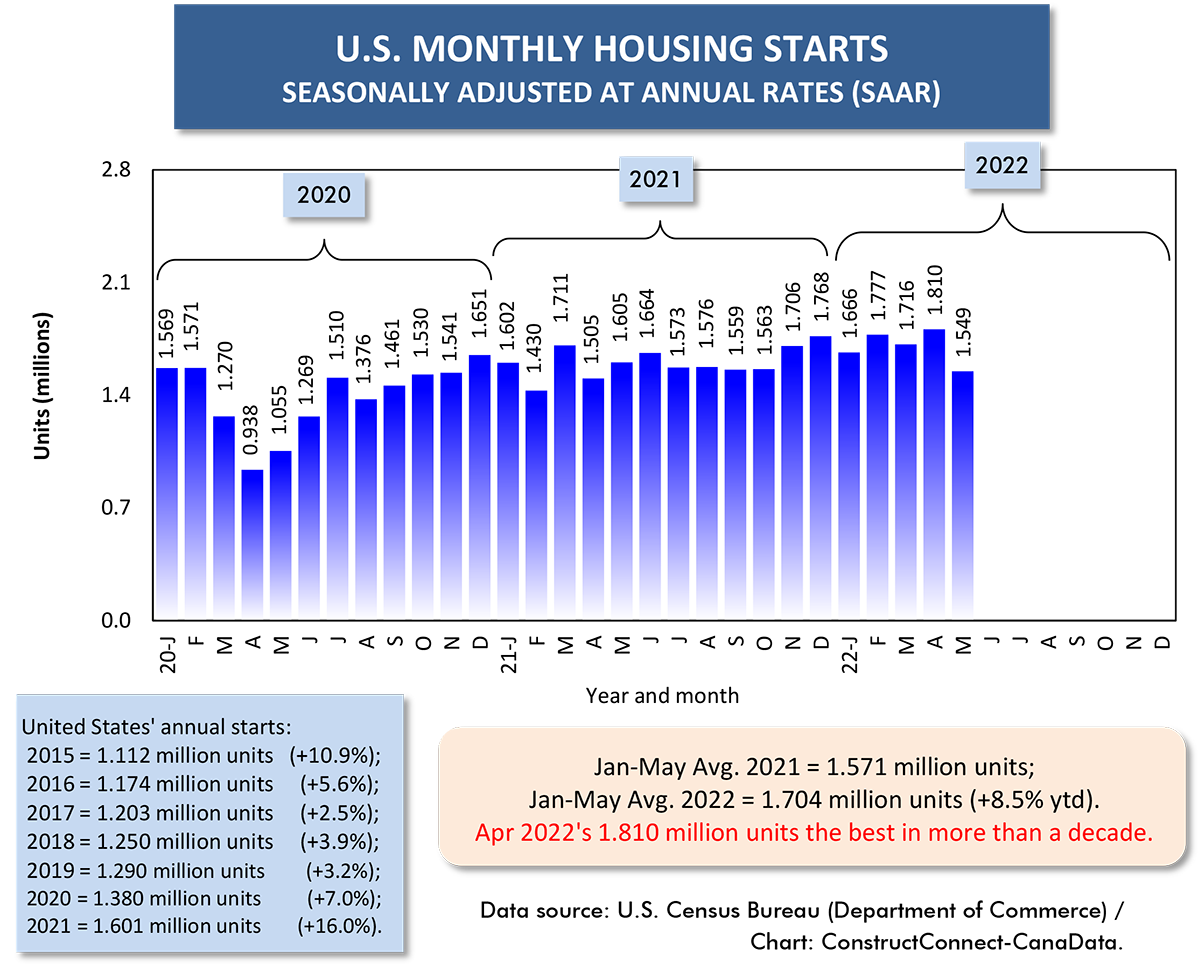
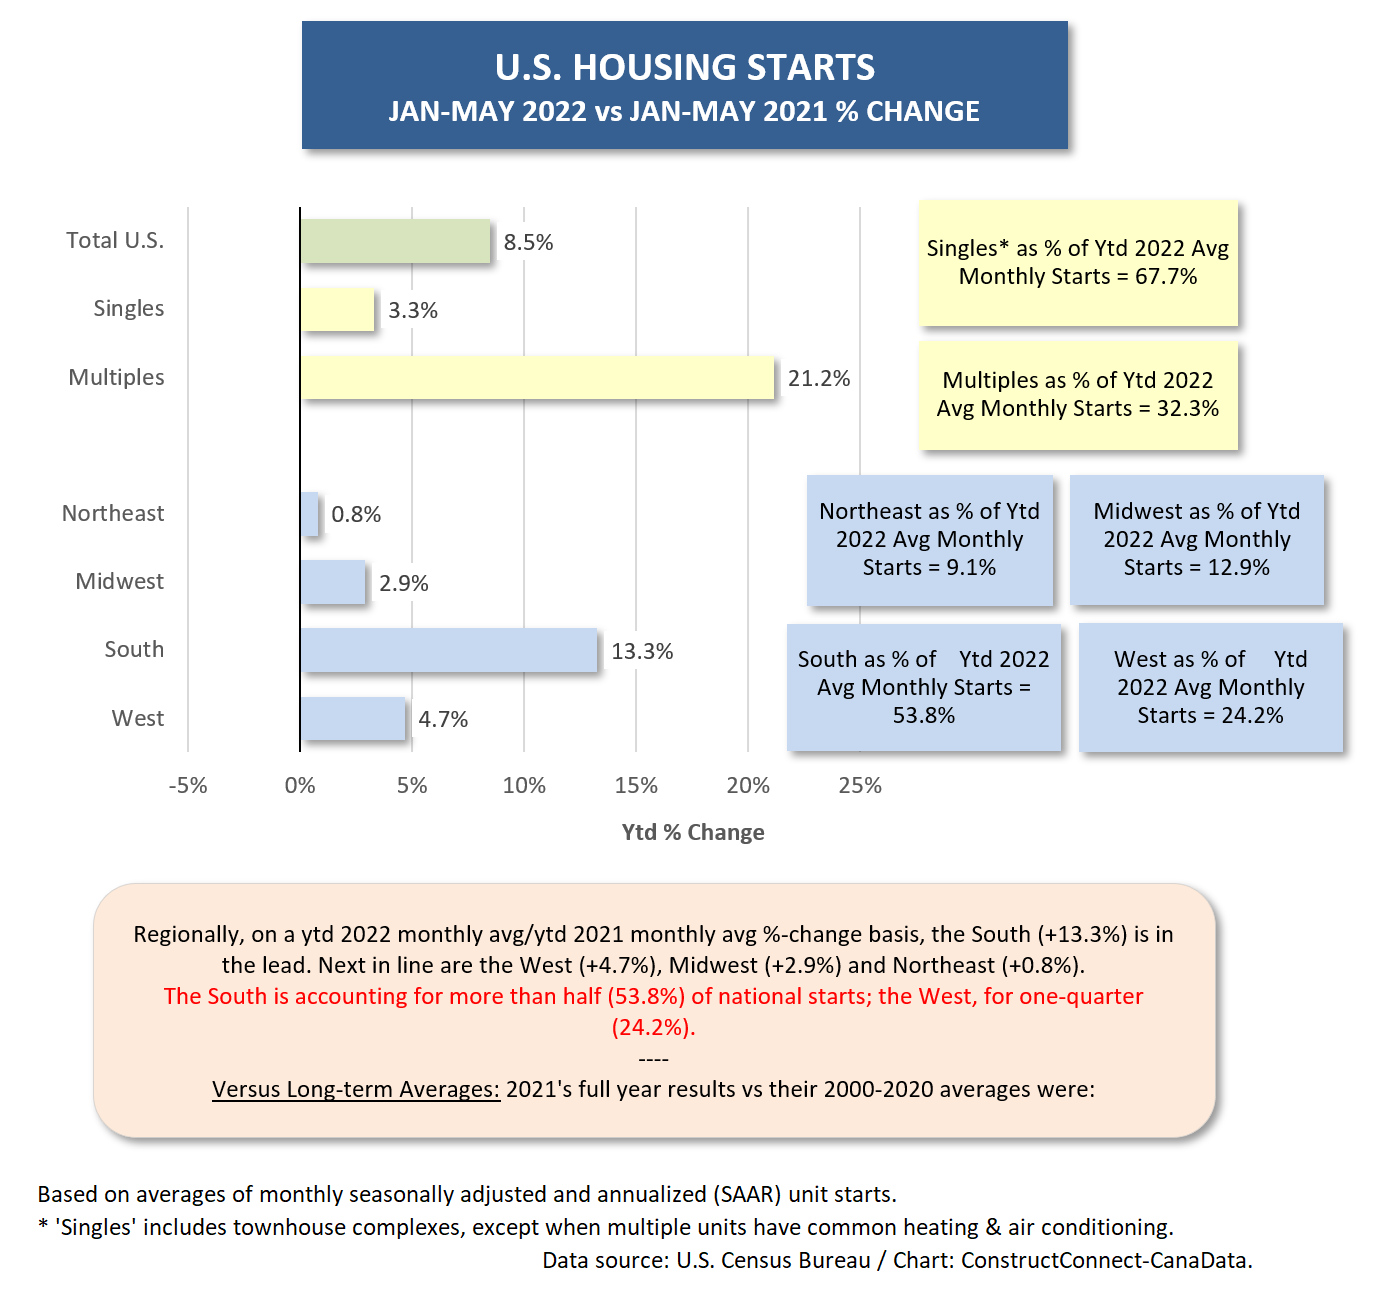
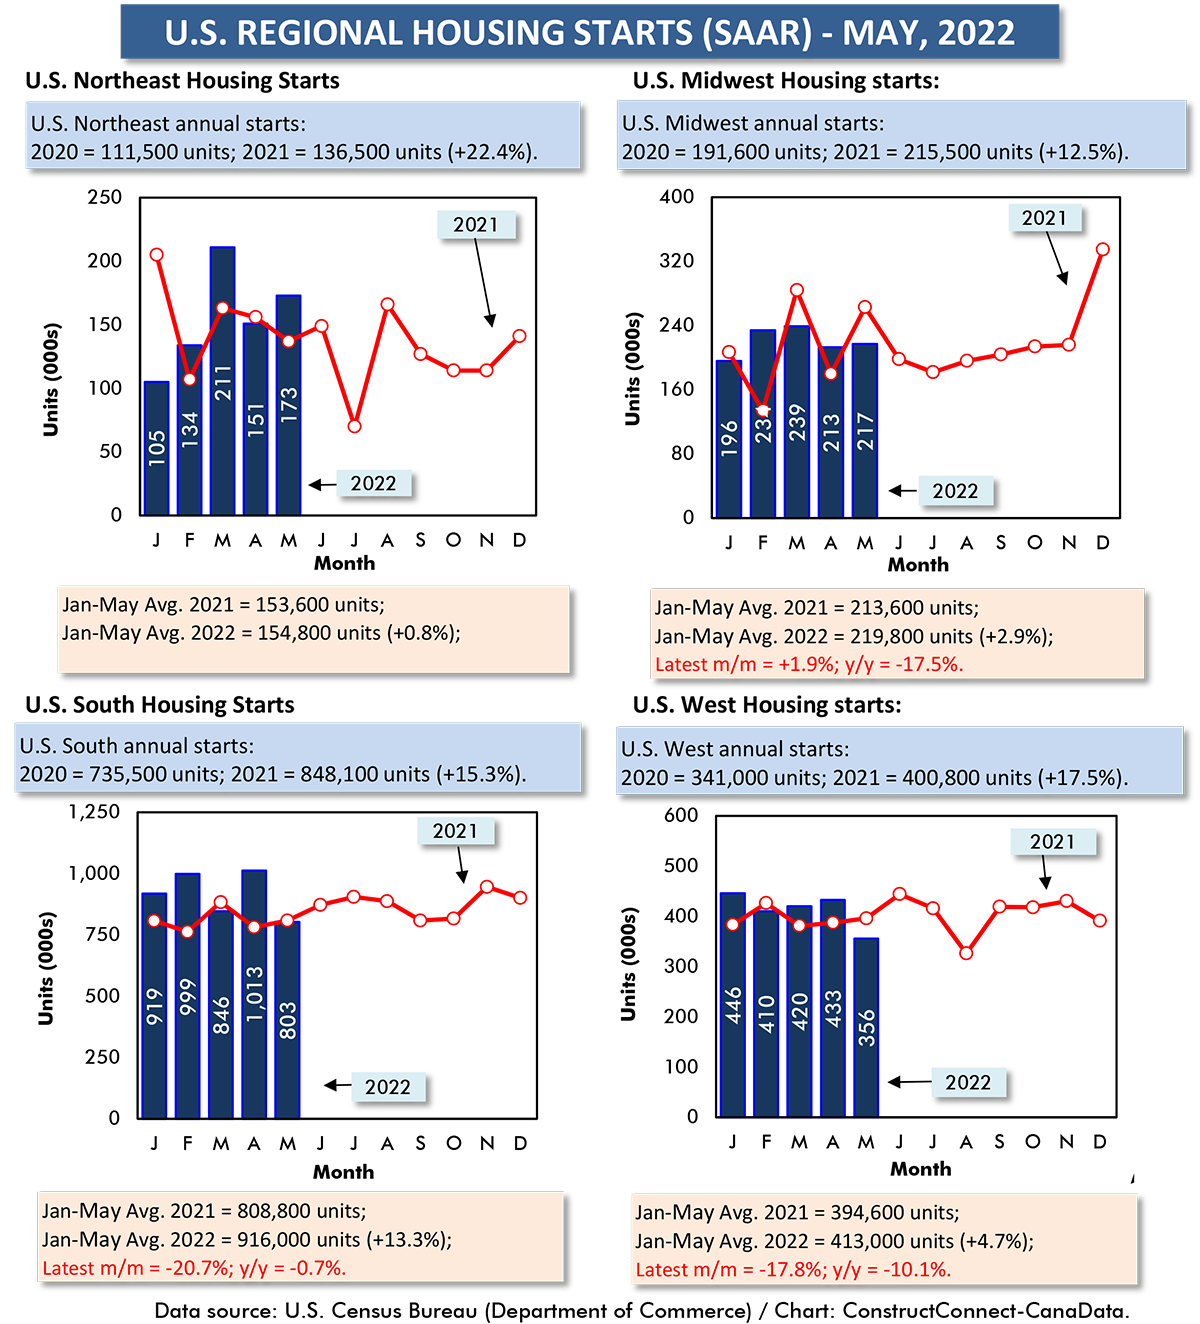
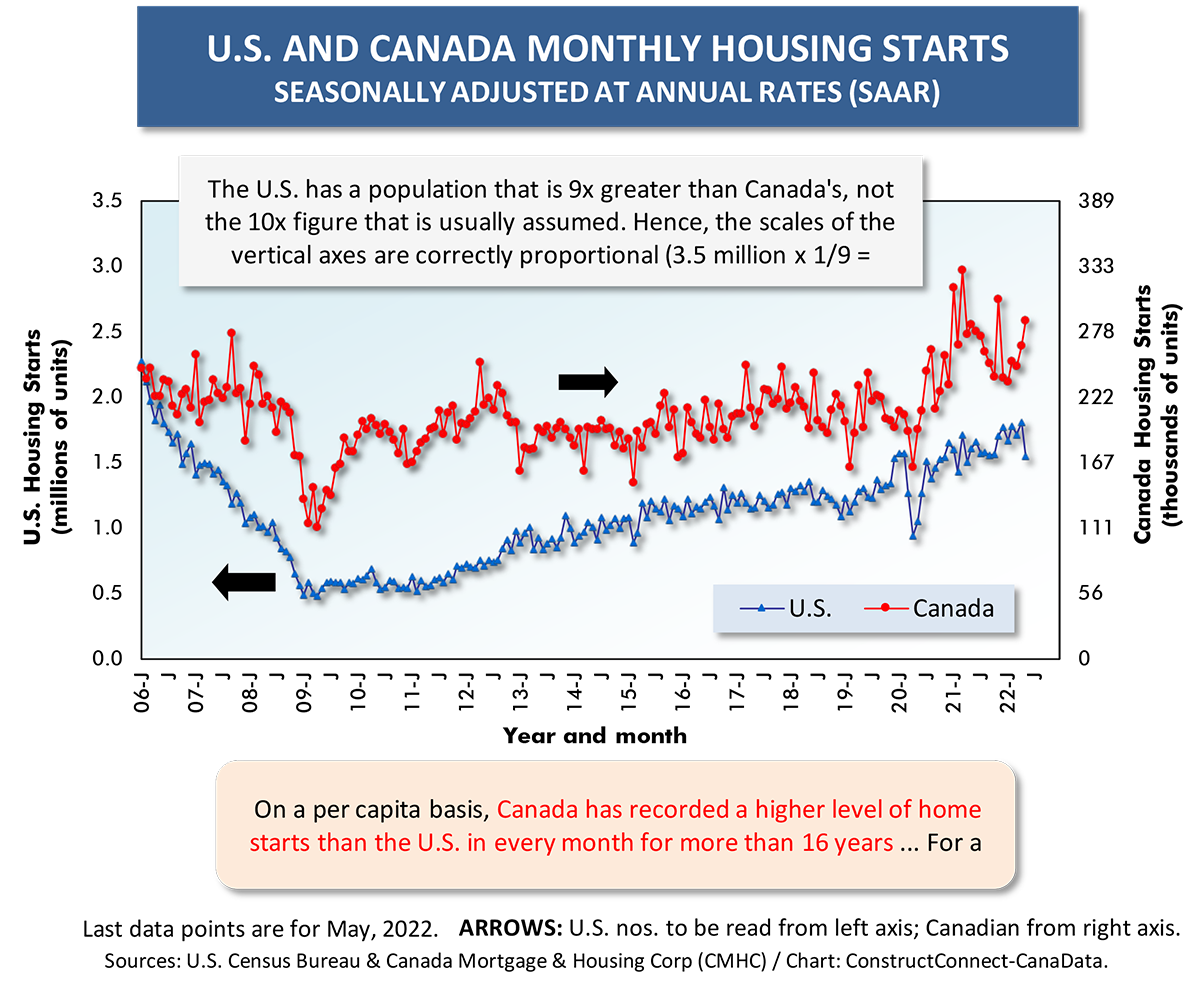
In the U.S., the monthly average of unit groundbreakings has increased by +8.5% year to date, although the latest monthly level was -14.4% compared with the previous month, falling from 1.810 million units in April to 1.549 million units in May. Upcoming June’s results will make clearer whether there is still support for a decent number of starts this year.
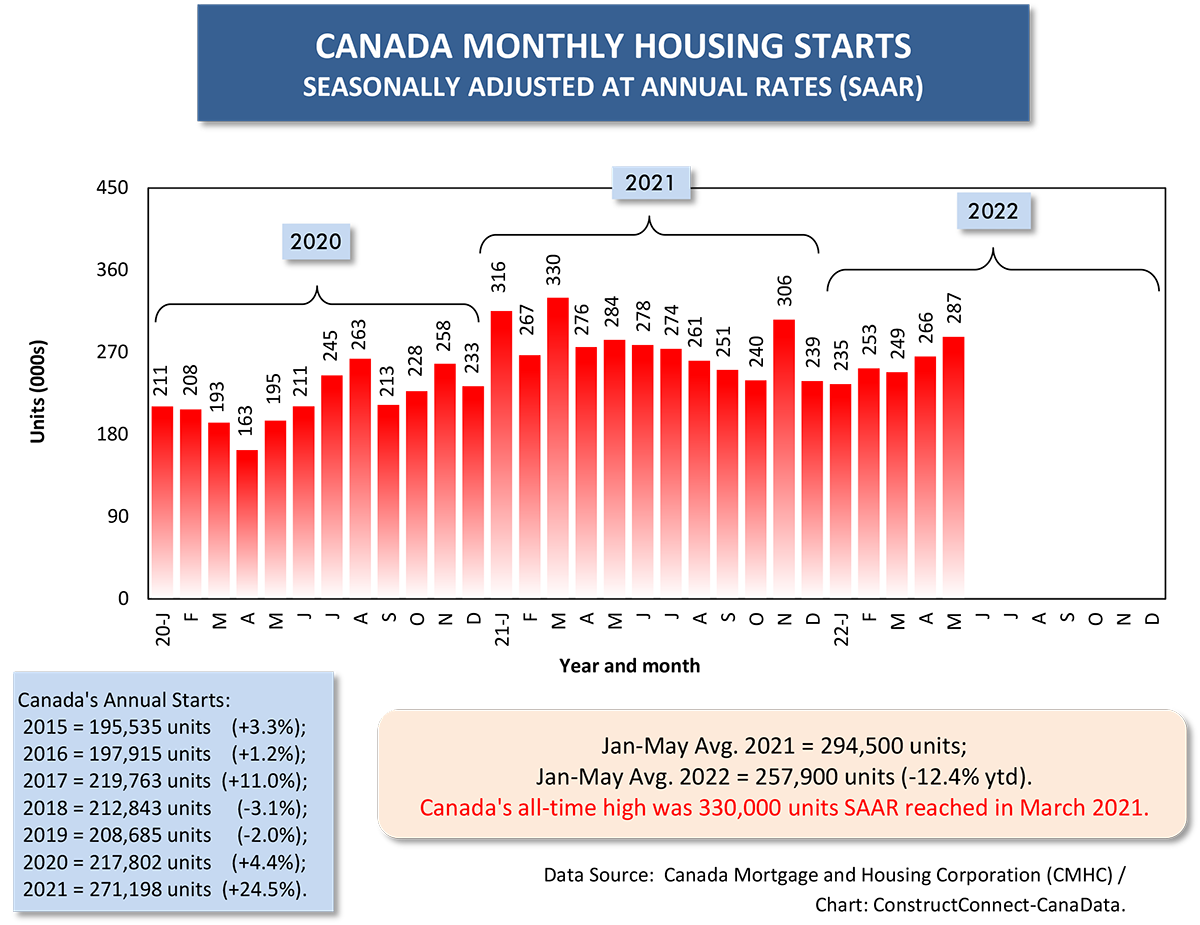
In Canada, the monthly average is -12.4% year to date compared with Jan-May 2021, but the individual month of May was quite strong, 287,000 units SAAR. The 287,000 number was the highest in any month so far in 2022 and the best since November of last, when 306,000 units were initiated.
In Canada, 2021 home starts climbed to a new annual peak of 271,000 units, and even under the most fortuitous of circumstances, it’s never seemed likely they would reach such a summit again in 2022.
Plus, potential purchasers are now contending with higher mortgage rates.
The math illustrating the disincentive aspect of rate hikes is straightforward.
A 100 basis-point (where 100 basis points = 1.00%) increase in the mortgage interest rate bumps up the annual payment on $100,000 in outstanding principal by $1,000.
A 300 basis-point increase in the mortgage interest rate bumps up the annual payment on $100,000 in outstanding principal by $3,000.
A 300 basis-point increase in the mortgage interest rate bumps up the annual payment on $500,000 in outstanding principal by $15,000.
The above isn’t quite accurate, since there are reductions in principal month-to-month, but it’s close enough. In the third example above, an extra $15,000 out of a family’s or individual’s annual after tax (i.e., ‘disposable’) income is a big chunk of money.
As for those who have bought a house over the last several years, committing to a variable rate mortgage, but thinking surely rates won’t deviate much from a level plain, they must be shaking their heads over the potential dilemma in which they may find themselves.
The graphs and tables below feature the usual roundup of information on housing starts in the U.S. and Canada, with highlights set out in the accompanying text boxes.
Implications from the Residential Construction Mix
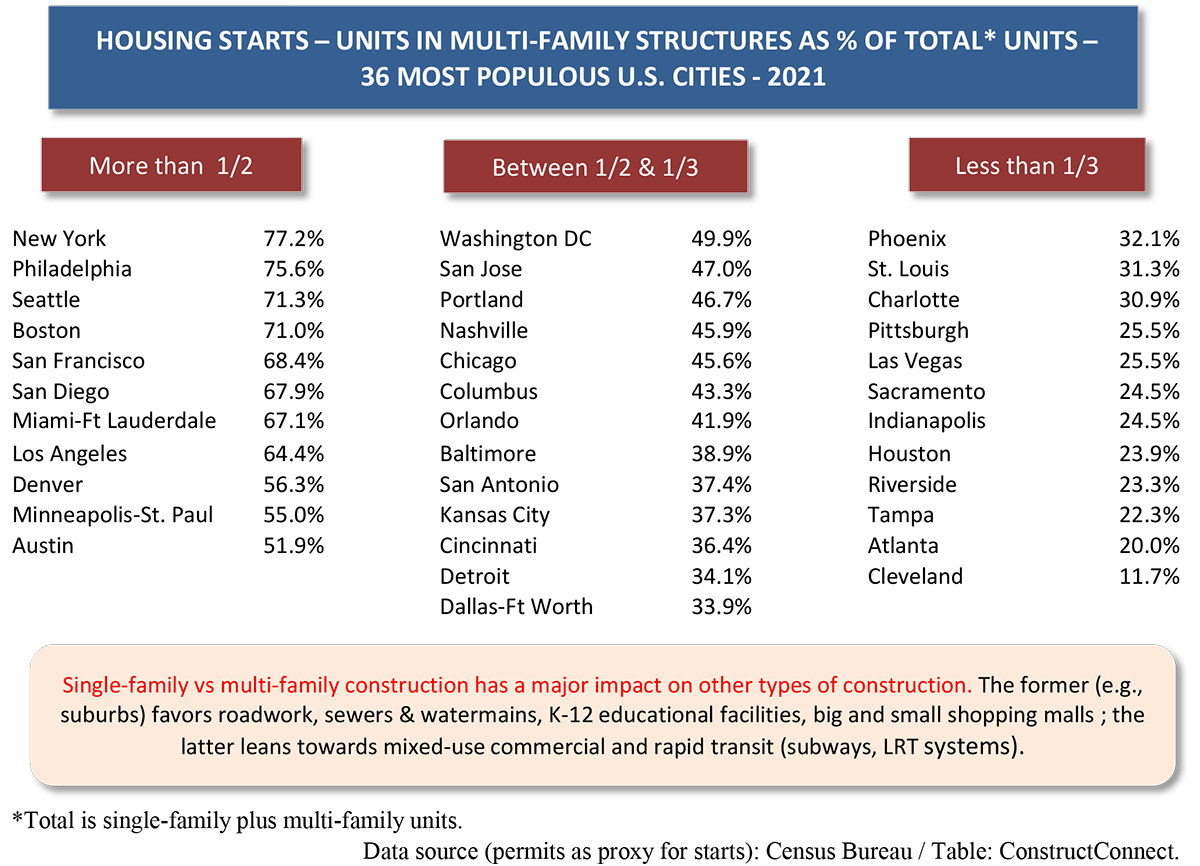
A new particularly interesting graphic, Table 1, shows the percentage of residential groundbreakings in major U.S. cities that are in multiple-family structures (e.g., apartment or condominium towers) as opposed to single-family dwellings.
While multi-unit residential has become dominant in Canadian urban centers, it’s higher than 50% in only about a third of U.S. metros.
One reason singles account for a larger slice of ‘total’ in the U.S. is that their number includes townhouses, except when a cluster of units share a single HVAC system. North of the border, townhouses are designated by Canada Mortgage and Housing Corp (CMHC) as multi-unit structures. But the townhouse recording anomaly is only part of the story.
The U.S. has a history of building relatively more singles due to several other factors. For example, in America, mortgage interest deductibility has encouraged buying bigger (e.g., a property with a yard as opposed to a condo). Canadians have never had that personal tax break.
As a trend prior to the pandemic, and sure to re-emerge going forward, urban planners have seized on mixed-use projects, with an abundance of meeting places (theaters, bars, restaurants, etc.) as a means to achieve a livelier and safer ambience downtown, especially in the evening hours.
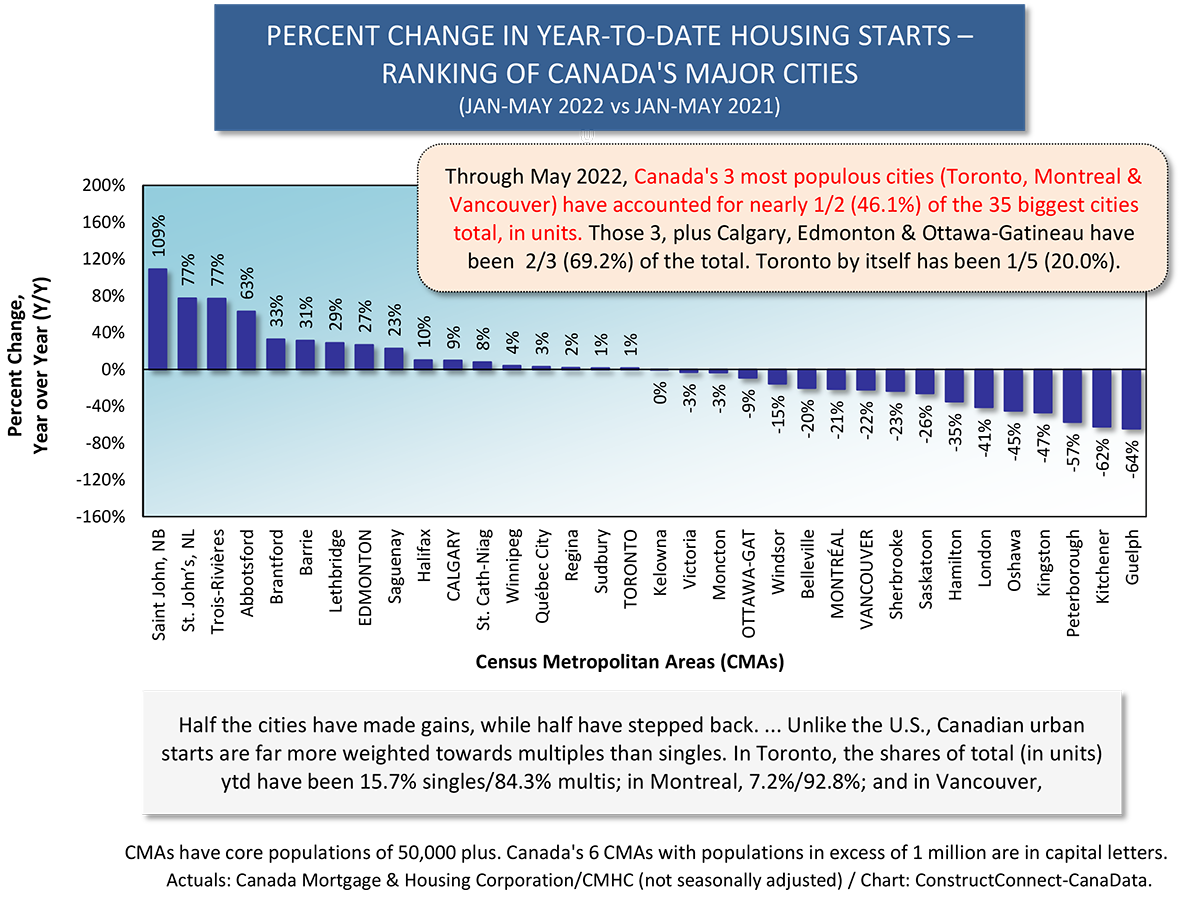
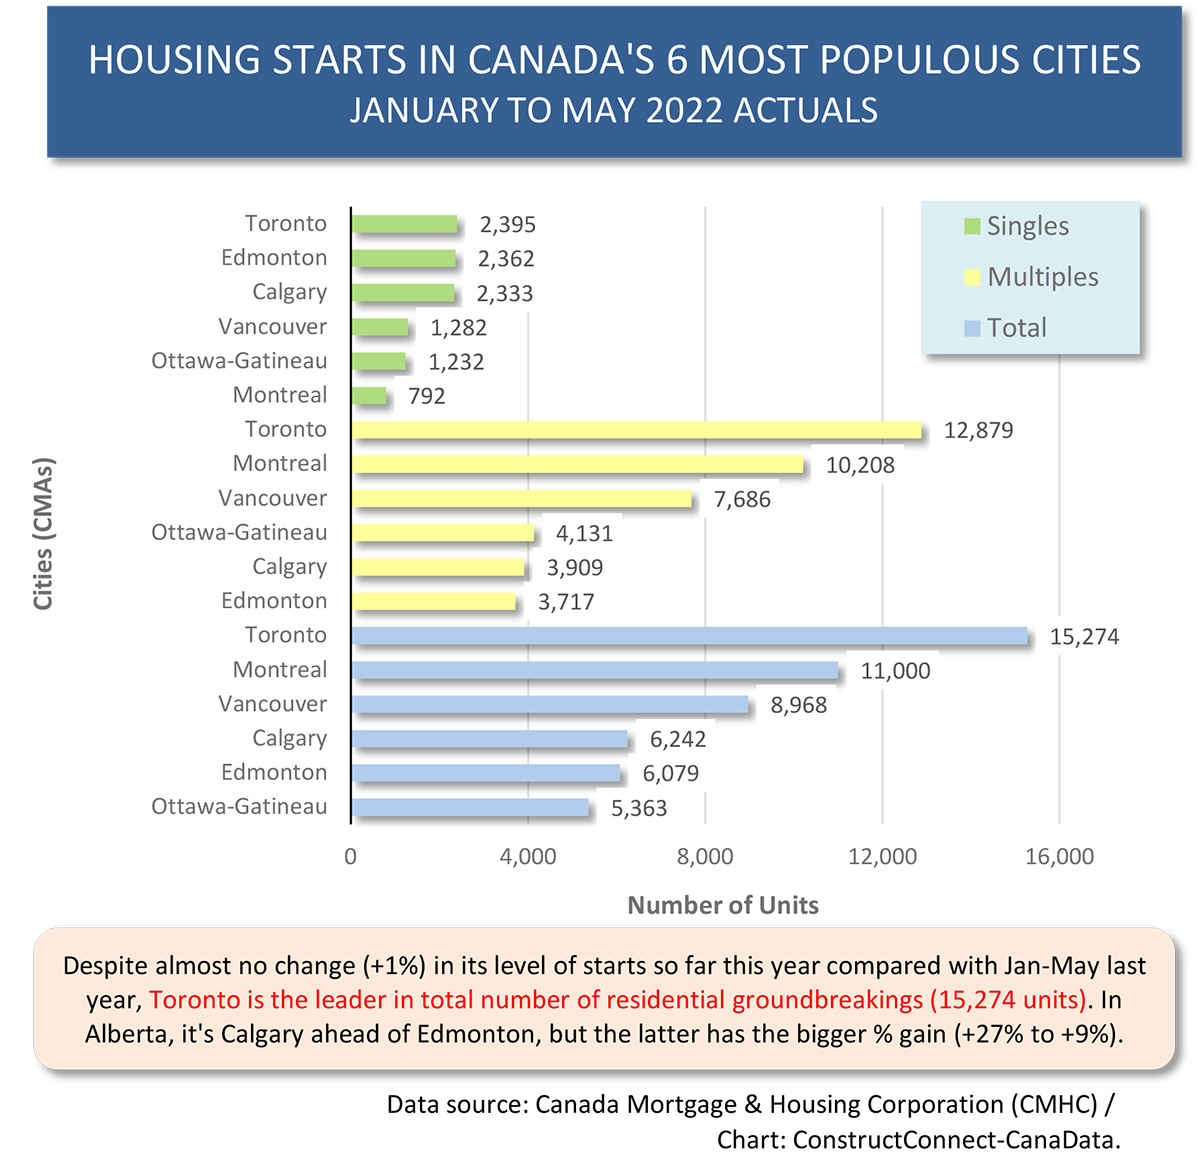
Canadian cities have certainly embraced this concept. Multiples as a share of total are about 90% in Montreal and between 85% and 90% in Toronto and Vancouver.
In the U.S., the five top cities for multiples as a share-of-total in full year 2021 were New York (77.2%), Philadelphia (75.6%), Seattle (71.3%), Boston (71.0%) and San Francisco (68.4%) (see Table 1).
The other six U.S. cities where multiples accounted for more than half of total new unit groundbreakings last year were San Diego, Miami, Los Angeles, Denver, Minneapolis-St. Paul, and Austin.
The singles-versus-multiples question has significance for other types of construction that will receive a boost. If the preponderance of work is single-family oriented on a city’s perimeter, it will promote roadwork, sewer and watermain activity, K-12 educational facilities, strip malls and necessary infrastructure (e.g., fire halls).
For multi-residential towers, there will be near-by or shared retail space and hotel room openings and calls for subway or LRT rapid transit expansions and extensions to serve new intersection hot spots.
Graph 1
Graph 2
Graph 3
Table 1
Graph 4
Graph 5
Graph 6
Graph 7
Graph 8
Graph 9
Graph 10
Graph 11
Graph 12
Graph 13
Alex Carrick is Chief Economist for ConstructConnect. He has delivered presentations throughout North America on the U.S., Canadian and world construction outlooks. Mr. Carrick has been with the company since 1985. Links to his numerous articles are featured on Twitter @ConstructConnx, which has 50,000 followers.


Recent Comments
comments for this post are closed