
Let’s jump right into a discussion of some of the more interesting numbers to have appeared in recent public and private sector data releases. Exorbitant prices charged for nearly everything is seemingly top of mind for everyone, so that’s where we’ll begin. Is there relief in sight?
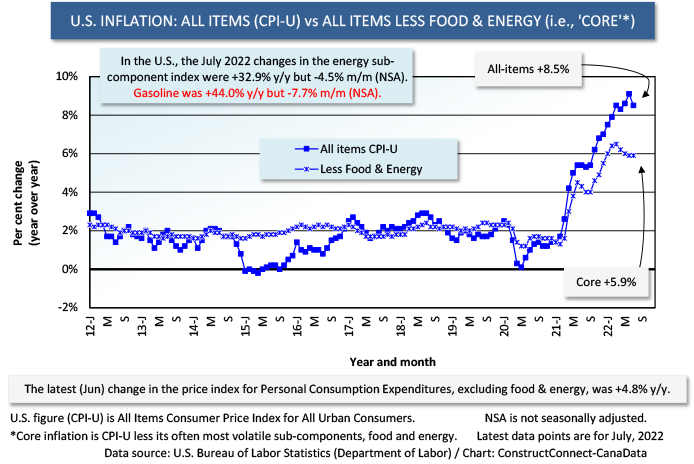
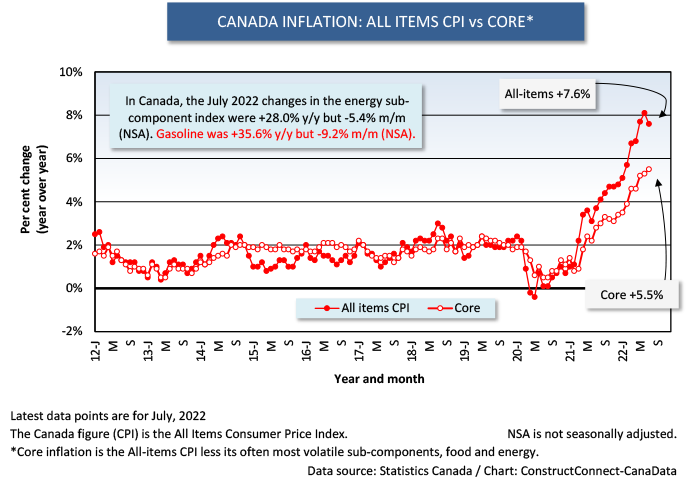
 (1) Inflation in both the U.S. and Canada moderated a little in July. The U.S. Consumer Price Index (CPI-U, where U stands for Urban consumers) eased back to +8.5% year over year from +9.1% in June. On a month-to-month basis, CPI-U stayed the same. In Canada, the CPI slowed to +7.6% y/y in July from +8.1% in June. Canada’s month-to-month change was +0.1%.
(2) Since the Spring, a huge headache for both countries, induced by global energy supply interruptions tied to Russia’s invasion of Ukraine, has the been the high cost of gasoline. That tight situation is relaxing somewhat as well. July’s price of gasoline in America’s CPI-U may have been +44.0% year over year but it was -7.7% month to month. Similarly in Canada, a +35.6% climb in petrol’s price y/y loses some of its sting with the knowledge that the month-to month-change was -9.2%.
(3) But if the price of gasoline is becoming somewhat less vexing, the same can’t be said for the cost of food. ‘Food’ as a sub-item in the CPI-U data set in July was +10.9%. The cost of ‘food at home’ was even more outrageous at +13.1% y/y. The sticker price shock on grocery store shelves presently encompasses, but is certainly not limited to, eggs (+38.0% y/y), flour (+22.7%), butter (+22.2%) and coffee (+20.3%). Flour has been another casualty of the conflict in Ukraine, with exports of wheat from that nation drastically disrupted. The ‘food’ sub-category in Canada’s CPI in July was +9.2% y/y.
(4) A year or so into the pandemic, it was the cost of renting a vehicle or purchasing a used car or truck that saw the big leaps in price. The availability of new means of transportation was limited due to a computer chip shortage. This kink in the supply chain has yet to be fully resolved and the price of new vehicles in the U.S., with inventory still constrained, is now +10.0% y/y.
(5) We’ve discussed costs related to transportation and food. What about accommodation? For those not wishing to make the leap into home ownership in the U.S., in a less forgiving mortgage rate environment, know that the cost of rent is now +6.3% y/y, according to the CPI-U data set. In Canada’s CPI, rent is recorded as +4.9% y/y.
(6) The CPI is meant to capture prices paid by consumers. Equally as important, but subject to less fanfare, are the Producer Price Index (PPI) numbers relating to what businesses pay. The PPI ‘final demand’ number has just come off its peak y/y change. The overall PPI in July was +9.8% y/y, but it was -0.5% m/m. PPI final demand for goods in July was -1.8% m/m, although for services, it was +0.1% m/m. In Canada, the equivalent series are the Industrial Product Price Index (IPPI) which, in July, was +11.9% y/y, but -2.1% m/m, and the Raw Materials Price Index (RMPI), which in the latest month was +19.1% y/y, but -7.4% m/m.
Graph 1
Graph 2
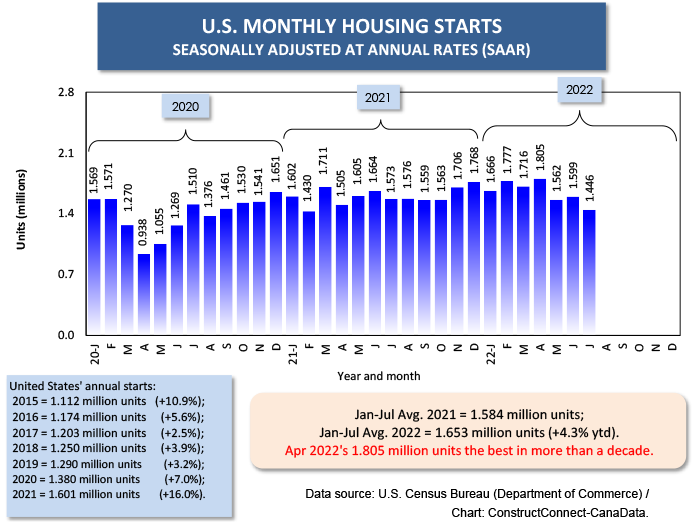
(7) A pullback in U.S. housing starts does appear to be underway. Monthly groundbreakings in the latest three months have retreated significantly from the 1.805 million units, seasonally adjusted and annualized (SAAR), that they reached in March of this year. March 2022’s level was the highest in a decade. On a year-to-date SA monthly average basis, single-family starts are -1.3% versus last year. Multi-family starts, however, are doing much better, +19.0%. Regionally, year to date, it’s the Northeast leading on a monthly average percent change basis, +9.6%. The South is doing second-best, +7.0%, with the Midwest also on the positive side (barely) of the ledger, +1.3%. The West is in a holding pattern, -1.5%.
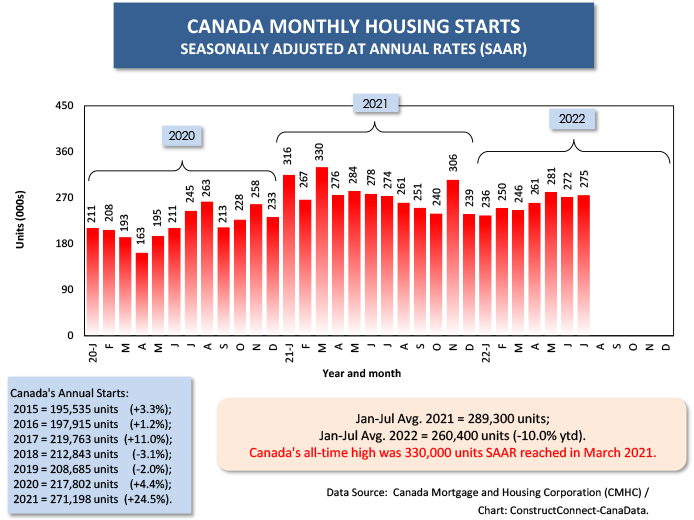
(8) For all the lamenting over interest rate hikes and what they may do to Canada’s new homes market, there hasn’t been much impact on the national figure so far. Housing starts country-wide over the last four months haven’t wandered far from about 270,000 units (SAAR). (The 2000 to 2020 average was 200,000 units.) There was, however, a noteworthy development at the city level in CMHC’s July published results. By far, Canada’s three largest urban homebuilding markets are Toronto, Montreal, and Vancouver. Also, they lean far more towards multi-unit residential construction than single-family homes. In those three cities, in July, multi-unit starts declined by a quarter (Toronto) to a third (Montreal and Vancouver) month to month.
Graph 3
Graph 4
(9) Included in the White House’s Inflation Reduction Act are measures to speed up America’s carbon reduction efforts. Combined with incentives to promote cleaner power generation and funds for a greatly expanded EV charging station network under the Infrastructure Investment and Jobs Act (IIJA), the U.S. is finally stepping on board with the rest of the world in combatting climate change.
(10) Given the vast expenditures that the automakers are now making on EV production lines and new battery plants, it seems that an energy-related tipping point has been reached. Generally speaking, the last two decades have been all about high-tech development and deployment throughout the economy. While that trend will surely continue unabated, it’s nevertheless likely that the major theme for the next decade will shift in a different direction. It will be a practical, and not just theoretical, concentration on moving significantly away from fossil fuel dependency. This has major implications for commodity markets (oil, gas, copper, aluminum, lithium, etc.) and where new capital spending (i.e., construction) should best be directed.
Alex Carrick is Chief Economist for ConstructConnect. He has delivered presentations throughout North America on the U.S., Canadian and world construction outlooks. Mr. Carrick has been with the company since 1985. Links to his numerous articles are featured on Twitter @ConstructConnx, which has 50,000 followers.


Recent Comments
comments for this post are closed