Changes are happening quickly with respect to costs and prices in the economy.
This article, in tables and graphs, sets out the latest Producer Price Index (PPI) results published by the Bureau of Labor Statistics (BLS).
The figures appearing below are for June and readers should know that for some materials, especially in the energy sphere, there have been significant downward shifts over the past month and a bit. For example, the per gallon price of gasoline has recently come off its high of $5.00 and is now down around $4.00.
Peak summer fill-up prices have eased. This is showing up in what’s termed the ‘headline’ inflation rate. CPI-U in July took a step back to +8.5% year over year from +9.1% in June.
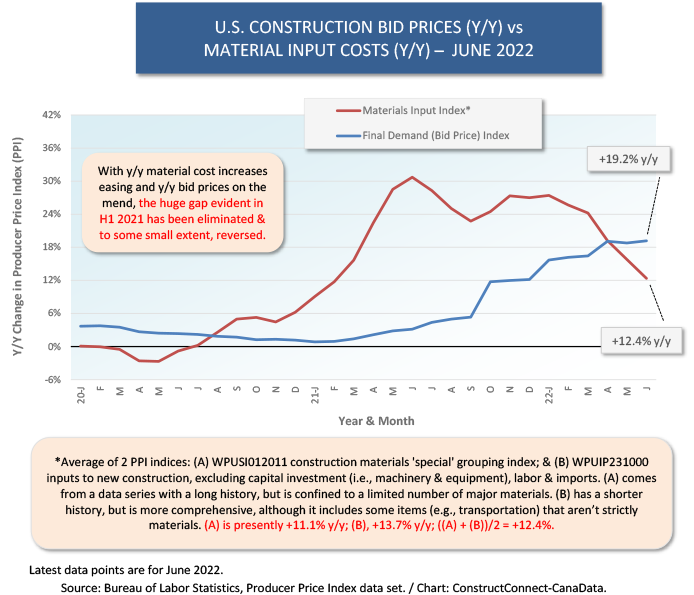
Graph 1 below shows that year-over-year construction bid prices have caught up with and surpassed y/y material input cost hikes. That’s certainly good news for general contractors, who saw profitability disappear through much of 2021.
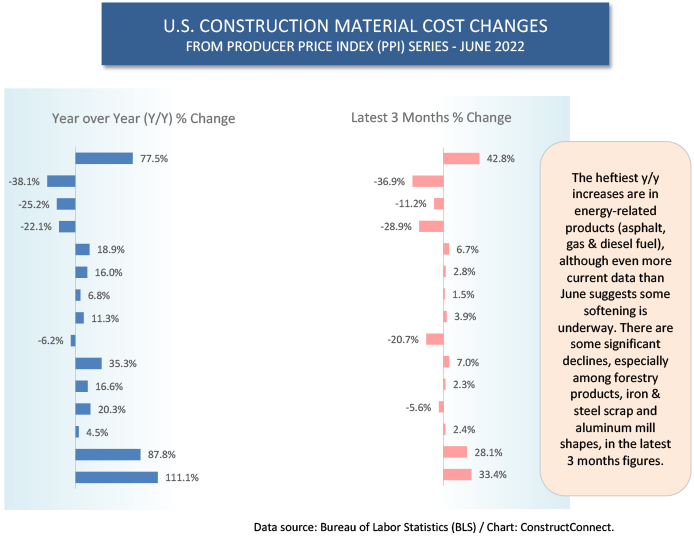
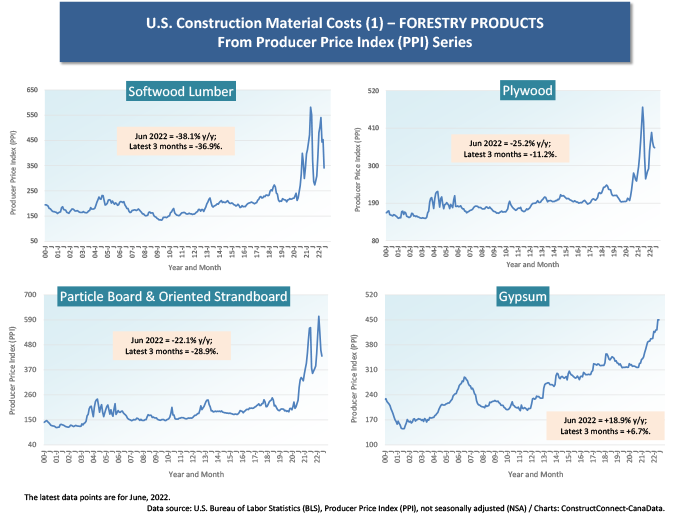
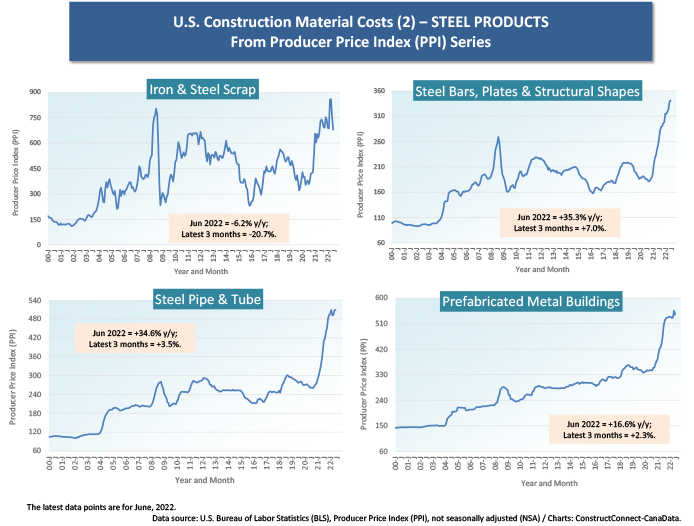
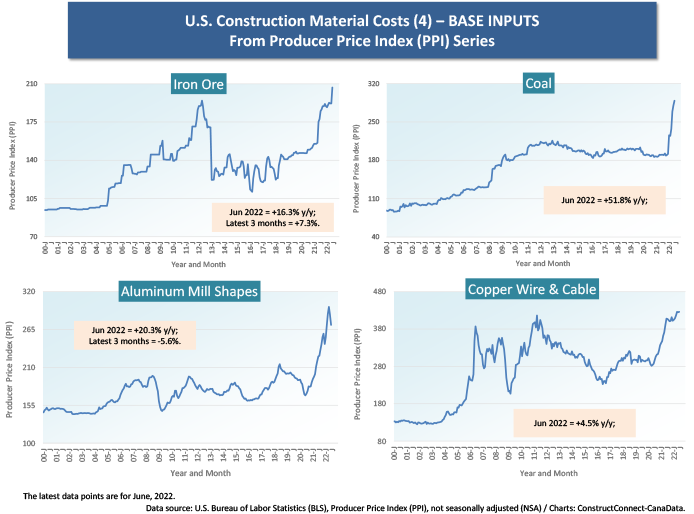
The most apparent retreats in prices have been occurring among forestry products, but Graph 2 also highlights iron and steel scrap (-20.7%) and aluminum mill shape (-5.6%) pullbacks over the period from March to June.
Interestingly, because copper is a commodity expected to come under intense demand pressure later this decade due to greater electrification of the economy, copper wire and cable prices have settled down for the moment.
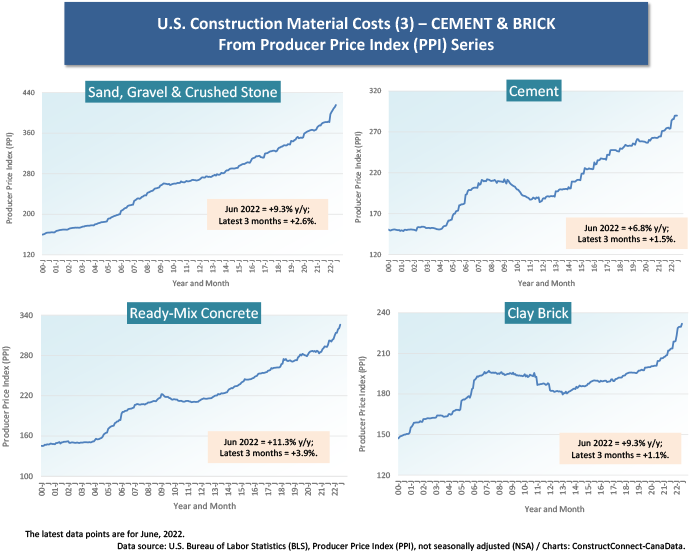
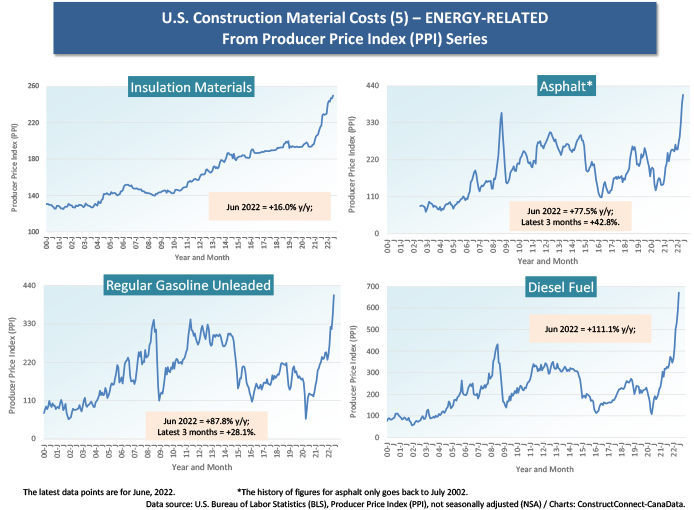
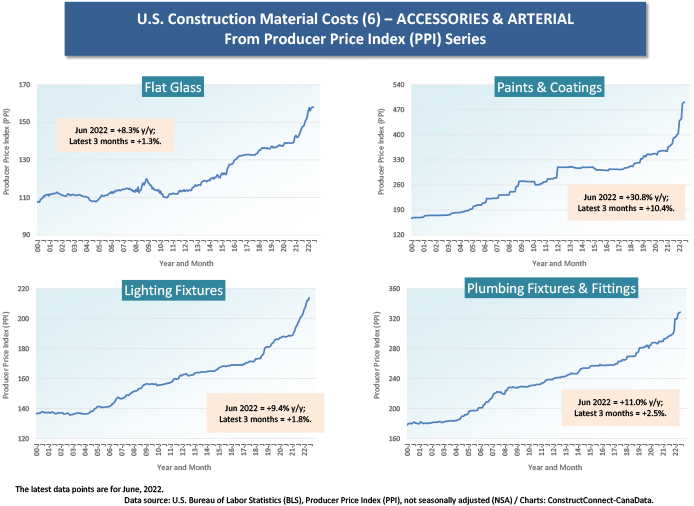
Cluster charts 1 through 7 lay out the historical price patterns for 28 material inputs.
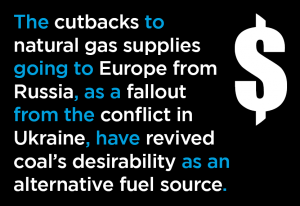
From Cluster Chart 4, iron ore and coal (ingredients in steelmaking) prices are continuing to soar. The cutbacks to natural gas supplies going to Europe from Russia, as a fallout from the conflict in Ukraine, have revived coal’s desirability as an alternative fuel source.
Cluster Chart 6 features one of the biggest jumps in prices among all materials, the +30.8% y/y climb (and +10.4% latest-three-months increase) for paints and coatings.
Cluster Chart 7 highlights sticker shock in the HVAC area. The cost of heating equipment as captured by the PPI calculations is +16.9% y/y; air conditioning equipment, +25.0% y/y.
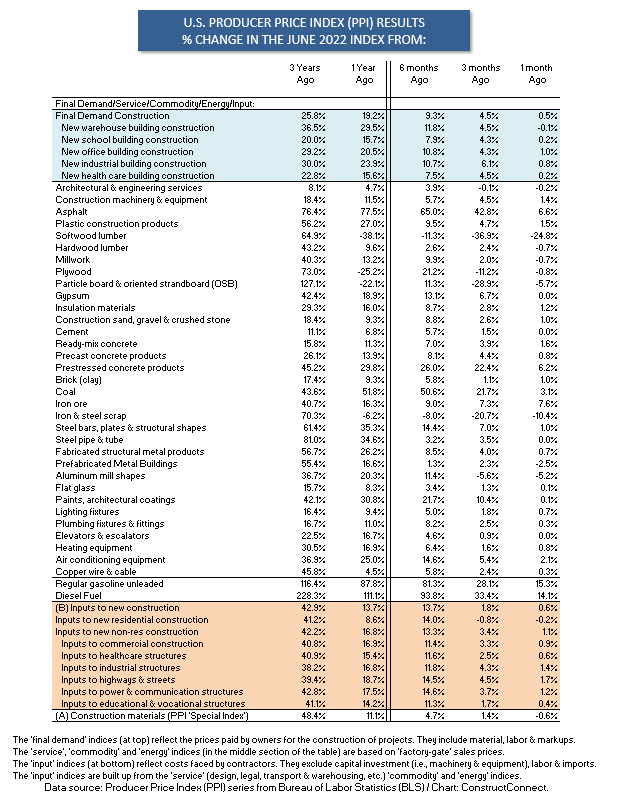
A table with all the numbers, for a wide range of products and percent changes over varying time frames, appears at the end of this article.
Graph 1
Graph 2
Cluster Chart 1
Cluster Chart 2
Cluster Chart 3
Cluster Chart 4
Cluster Chart 5
Cluster Chart 6
Cluster Chart 7
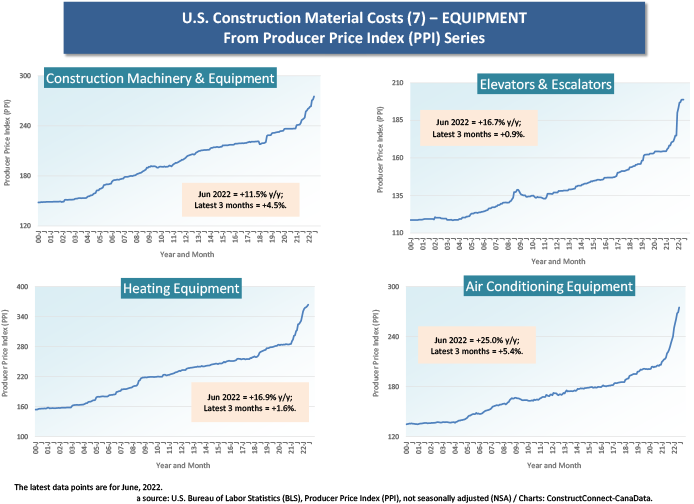
Table 1
Alex Carrick is Chief Economist for ConstructConnect. He has delivered presentations throughout North America on the U.S., Canadian and world construction outlooks. Mr. Carrick has been with the company since 1985. Links to his numerous articles are featured on Twitter @ConstructConnx, which has 50,000 followers.


Recent Comments
comments for this post are closed