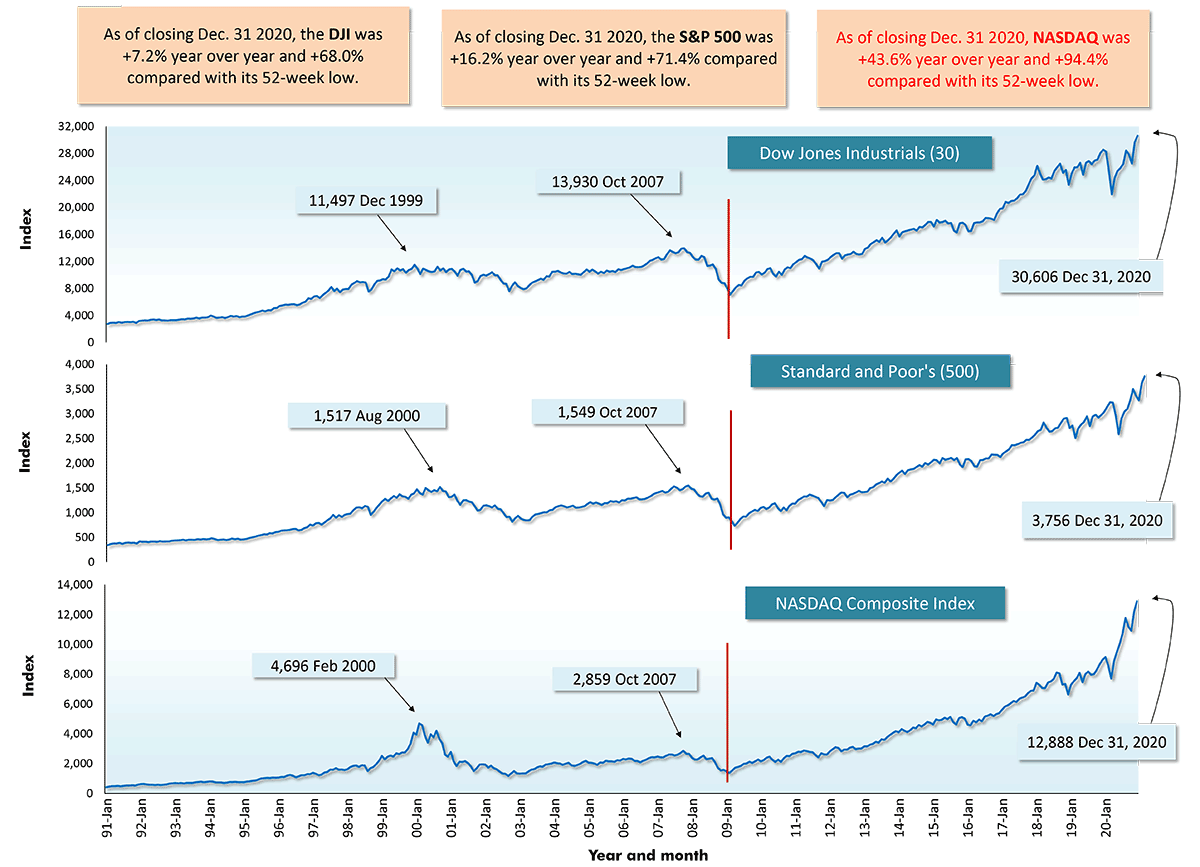
The U.S. economy may have been battered by the full-on return of the coronavirus contagion in 2020’s fourth quarter, but the nation’s principal stock markets were unfazed. The DJI, S&P 500 and NASDAQ all set new highs in December.
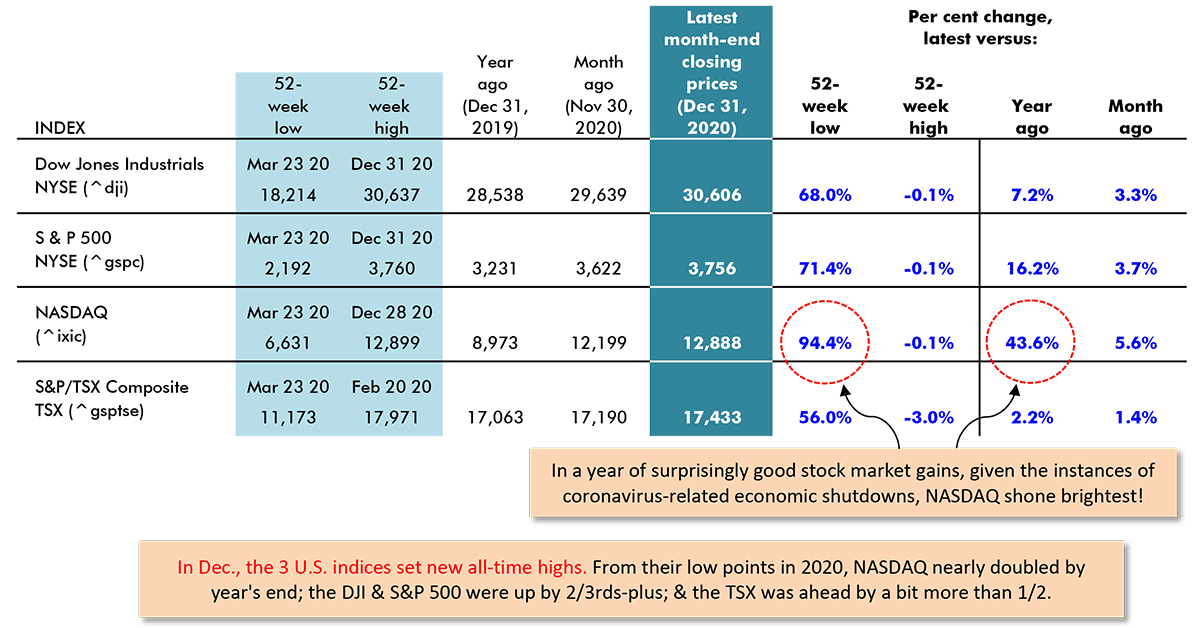
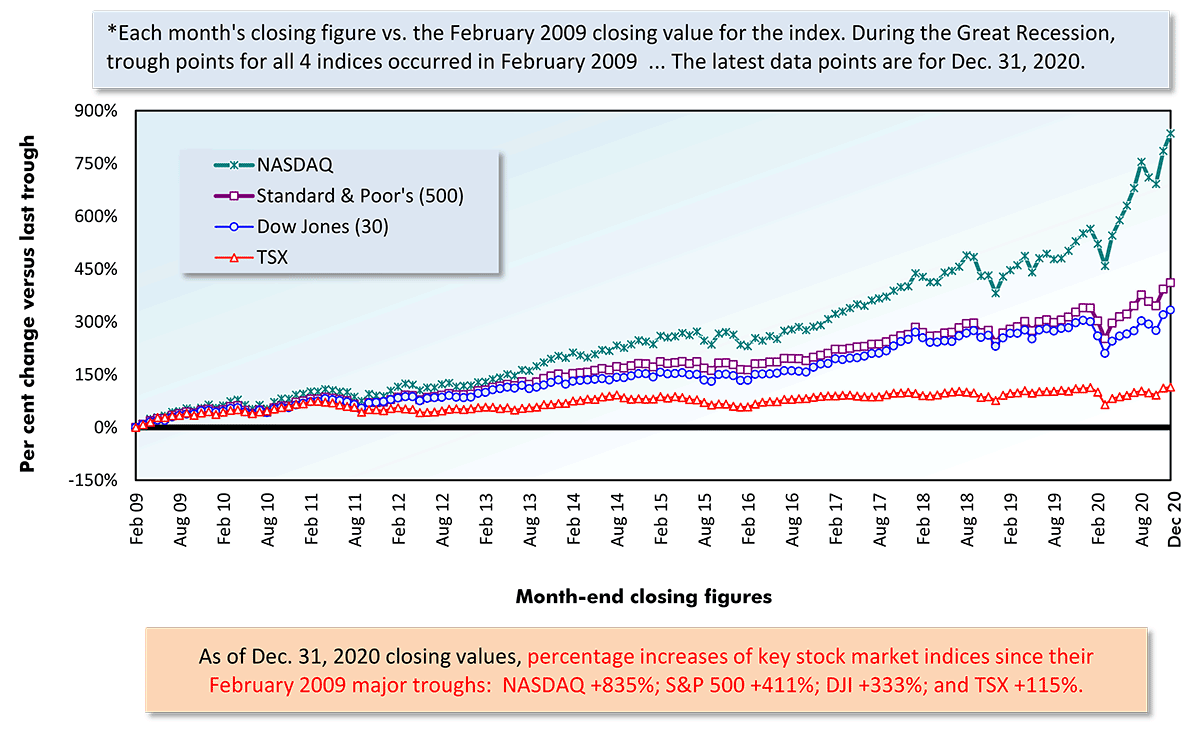
Compared with their low points in late March of last year, NASDAQ ended 2020 up by nearly double (+94.4%), the DJI and S&P 500 were ahead by between two-thirds and three-quarters (+68.0% and +71.4% respectively) and the TSX climbed by slightly more than half (+56%).
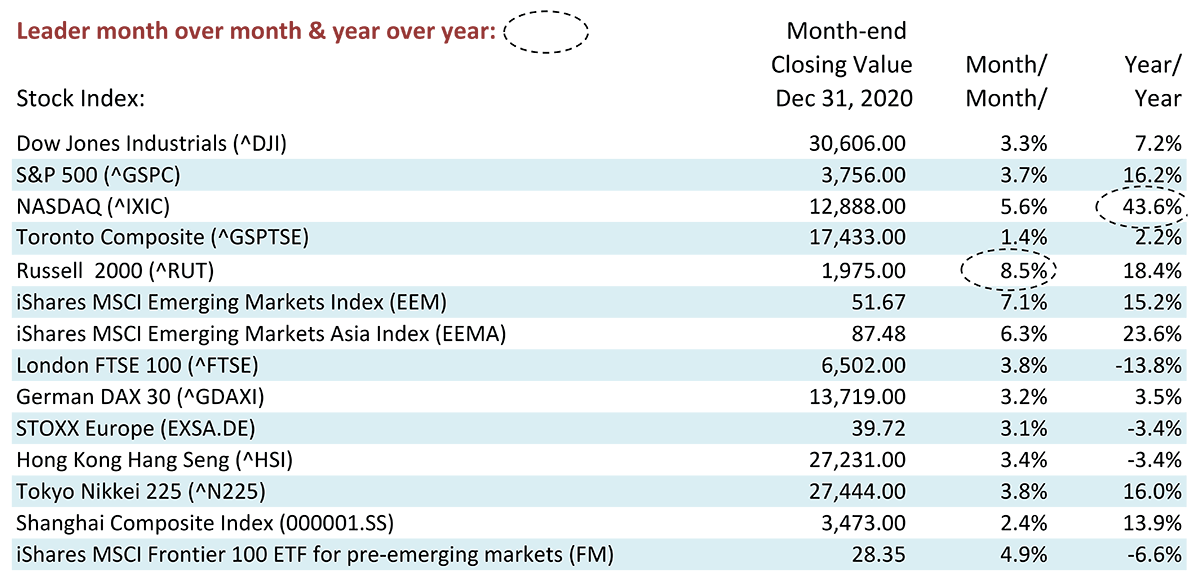
The Russell 2000 index, comprised of small cap companies, also performed well, +18.4% year over year and an outstanding +8.5% in December alone.
The improvements in the indices continued to be fueled by high-tech companies, which are now said to make up 40% of the S&P 500’s total market valuation.
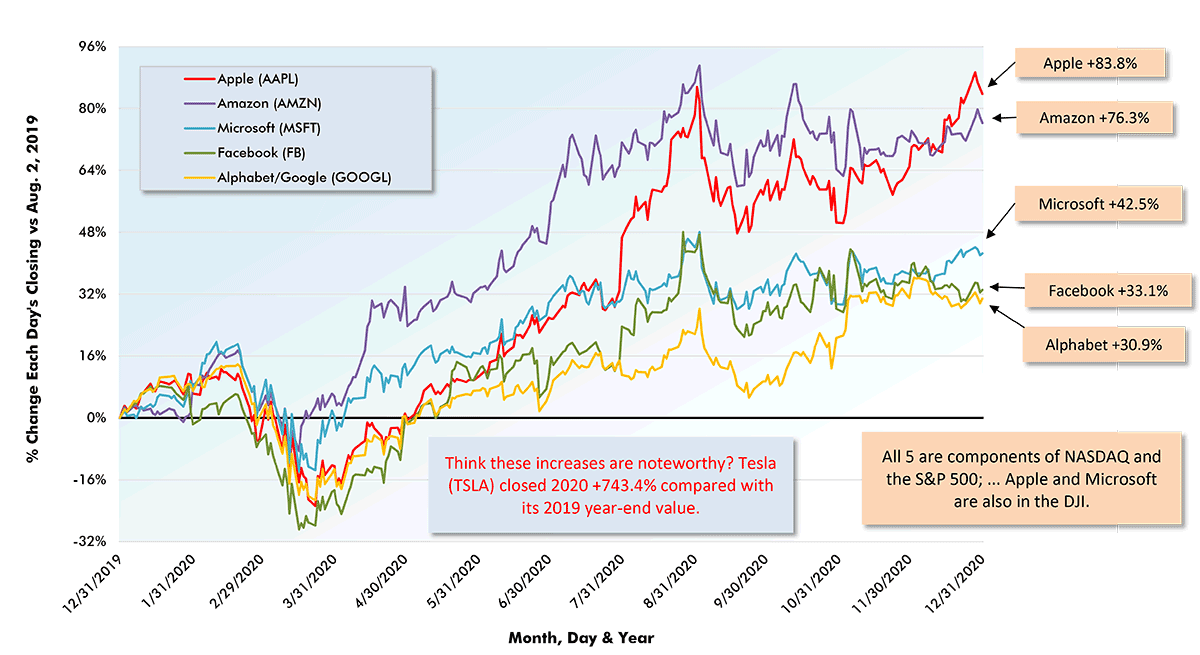
Among the FAAMG group of companies, Apple was the leader at +83.8% year over year (i.e., Dec 31 2020 vs Dec 31 2019). Next in line were Amazon, +76.3%; Microsoft, +42.5%; Facebook, +33.1%; and Alphabet, +30.9%. Concerning that last figure of +30.9%, the ‘least’ of the FAAMG companies still managed an equity appreciation of nearly one-third.
Most stunning of all, though, was the year-end closing value of Tesla’s stock, +743.4% relative to where it started the year.
Table 1: Stock exchanges – performances of key indices – December 31, 2020
Sources: New York Stock Exchange (NYSE), Standard and Poor’s (S & P), National Association of
Securities Dealers Automated Quotations (NASDAQ), Toronto Stock Exchange (TSE) and Reuters.
Table: ConstructConnect.
Graph 1: U.S. Stock Markets − December 31, 2020 Closings
Red vertical lines denote Feb 2009 major ‘troughs’ for the indices.
Latest data points are for Dec. 31, 2020.
Data sources: New York Stock Exchange (NYSE), Standard and Poor’s (S & P), National Association of
Securities Dealers Automated Quotations (NASDAQ), Reuters & Yahoo.
Chart: ConstructConnect.
Graph 2: Latest 52-Week Performances of FAAMG (Big Tech) Stocks
(Each day’s closing value compared with Dec. 31, 2019 (i.e., year-before) value
Data Sources: NYSE, Standard & Poor’s, NASDAQ, Reuters & Yahoo.
Chart: ConstructConnect.
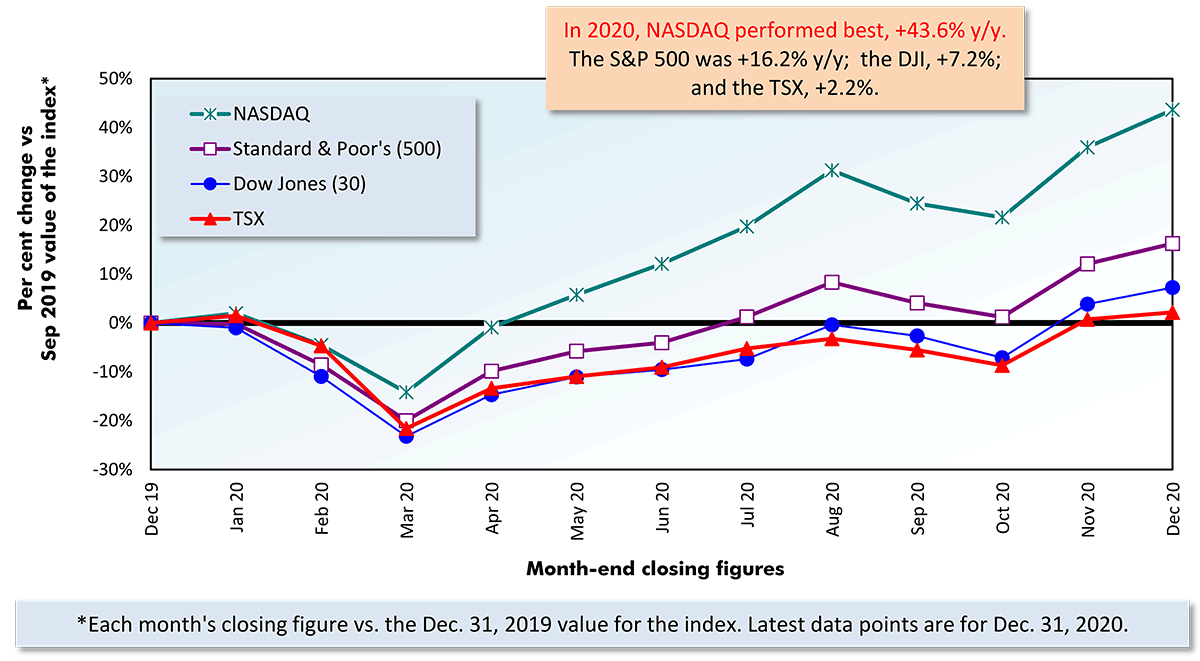
Graph 3: Performances of key stock market indices during last year
Data sources: New York Stock Exchange (NYSE), Standard and Poor’s (S & P), National Association of
Securities Dealers Automated Quotations (NASDAQ), Toronto Stock Exchange (TSE) and Reuters.
Graph 4: Performances of key stock market indices since 2008-09 troughs
Data sources: New York Stock Exchange (NYSE), Standard and Poor’s (S & P), National Association of
Securities Dealers Automated Quotations (NASDAQ), Toronto Stock Exchange (TSE) and Reuters.
Table 2: Key Domestic & International Stock Market Indices – December 31, 2020
‘"Ticker symbols" are in brackets. MSCI (formerly Morgan Stanley Capital International) is a leading provider of investment decision support tools, with indices as one specialty. "iShares" is a web site that specializes in "exchange traded funds", or ETFs, managed by BlackRock Investments LLC.
Data Source: ‘finance.yahoo.com’
Table: ConstructConnect.
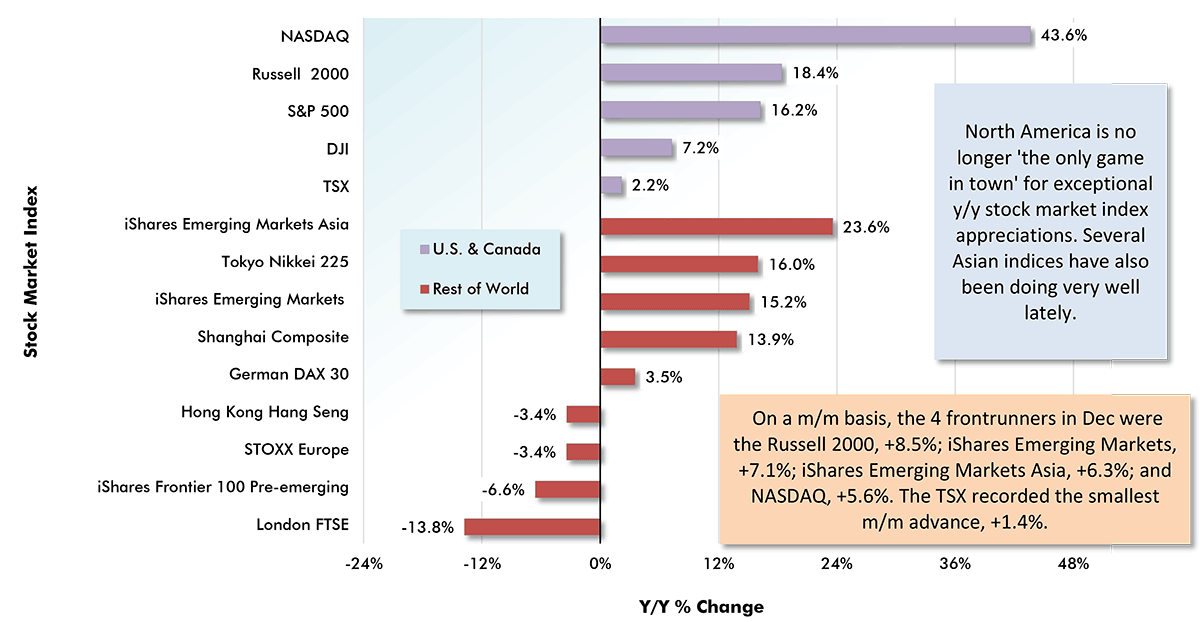
Graph 5: Stock Market Performances: U.S. & Canada vs Rest of World
Year over Year as of Month-end Closings, December 31, 2020
iShares is a web site that specializes in “exchange traded funds”, or ETFs, managed by BlackRock Investments LLC.
Data Source: ‘finance.yahoo.com’
Table: ConstructConnect.
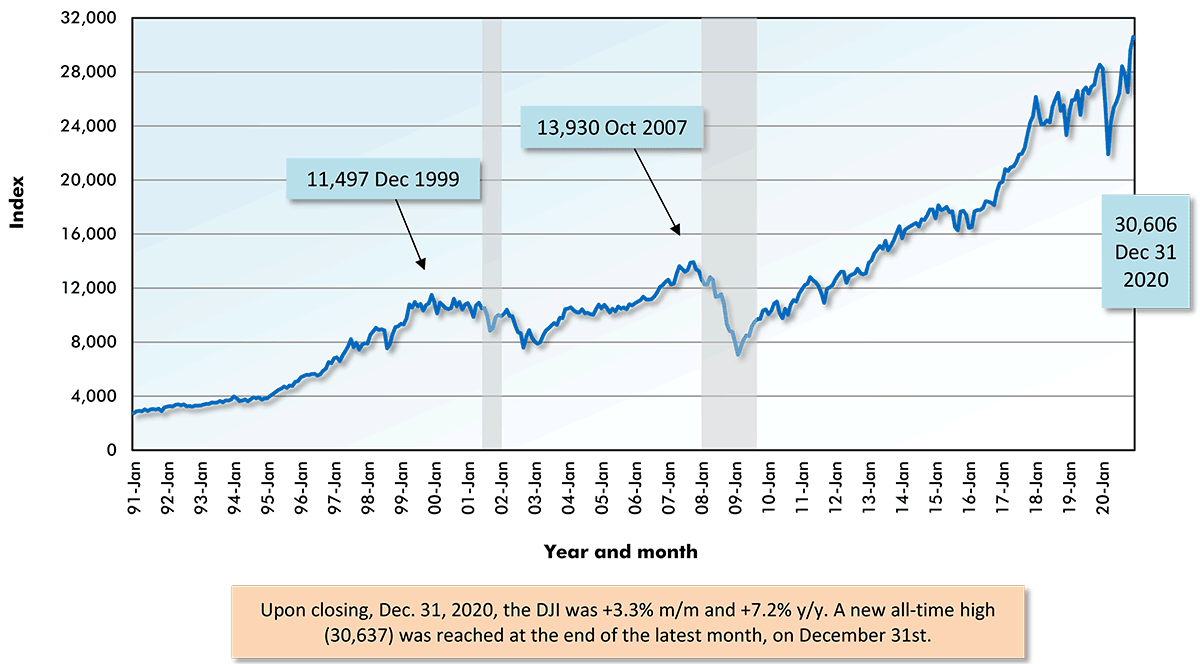
Graph 6: New York Stock Exchange: Dow-Jones Industrials (30)
Areas of gray shading denote century’s 2 prior recessions (‘dot.com’ collapse in 2001 & Great Recession Q1 08 to Q2 09). The chart shows month-end closing figures. The latest data point is for December 31, 2020.
Data sources: New York Stock Exchange (NYSE), Standard and Poor’s (S & P), National Association of
Securities Dealers Automated Quotations (NASDAQ), Toronto Stock Exchange (TSE) and Reuters.
Chart: ConstructConnect.
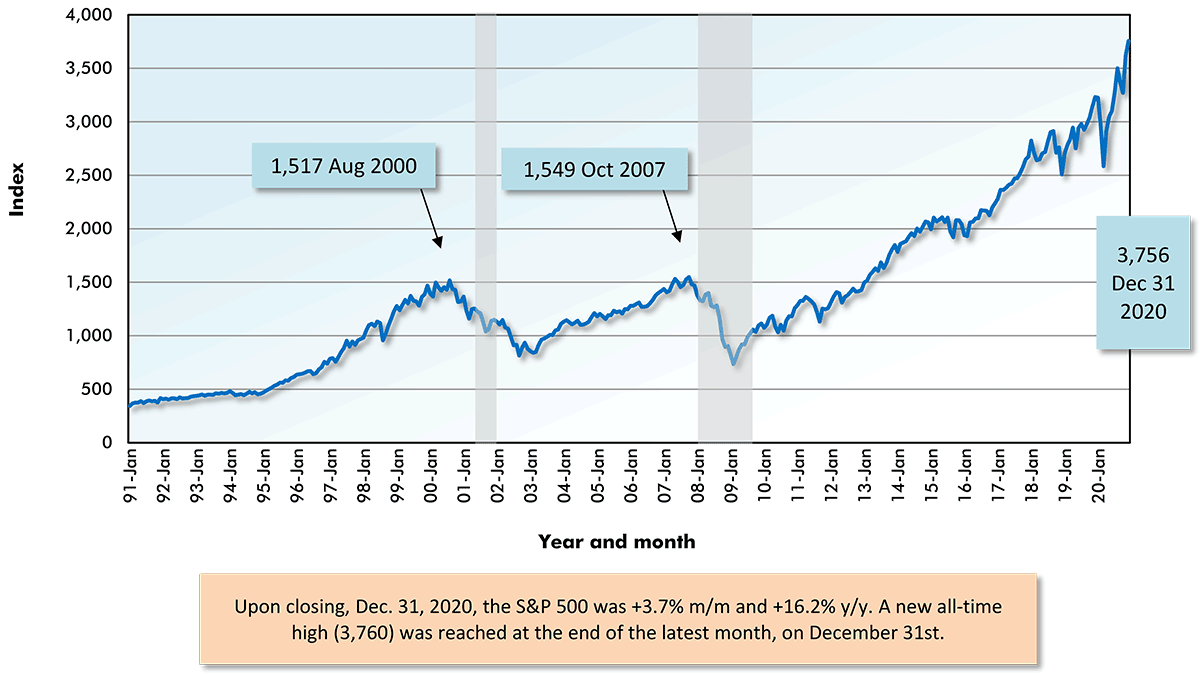
Graph 7: New York Stock Exchange: Standard and Poor’s (500)
Areas of gray shading denote century’s 2 prior recessions (‘dot.com’ collapse in 2001 & Great Recession Q1 08 to Q2 09). The chart shows month-end closing figures. The latest data point is for December 31, 2020.
Data sources: New York Stock Exchange (NYSE), Standard and Poor’s (S & P), National Association of
Securities Dealers Automated Quotations (NASDAQ), Toronto Stock Exchange (TSE) and Reuters.
Chart: ConstructConnect.
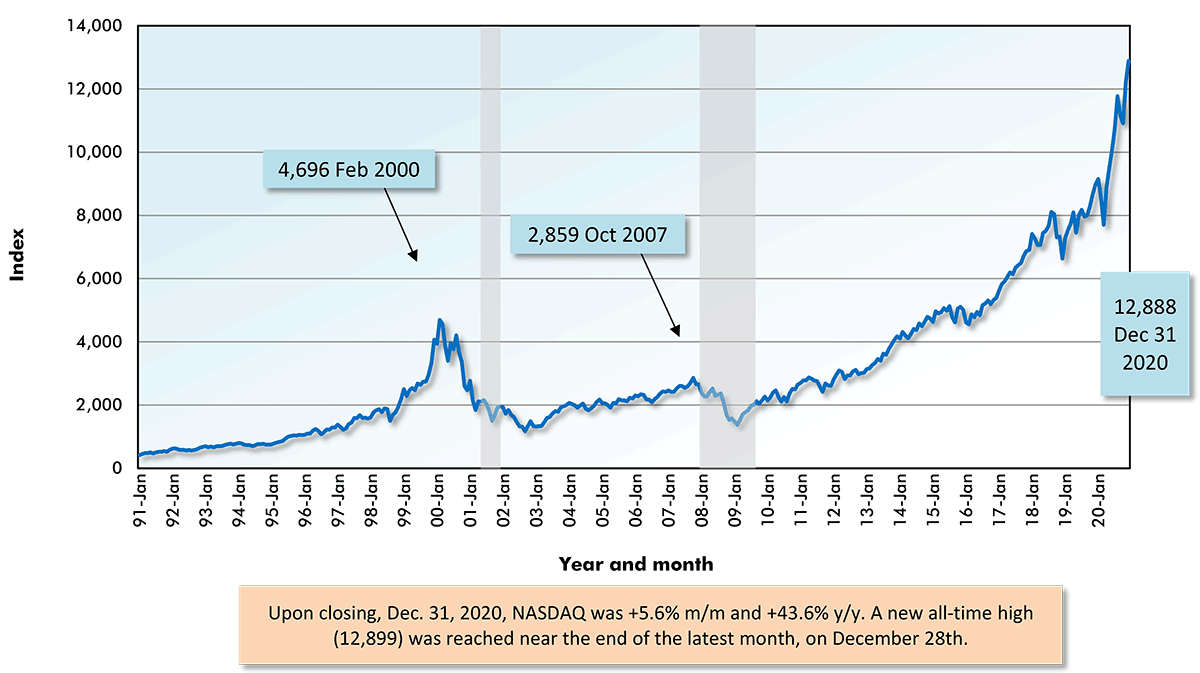
Graph 8: NASDAQ Composite Index
Areas of gray shading denote century’s 2 prior recessions (‘dot.com’ collapse in 2001 & Great Recession Q1 08 to Q2 09). The chart shows month-end closing figures. The latest data point is for December 31, 2020.
Data sources: New York Stock Exchange (NYSE), Standard and Poor’s (S & P), National Association of
Securities Dealers Automated Quotations (NASDAQ), Toronto Stock Exchange (TSE) and Reuters.
Chart: ConstructConnect.
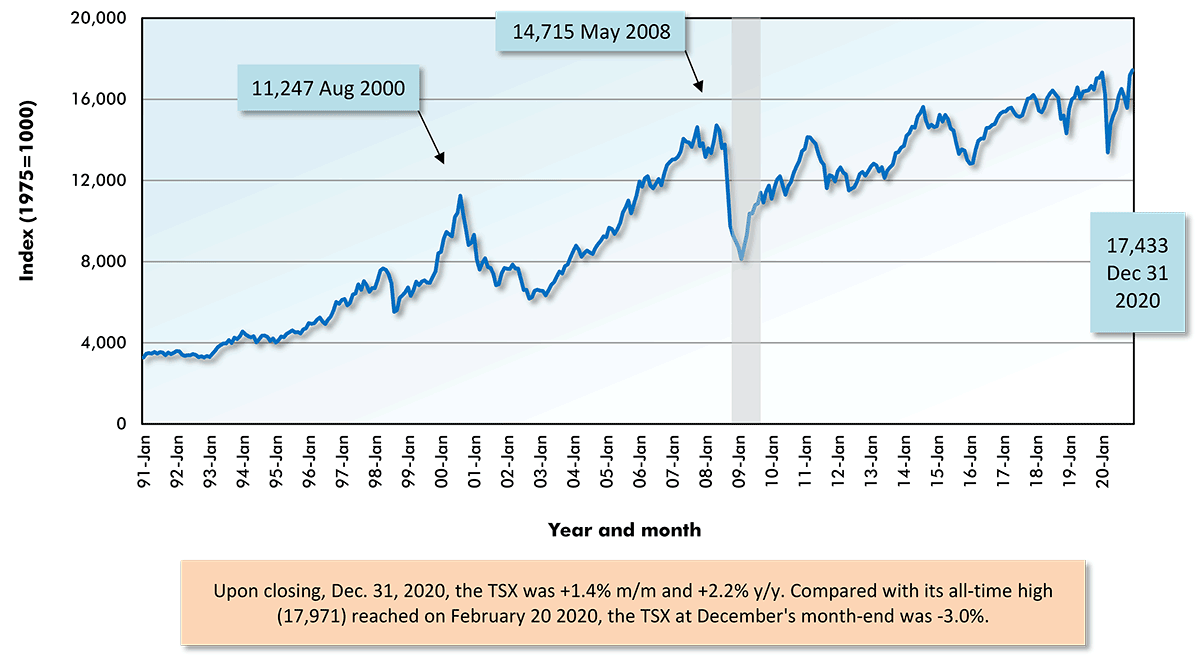
Graph 9: S&P/TSX Composite Index: Toronto Stock Exchange
Area of gray shading denotes Canada’s earlier recession in current century (Q4 2008 to Q2 2009; no ‘dot.com’ collapse). The chart shows month-end closing figures. The latest data point is for December 31, 2020.
Data sources: New York Stock Exchange (NYSE), Standard and Poor’s (S & P), National Association of
Securities Dealers Automated Quotations (NASDAQ), Toronto Stock Exchange (TSE) and Reuters.
Chart: ConstructConnect.
Alex Carrick is Chief Economist for ConstructConnect. He has delivered presentations throughout North America on the U.S., Canadian and world construction outlooks. Mr. Carrick has been with the company since 1985. Links to his numerous articles are featured on Twitter @ConstructConnx, which has 50,000 followers.



Recent Comments
comments for this post are closed