When challenged to make an economic or demographic size comparison, many of us use the ‘rule of thumb’ that things Canadian are one-tenth the size of things American.
 It’s not truly accurate. It’s supposedly based on population, but the resident count in the U.S. is 330 million to Canada’s 38 million, which is a ratio that’s slightly less than nine-to-one.
Nevertheless, ten-to-one holds appeal because it makes math calculations easy.
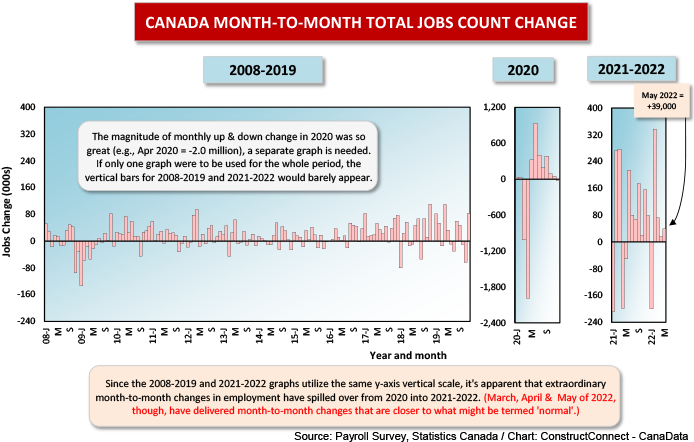
May’s total number-of-jobs advance in the U.S. was +390,000. What was the figure in Canada? It just so happens, according to Statistics Canada, that it was exactly one-tenth as great, +39,000.
Canada’s seasonally adjusted (SA) unemployment rate, which is often referred to as the ‘headline’ U rate, has shrunk to just 5.1%. That’s the lowest it’s been this century.
Statistics Canada also publishes an R3 U rate. R3 U, which is not seasonally adjusted (NSA), utilizes the same methodology as the U.S. Bureau of Labor Statistics (BLS) to determine who is out of work and aggressively seeking employment. It’s a tighter measure than Statcan’s usual calculation.
R3 U in Canada is now only 4.1%, not far off the 3.4% NSA U-rate figure generated by the BLS. Both numbers are extraordinarily low.
As a side observation, there’s talk of the U.S. economy soon entering, or already being immersed in, a recession. If that proves to be true, it will be a strange one from a labour market perspective. It’ll be a downturn when unemployment is about as low as it can ever go.
Graph 2 shows how closely U.S. and Canadian NSA U rates have been running since 2014.
Canada may have added a net +39,000 jobs in May, but they weren’t in either manufacturing or construction. Manufacturing’s payroll retracted by -43,000 jobs. Construction also experienced a jobs pullback, although to a much lesser degree, -3,000.
The Canadian construction sector’s country-wide NSA unemployment rate is now 4.4%. The month prior, it had been 5.9%. A year ago, in May 2021, it was 4.8%.
Among Canada’s four most populous provinces, Ontario has the lowest construction NSA U rate at 3.6%. Quebec is next in line at 3.9%, then it’s Alberta and B.C., 4.3% and 4.8% respectively.
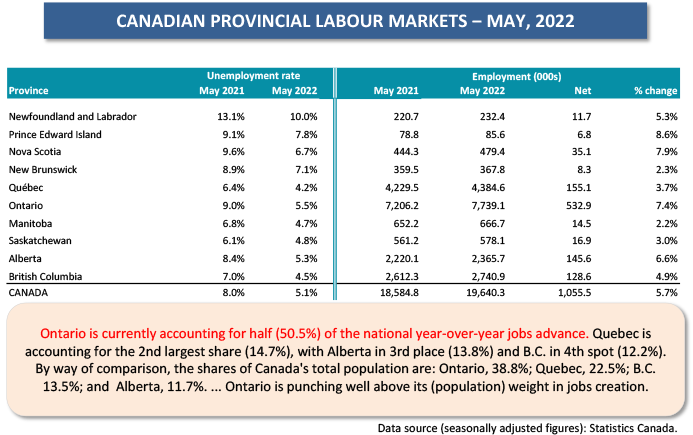
When it comes to creation of all jobs, Table 1 below reveals one rather startling fact. Half of the country’s total year-over-year climb in jobs count (+1.056 million) has occurred in Ontario (+533,000). By way of comparison, Ontario’s share of Canada’s total population is 39%.
But Ontario isn’t the province with the lowest all-jobs unemployment rate. That honour goes to Quebec, at 4.2%. There are three other provinces with U rates less than 5.0%: B.C., 4.5%; Manitoba, 4.7%: and Saskatchewan, 4.8%.
On the U-rate watch, Ontario (5.5%) also surrenders pride of place to Alberta (5.3%). Alberta’s economy and labour market are reviving coincident with significant energy-product price hikes globally. Natural gas has moved from around $3 USD per mcf (thousand cubic feet) to $7 and a barrel of oil is back above $100 USD.
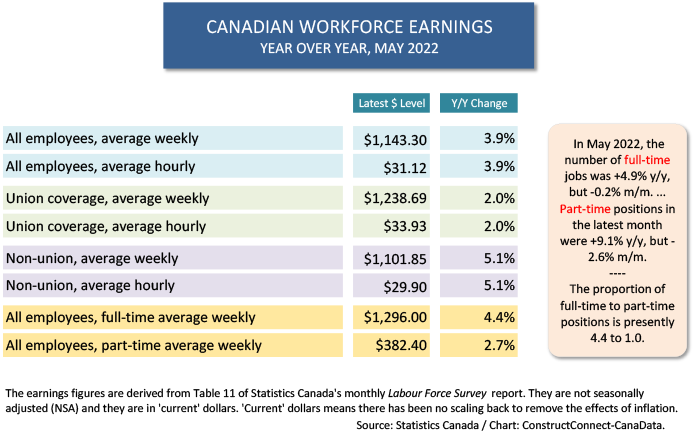
Finally, Canada is seeing some sizable wage increases, as set out in Table 2. But at near +4.0% year over year hourly and weekly for all employees, they’re falling short of the +6.0% step-ups being realized south of the border.
Graph 1
Graph 2
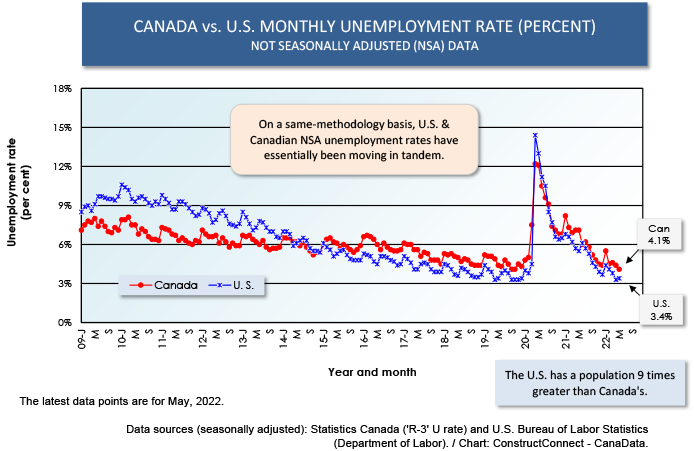
Table 1
Graph 3
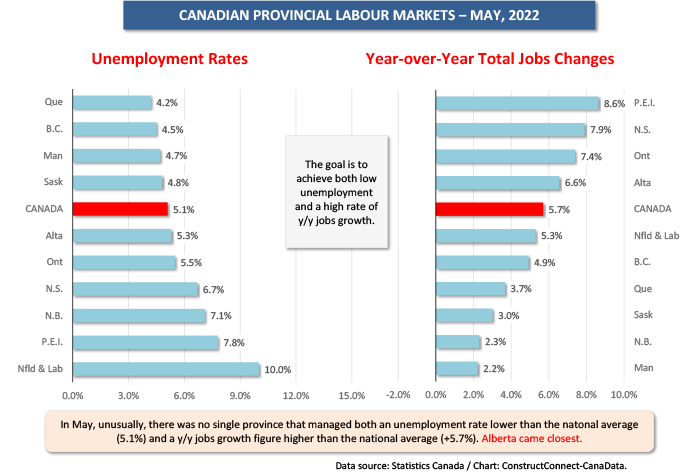
Table 2
Alex Carrick is Chief Economist for ConstructConnect. He has delivered presentations throughout North America on the U.S., Canadian and world construction outlooks. Mr. Carrick has been with the company since 1985. Links to his numerous articles are featured on Twitter @ConstructConnx, which has 50,000 followers.


Recent Comments