Coronavirus Continues Negative Influence
Canada suffered a disappointing setback in its quest for jobs recovery in April. According to Statistics Canada, total employment fell by -207,000 jobs in the month, as further incursions of the coronavirus forced stricter closure regimes in many parts of the county.
The seasonally adjusted (SA) unemployment rate rose to 8.1% from 7.5% in March; the not seasonally adjusted (NSA) rate rose to 7.1% from 6.9%.
There’s some consolation to be found in knowing the SA and NSA unemployment rates a year ago were much higher at 13.1% and 12.1% respectively.
Graph 1: Canada: Month-to-month Total Employment Change
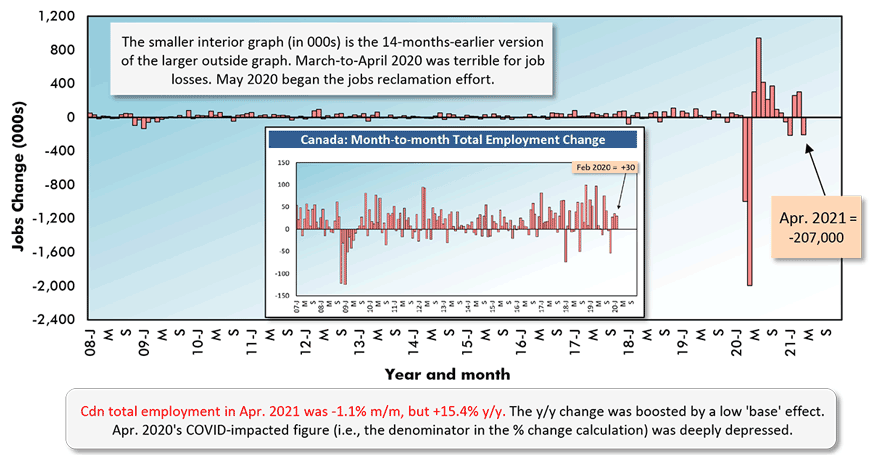
Chart: ConstructConnect.
Canadian Construction Employment -13,000 in April
In the construction sector, employment fell by -13,000 jobs in the latest month. Staffing in manufacturing, however, managed to remain level, +1,000 jobs. Because employment in both sectors was extraordinarily weak in April a year ago, their year-over-year jobs performances jump off the page, +21.3% for construction and +23.8% for manufacturing.
‘Accommodation and food services’, though, is where the truly dramatic swings in employment have occurred in this pandemic-induced period of economic crisis. After making a minor degree of headway in restoring jobs through the first quarter of this year, April saw a cutback of -59,000. Nevertheless, total employment in Canadian hotels/motels, bars and restaurants is +40.7% year over year.
Canada can also take encouragement from the fact its total jobs recovery rate (versus the big drop that occurred between February and April 2020) is a decent 83.3%. By comparison, America’s current jobs ‘claw-back’ ratio is still less than two-thirds, at 63.3%.
From Table 1, it’s interesting that in both countries, the year-over-year change in service sector jobs is almost identical, +14.0% for the U.S. and +14.5% for Canada.
Full-time employment in Canada is currently +12.2% year over year, although it was -0.8% month to month in April. But consider the number of part-time jobs. They’re +32.6% y/y, although -2.3% in the latest month.
Table 1: U.S. and Canadian Jobs Markets – April 2021
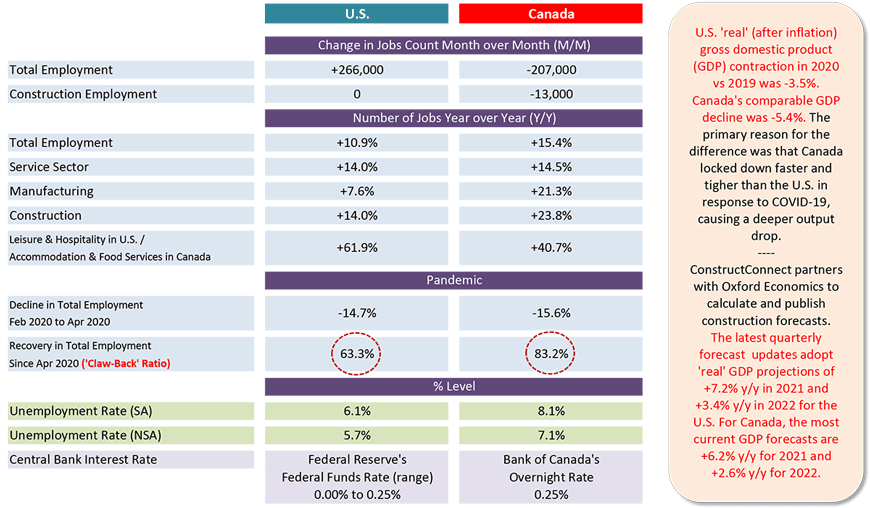
U.S. labor data is from a ‘payroll survey’ / Canadian labour data is from a ‘household survey’.
Canadian NSA unemployment rate ‘R3’ is adjusted to U.S. concepts (i.e., it adopts U.S. equivalent methodology).
Table: ConstructConnect.
Quebec’s Jobs Count Plus One-fifth Y/Y
The ‘low base’ effect is also yielding outsized y/y percentage changes for jobs counts in the provinces. Quebec, where the economy (including construction) was tightly constrained in the Spring of last year, is experiencing a one-fifth (+19.8%) y/y improvement at this time.
Among big-population provinces, B.C. is seeing a +17.4% y/y gain in jobs. Alberta is realizing a nice bounce back as well, +15.0%. Ontario is more restrained, +12.6%, the second slowest among all provinces.
Saskatchewan’s buoyant agricultural economy is placing it at the head of the pack for unemployment rates among all the provinces, ranked from relatively spare (6.6%) to most extreme (13.9% in Newfoundland and Labrador).
Graph 2: Canada’s Provincial Labour Markets – April 2021
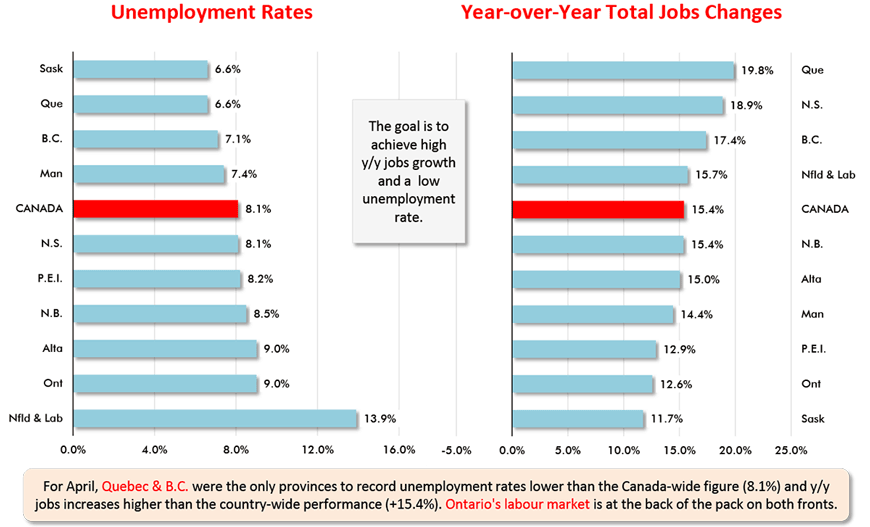
Chart: ConstructConnect.
Table 2: Canada’s Provincial Labour Markets – April 2021
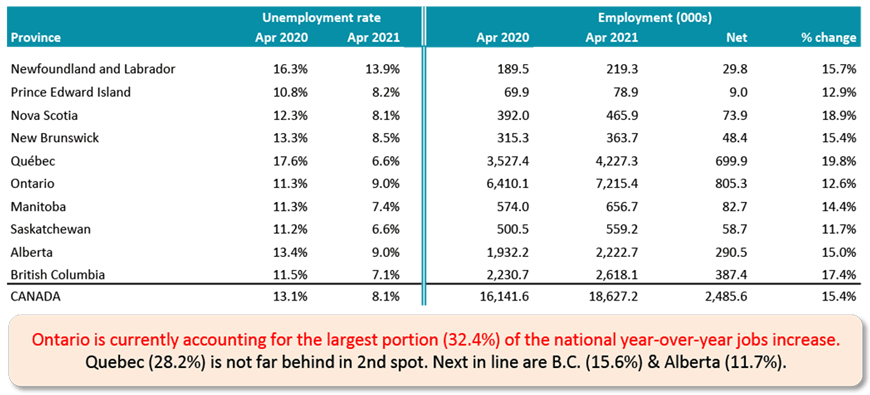
Table: ConstructConnect.
Table 3: Monitoring the Canadian Employment Recovery ‒ April 2021
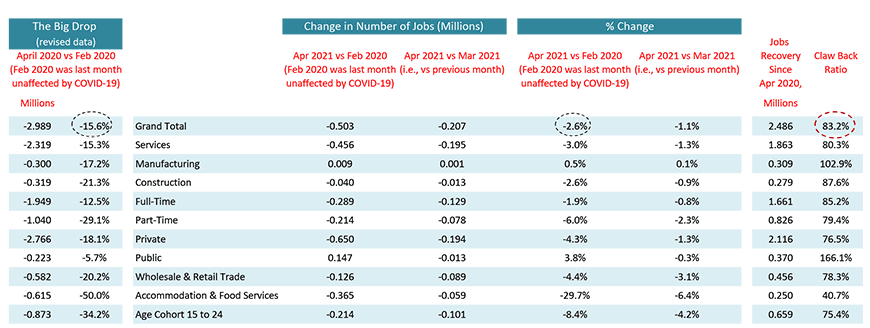
Table: ConstructConnect.
Please click on the following link to download the PDF version of this article:
Economy at a Glance Vol. 17, Issues 70 and 71 – Canada Stubs Toe Along Jobs Recovery Path – PDF
Alex Carrick is Chief Economist for ConstructConnect. He has delivered presentations throughout North America on the U.S., Canadian and world construction outlooks. Mr. Carrick has been with the company since 1985. Links to his numerous articles are featured on Twitter @ConstructConnx, which has 50,000 followers.


Recent Comments