Forecaster Charts & Tables
Retail Sales
Retail is shifting from ‘bricks and mortar’ stores to warehouse construction in support of online platforms.
Total Retail Sales in the U.S.
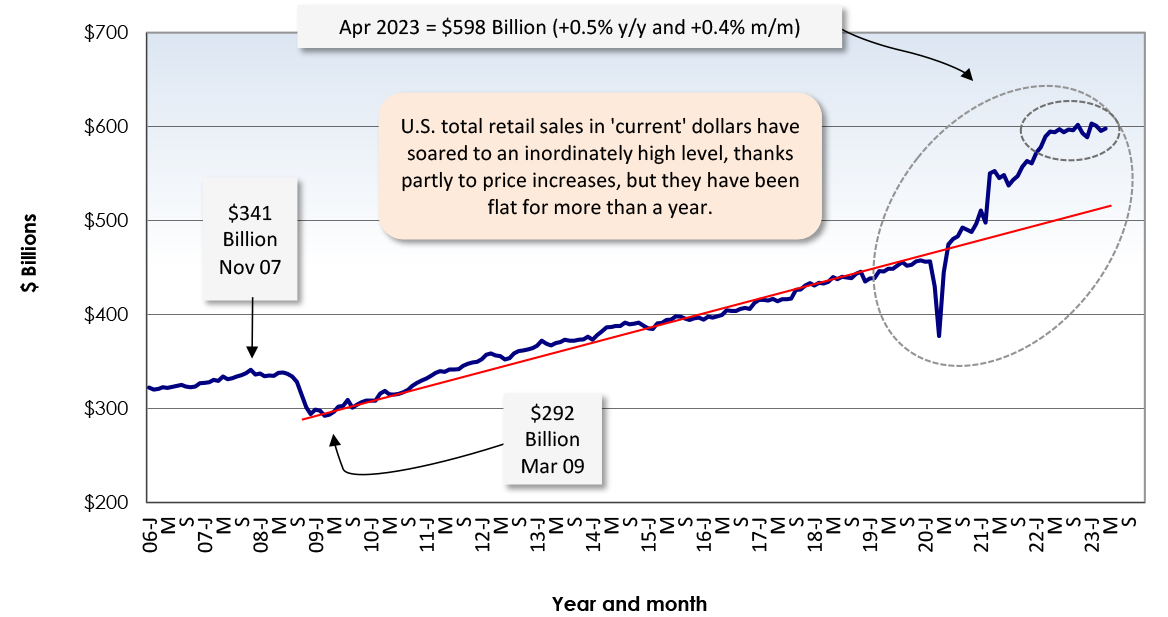
Latest data point is April, 2023.
Adjusted for seasonal variation, holiday and trading day differences, but not for price changes.
Data source: U.S. Census Bureau (Department of Commerce) / Chart: ConstructConnect – CanaData.
Total Retail Sales Since 'Great' Recession, U.S. & Canada
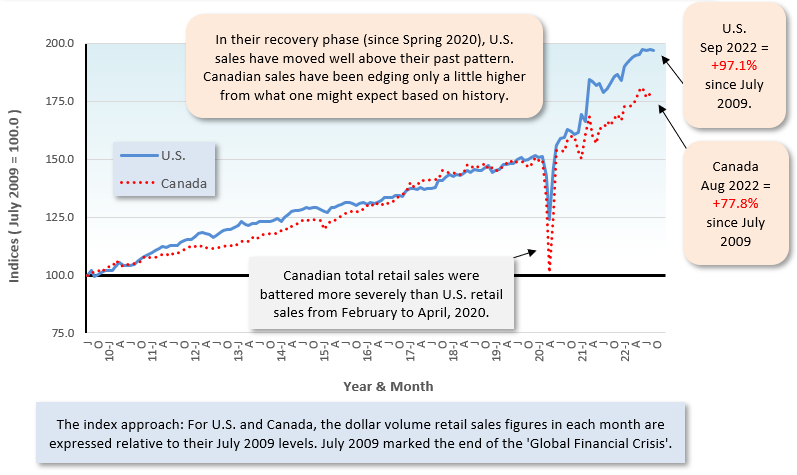
Based on Data Adjusted for Seasonal, Holiday & Trading Day Differences.
The latest released data point for the U.S. is September, 2022; for Canada, the data trails by a month, August, 2022.
Data sources: Statistics Canada and U.S. Census Bureau (Department of Commerce).
Total Retail Sales in Canada
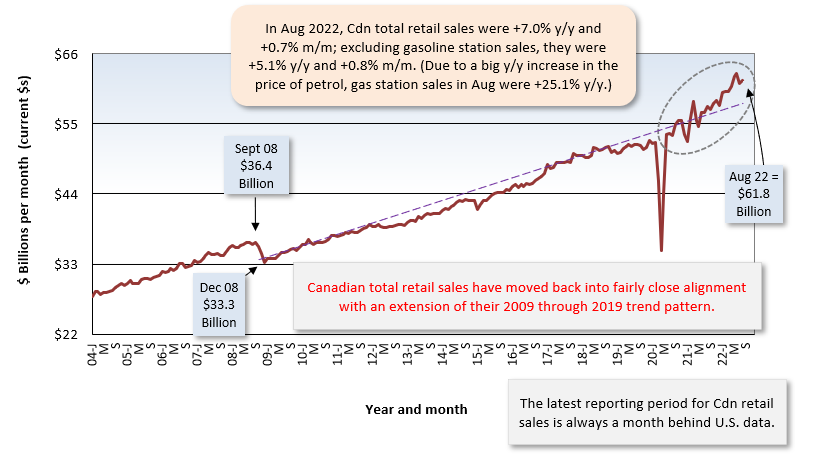
Data source: Statistics Canada Table 20-10-0078-01/Chart: ConstructConnect — CanaData.
Sales by Canadian Building Material & Garden Supplies Dealers
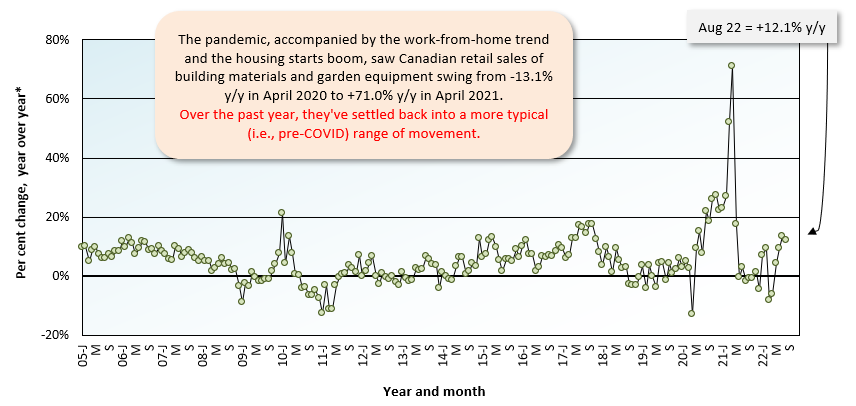
*”Year over year” is each month versus the same month of the previous year.
Latest data point is for August, 2022.
Data source: Statistics Canada.
Chart: ConstructConnect.
U.S. Retail and Food Services Sales Y/Y
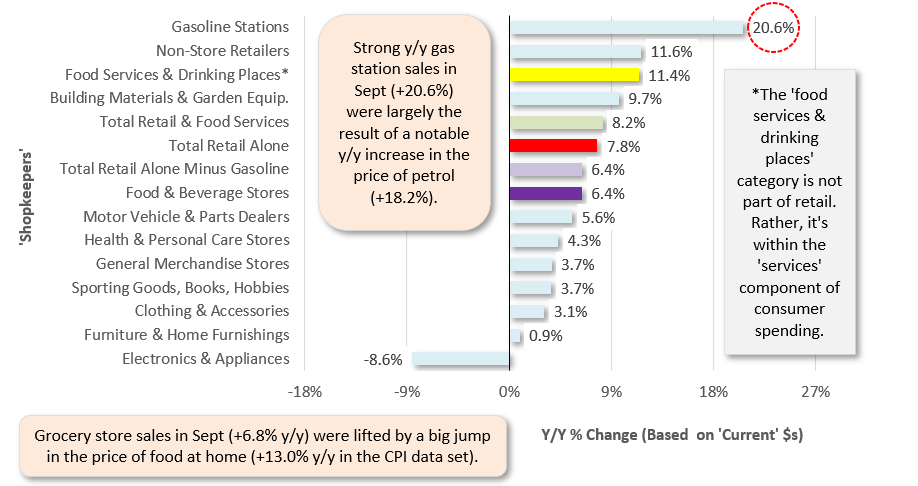
Y/Y, as of September 2022.
‘Current dollars’ means not adjusted for inflation. Underlying numbers are seasonally adjusted & not ‘smoothed’.
Data source: U.S. Census Bureau / Chart: ConstructConnect-CanaData.
Sales by U.S. Building Material & Supplies Dealers
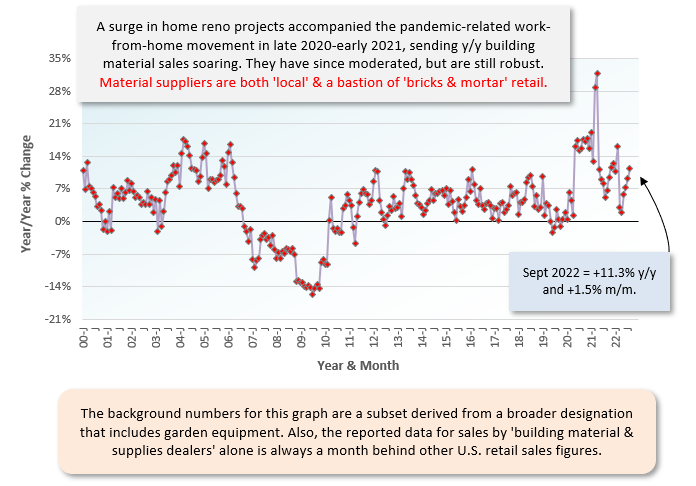
Data source: Census Bureau / Chart: ConstructConnect-CanaData.
U.S. Monthly Sales by General Merchandise Stores vs Non-Store Retailers (i.e., Internet Platforms & Auction Houses)
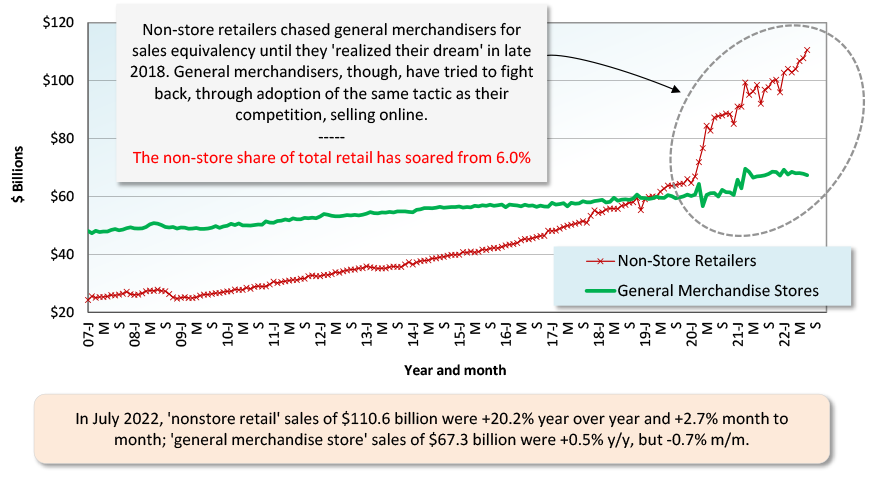
Adjusted for seasonal variation, holiday and trading day differences, but not for price changes.
Latest data points are for July, 2022.
Data source: U.S. Census Bureau (Department of Commerce) / Chart: ConstructConnect-CanaData.
Canadian Retail Sales Y/Y
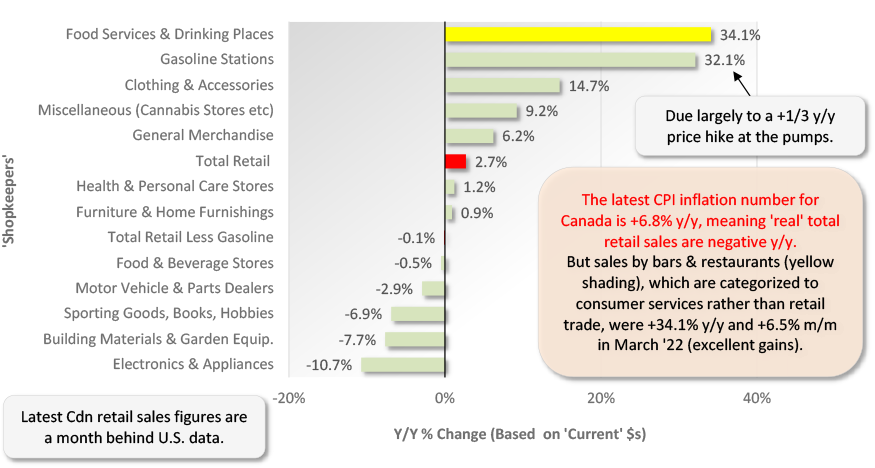
For March 2022.
‘Current dollars’ means not adjusted for inflation. Underlying numbers are seasonally adjusted & not ‘smoothed’.
Data source: Statistics Canada / Chart: ConstructConnect-CanaData.
U.S. Sales by Food Services & Drinking Places
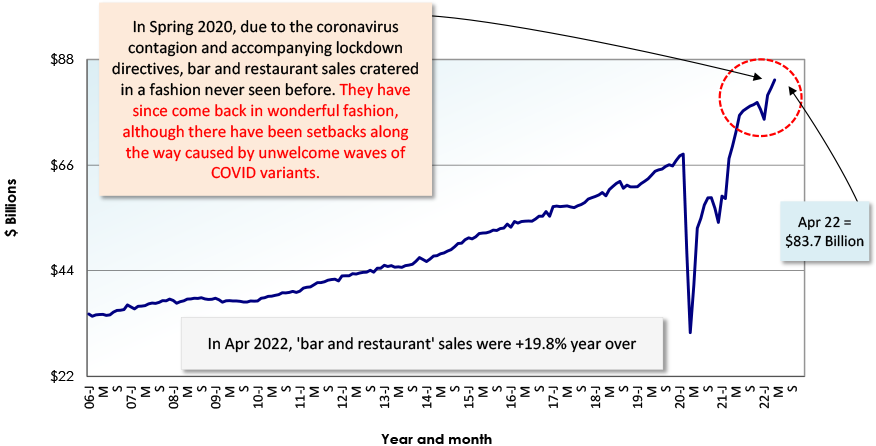
Latest data point is for February, 2022.
Adjusted for seasonal variation, holiday and trading day differences, but not for price changes.
Data source: U.S. Census Bureau (Department of Commerce).
Chart: ConstructConnect.
Canada Food Services & Drinking Places Sales*
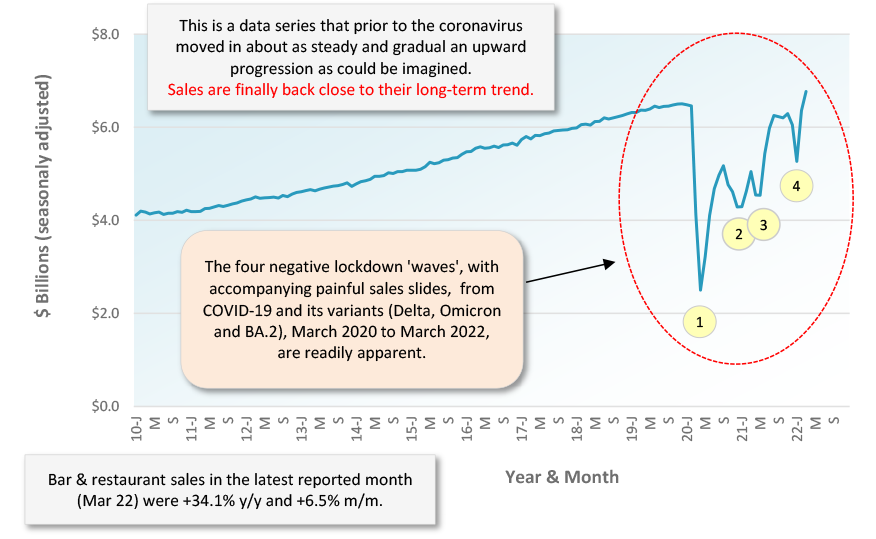
*Better know as bar and restaurant sales.
Latest data point is for March 2022.
Data source: Statistics Canada Table 21-10-0019-01.
Chart: ConstructConnect.
U.S. Motor Vehicle & Parts Sales Within Total Retail
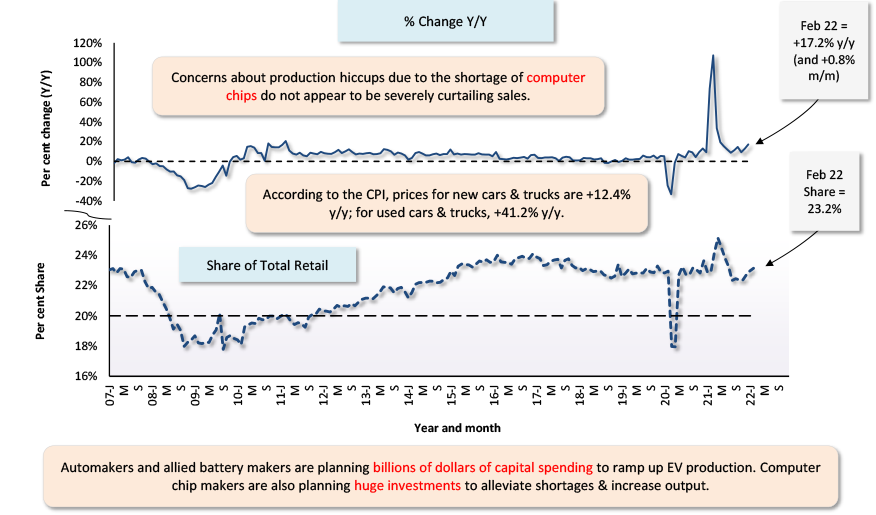
Latest data points are for February, 2022.
Data source: U.S. Census Bureau / Chart: ConstructConnect-CanaData.
Canadian Home-Related Retail Sales
Latest data points are for June, 2021.
*”Year over year” is each month versus the same month of the previous year.
‘Based on ‘current’ (i.e., no accouting for inflation) dollar and seasonally adjusted data.
Data source: Statistics Canada / Chart: ConstructConnect-CanaData.
Retail Sales - Canada, Provinces & Cities
September 2021 Year-over-Year (Y/Y) & Shares
Based on ‘current’ dollars (i.e., not altered for inflation) that have been seasonally adjusted.
Data source: Statistics Canada / Chart: ConstructConnect-CanaData.
U.S. Home-Related Retail Sales Y/Y
*”Year over year” is each month versus the same month of the previous year.
Based on ‘current’ (i.e., not adjusted for inflation) dollars. Latest data points are for July, 2021.
Adjustments are for seasonal variation, holiday and trading day differences, but not for price changes.
Data source: U.S. Census Bureau (Department of Commerce) / Chart: ConstructConnect – CanaData.
Recent Comments