
General and sub-trade contractors have long been complaining that they can’t find sufficient qualified workers to fill vacant positions. Recently, employers in other sectors of the economy have also become vocal about their staffing problems.
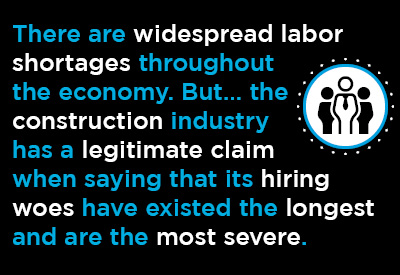 Graphs 1 through 5 below confirm that there are widespread labor shortages throughout the economy. But they also make clear that the construction industry has a legitimate claim when saying that its hiring woes have existed the longest and are the most severe.
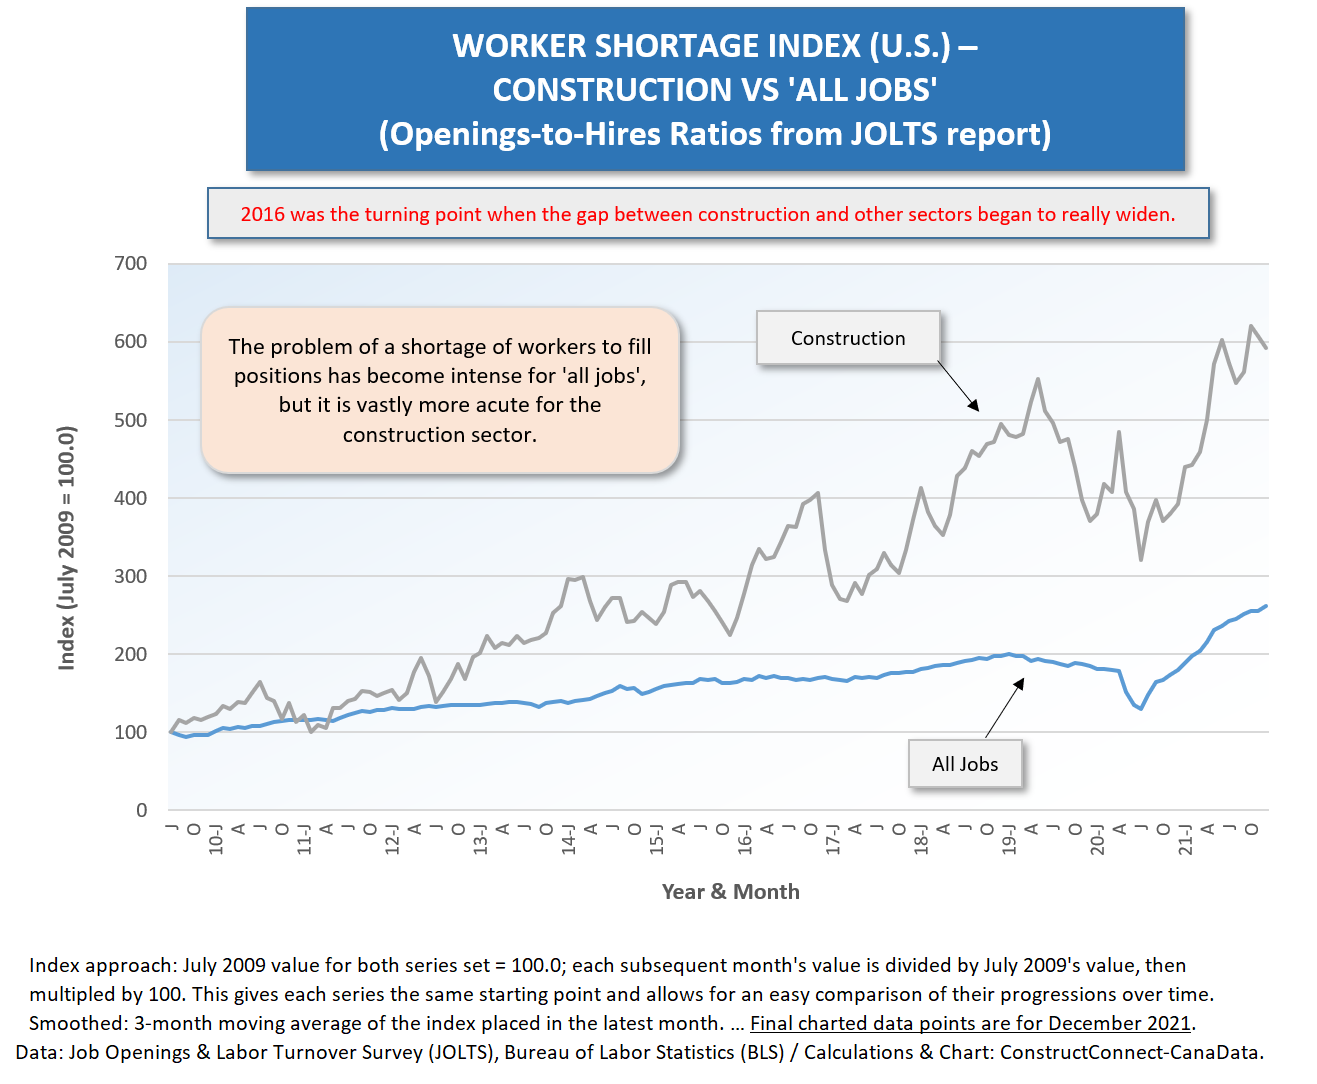
The curves in the graphs are based on ‘openings’ to ‘hires’ ratios calculated from the numbers appearing in the monthly JOLTS reports from the Bureau of Labor Statistics (BLS). JOLTS stands for Job Openings and Labor Turnover Survey.
The ratios for each data series (i.e., for construction, manufacturing, retail trade, etc.) are converted into indices by setting their values in July 2009 equal to 100.0 and expressing each subsequent month’s value relative to that starting point. Having the same base point (July 2009 = 100.0) means that the series can be easily compared visually when presented in a graph.
July 2009 was the first month of recovery after the sub-prime mortgage and financial crisis recession.
From Graph 1, the staffing distress for ‘all jobs’ has picked up dramatically since mid-2000, after the slope of the curve nosedived in the second quarter of 2020. In Q2 2020, almost no-one was looking to hire, as nearly everyone was more concerned about staying isolated, to avoid infection from the new-on-the-scene coronavirus.
But as much as the ‘all jobs’ curve in Graph 1 is now sloping more dramatically upwards, it’s ascending in a fashion that barely registers when compared with the ‘openings-to-hires’ trailblazing being done by construction.
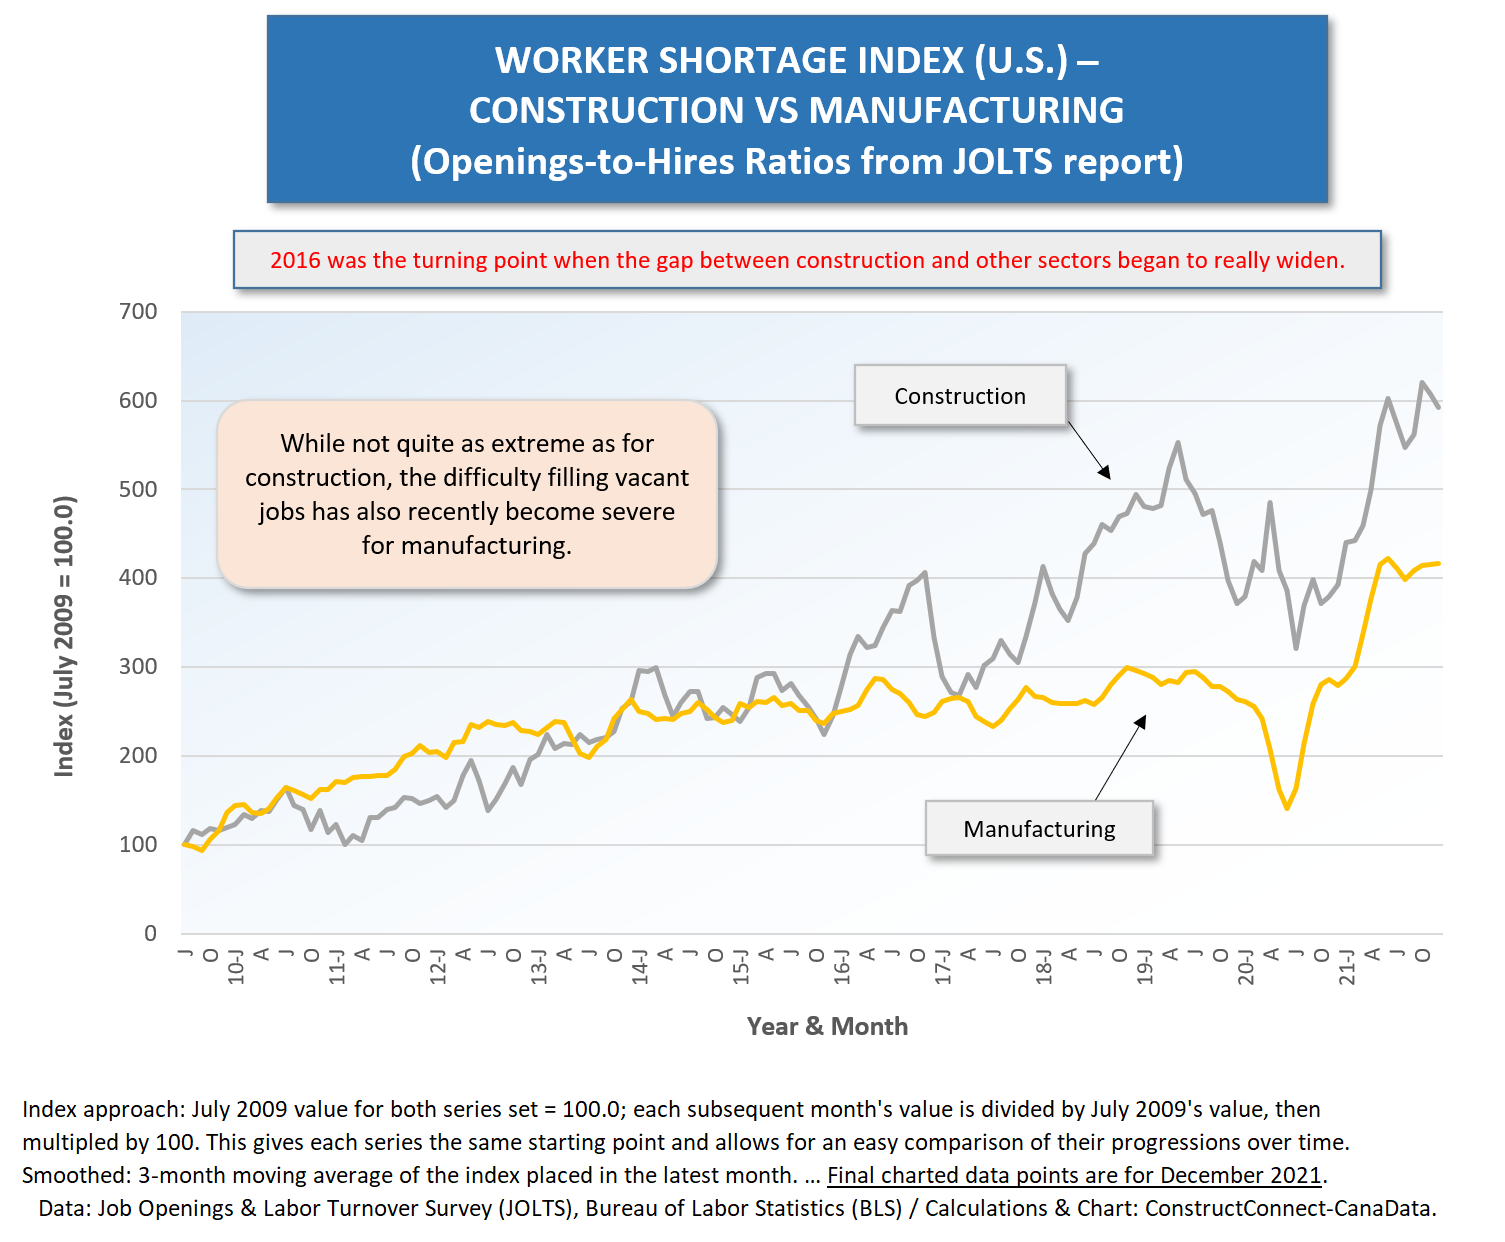
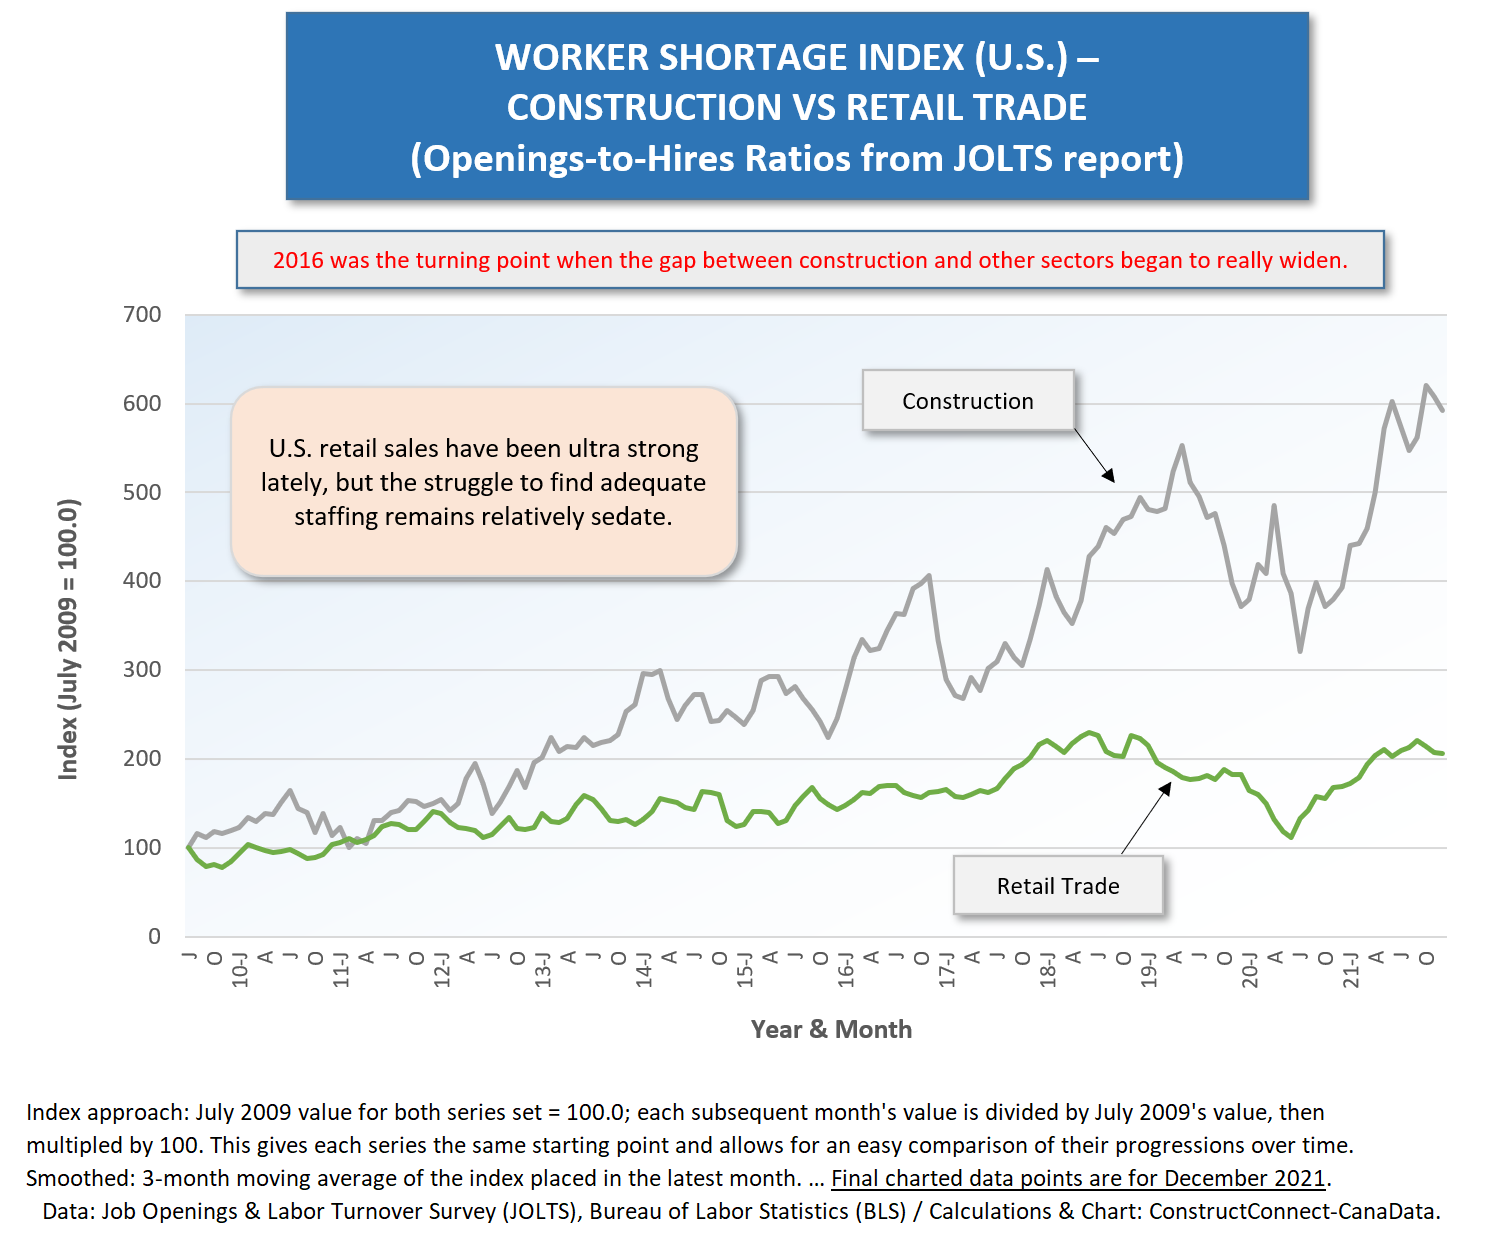
Graphs 2 through 5 compare the hiring woes of construction with four other sectors. In each case, the curve for construction lies above the curve for the other industry, indicating a problem that has become relatively more serious and has been entrenched longer.
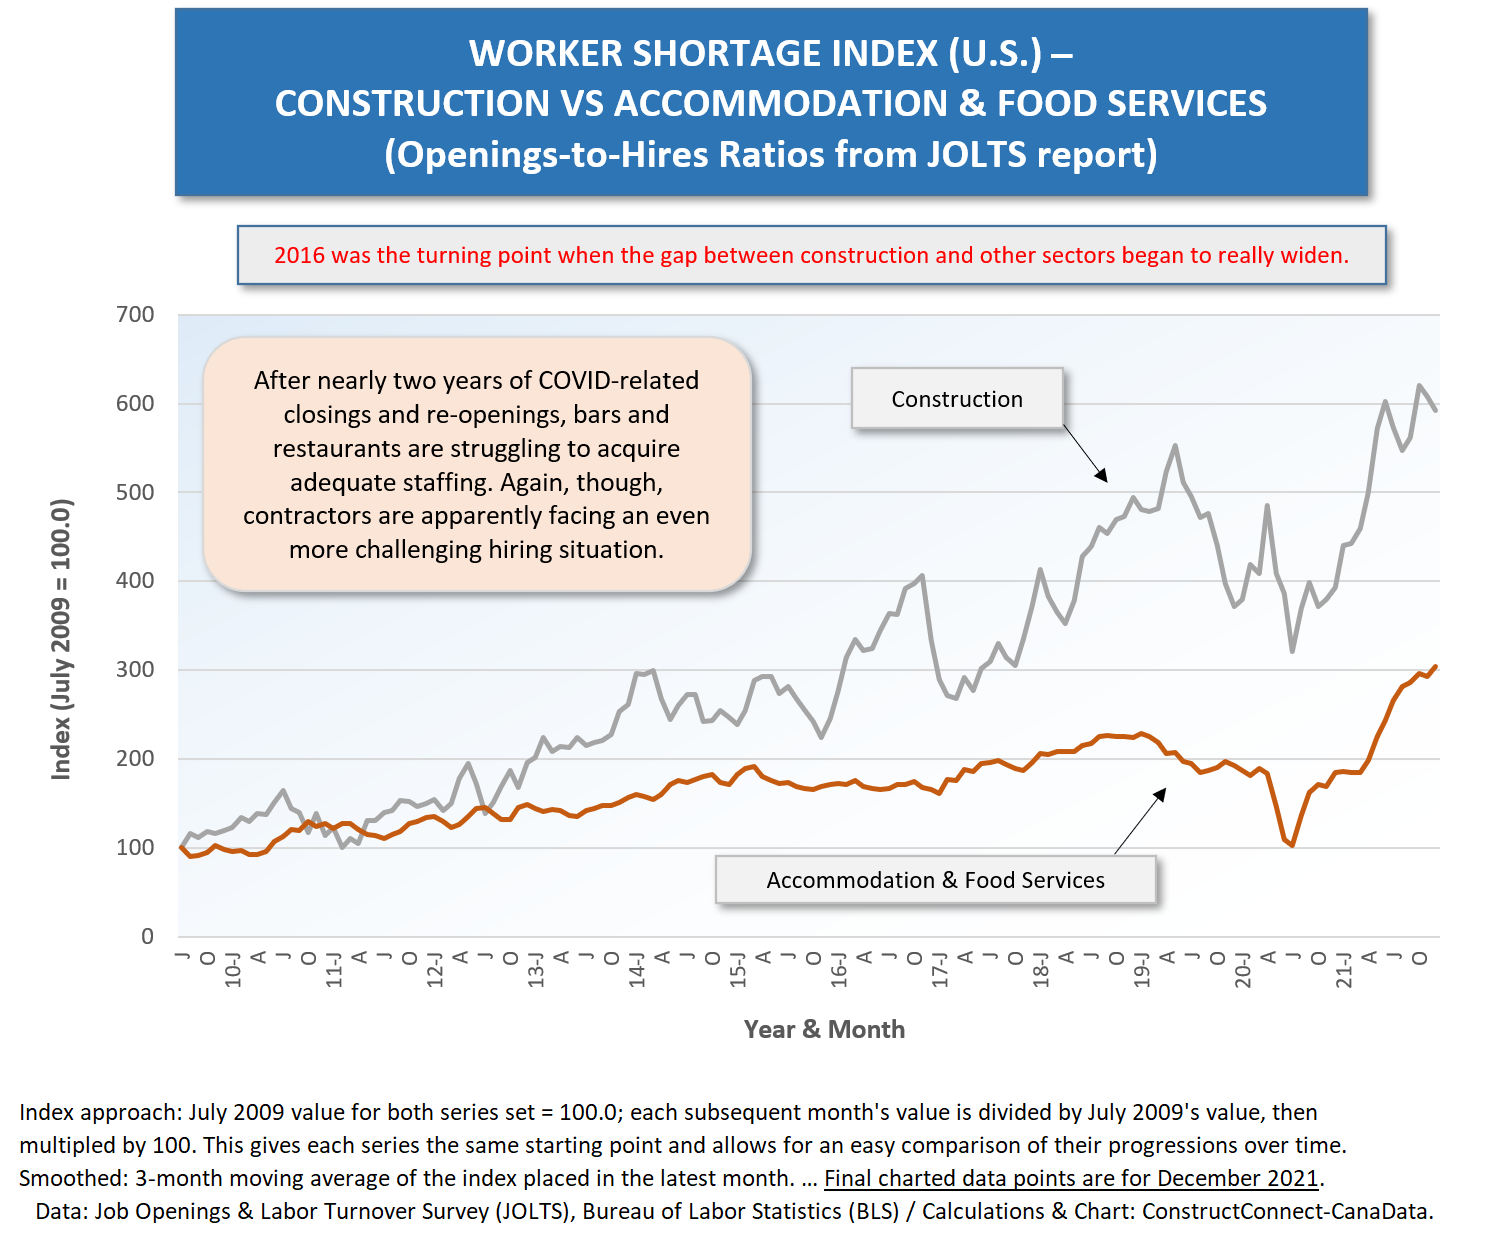
The gaps between construction and the other sectors – ‘manufacturing’, ‘retail trade’, ‘transportation, warehousing and utilities’ and ‘accommodation and food services’ – all began to widen in 2016.
To be fair, it appears the hiring woes of ‘manufacturing’ and ‘transportation, warehousing and utilities’ firms have recently become as jarring as for construction (i.e., equally steep slopes). But they haven’t had the same history of discomfort.
Manufacturers especially spent seven years, between 2012 and 2018, when their monthly openings-to-hires ratios kept almost level, with no change.
The ‘accommodation and food services’ sector also had a long period, from the 2008-2009 recession through 2019, when it was able to draw on a willing pool of workers to provide hospitality to clientele. Only recently have restaurant and bar owners (and patrons) been plagued by a lack of adequate serving help.
Graph 1
Graph 2
Graph 3
Graph 4
![]()
Graph 5
Alex Carrick is Chief Economist for ConstructConnect. He has delivered presentations throughout North America on the U.S., Canadian and world construction outlooks. Mr. Carrick has been with the company since 1985. Links to his numerous articles are featured on Twitter @ConstructConnx, which has 50,000 followers.


Recent Comments
comments for this post are closed