Forecaster Charts & Tables
Employment
Good jobs creation and low unemployment rates are pivotal to GDP growth and construction activity.
U.S. Employment - % Change Y/Y
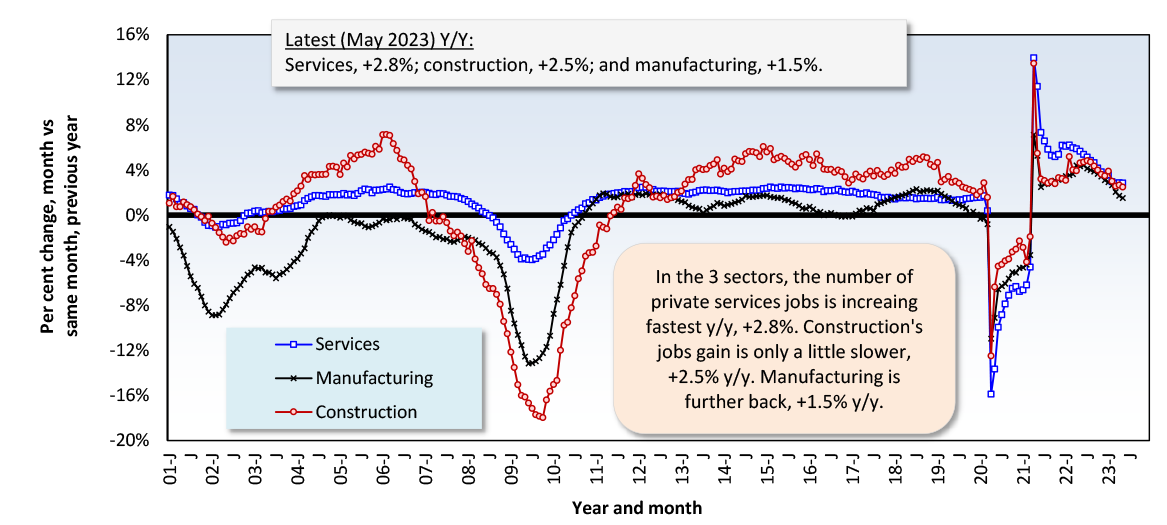
The latest data points are for May, 2023.
Based on seasonally adjusted (SA) data.
Data source: Payroll Survey, Bureau of Labor Statistics (U.S. Department of Labor).
Chart: ConstructConnect – CanaData.
U.S. Initial Jobless Claims Weekly
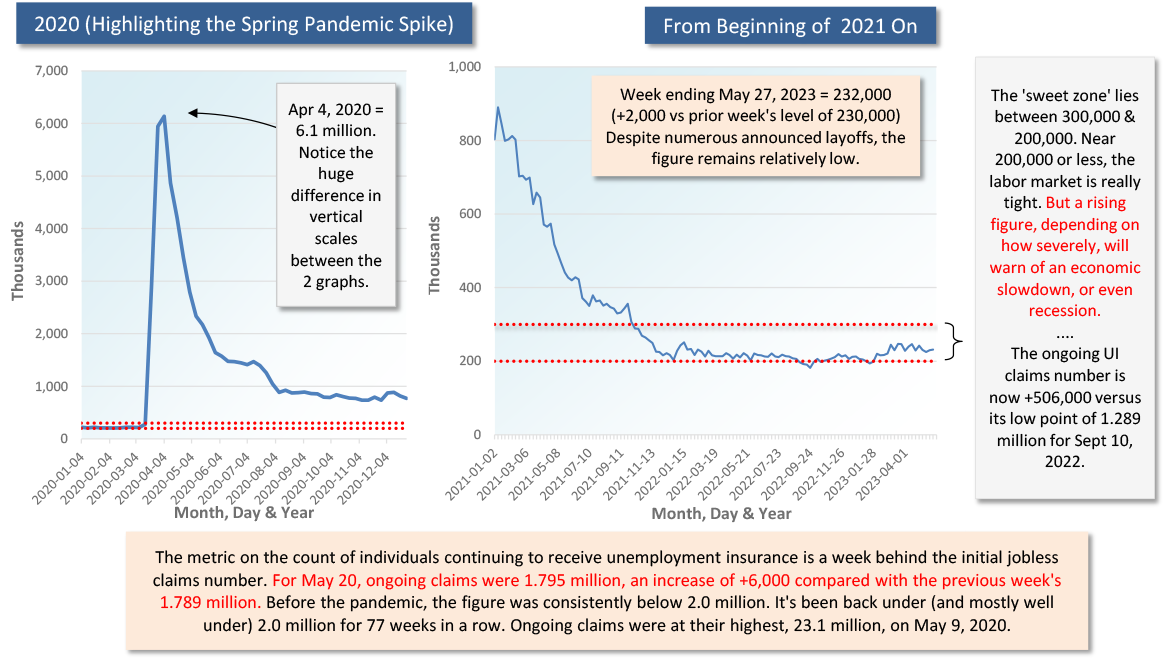
Data source: Department of Labor & Census Bureau / Chart: ConstructConnect-CanaData.
Canadian Provincial Labour Markets
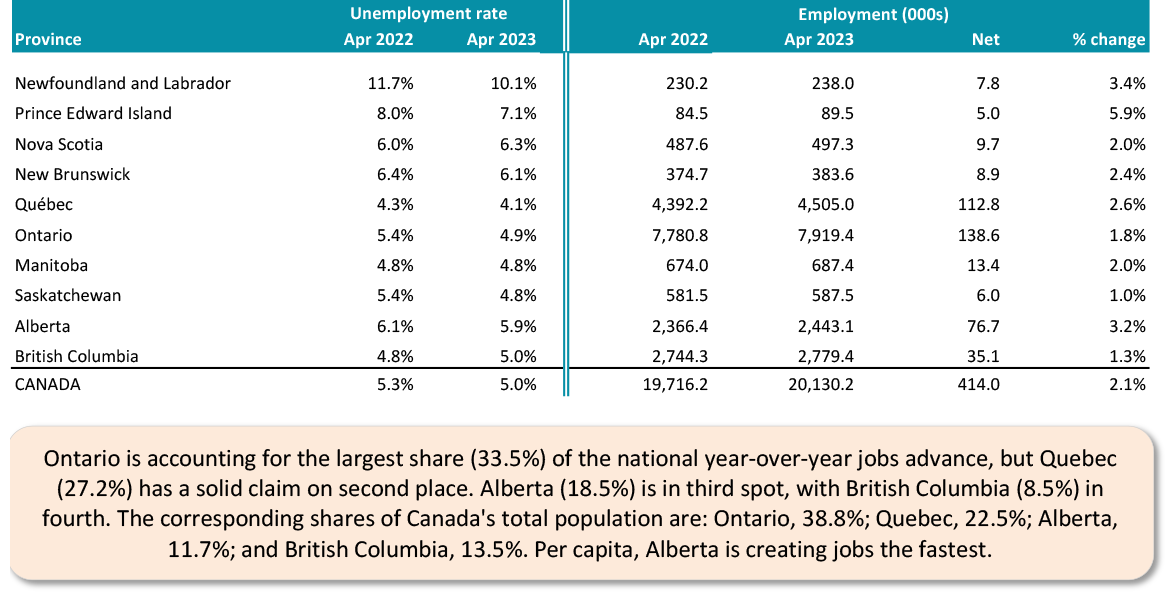
Data source (seasonally adjusted figures): Statistics Canada/Tables: ConstructConnect — CanaData.
Ranking of Canadian Provincial Labour Markets
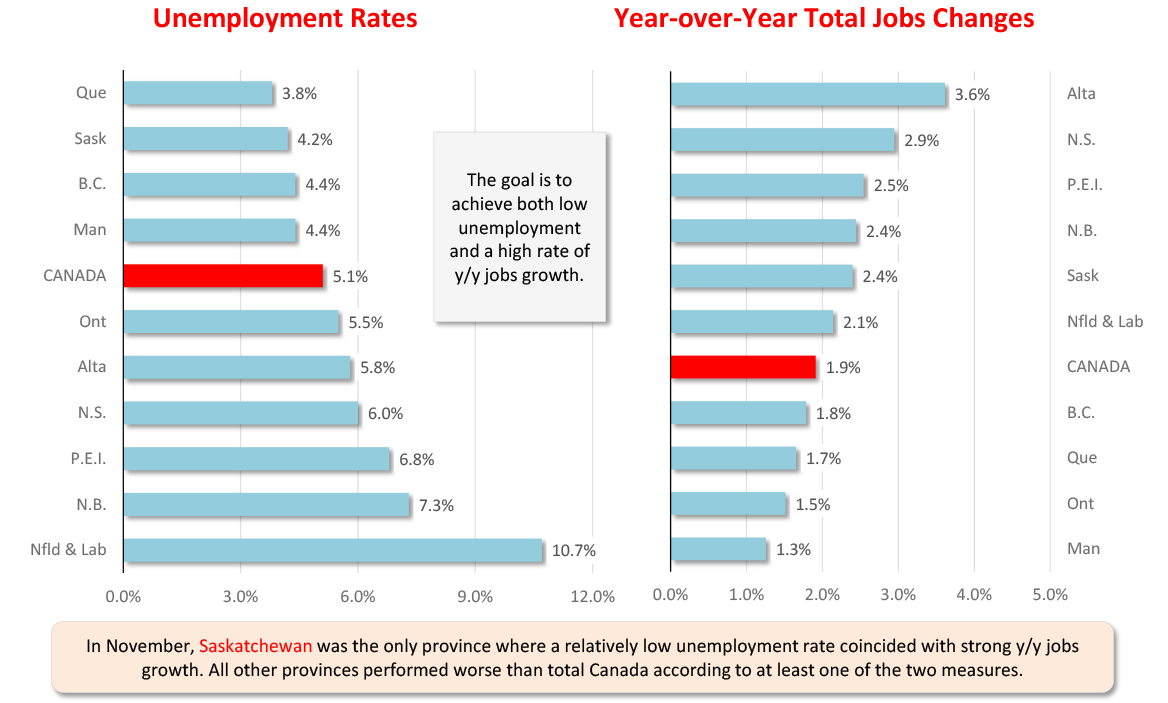
The latest data is for April, 2023.
Data source: Statistics Canada / Chart: ConstructConnect-CanaData.
Canada ‘R-3’ Unemployment Rate vs U.S. Unemployment Rate Not Seasonally Adjusted (NSA) Data (Statistics Canada calculates ‘R-3’ on same basis as U.S. rate)
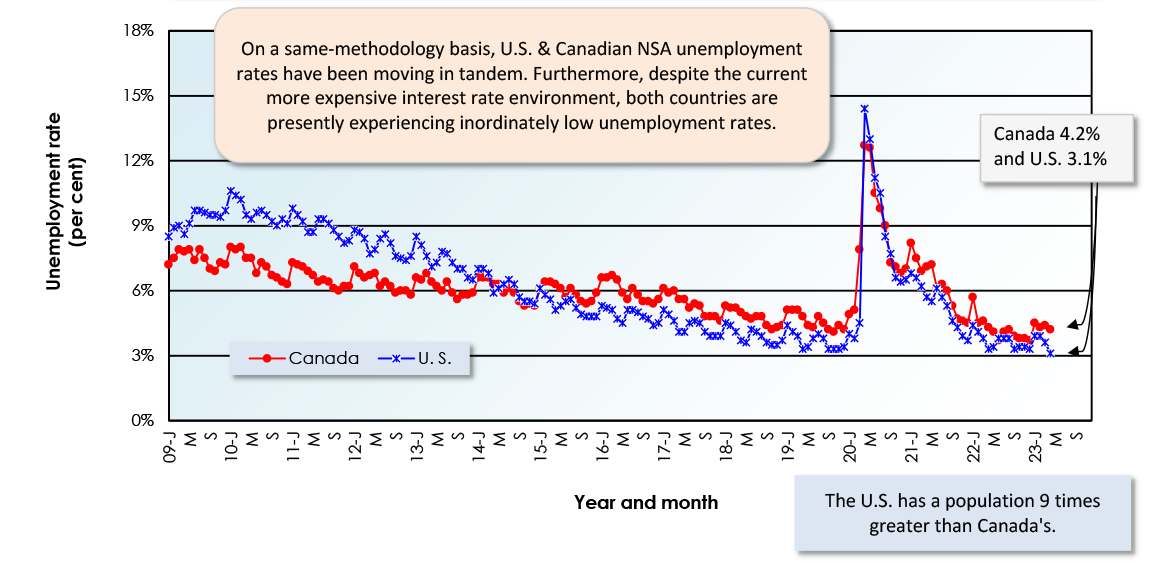
The latest data points are for April, 2023.
Data sources (seasonally adjusted): Statistics Canada and U.S. Bureau of Labor Statistics (Department of Labor).
Chart: ConstructConnect — CanaData.
Canada: Month-to-month Total Jobs Count Change
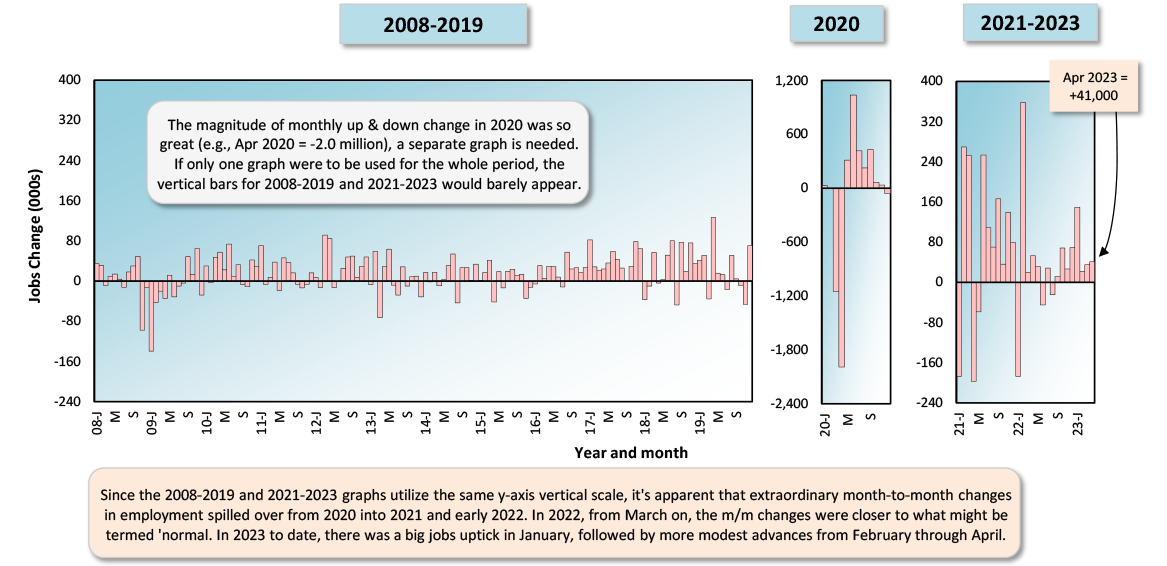
Latest data point is for April 2023.
Source: Household Survey, Statistics Canada / Chart: ConstructConnect – CanaData.
U.S. Month-to-month Total Jobs Count Change
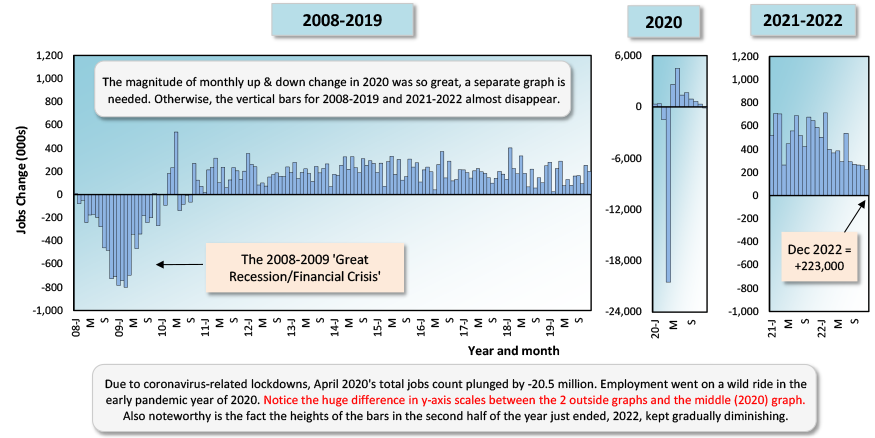
Latest data point is for December 2022.
Source: Payroll Survey, U.S. Bureau of Labor Statistics (BLS) / Chart: ConstructConnect – CanaData.
Canada vs U.S. Monthly Unemployment Rate (Per Cent) Seasonally Adjusted Data
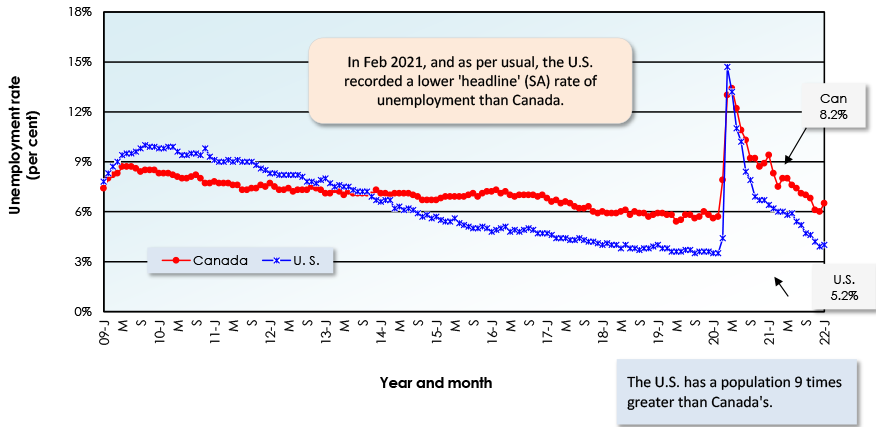
The latest data points are for October, 2022.
Data sources (seasonally adjusted): Statistics Canada and U.S. Bureau of Labor Statistics (Department of Labor).
Chart: ConstructConnect — CanaData.
Best U.S. City Labor Markets
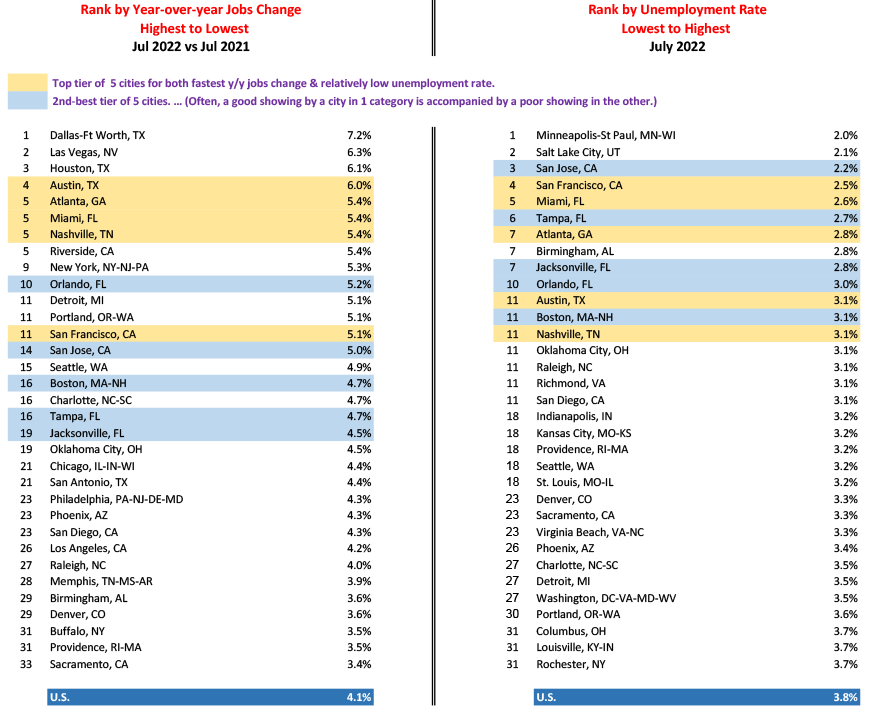
Based on not seasonally adjusted (NSA) data. / Cities are metropolitan statistical areas (MSAs).
When the ranking numbers are the same, the cities are in a tie.
Data source: U.S. Bureau of Labor Statistics (BLS).
Table: ConstructConnect – CanaData.
Labour Markets in 33 Canadian Cities
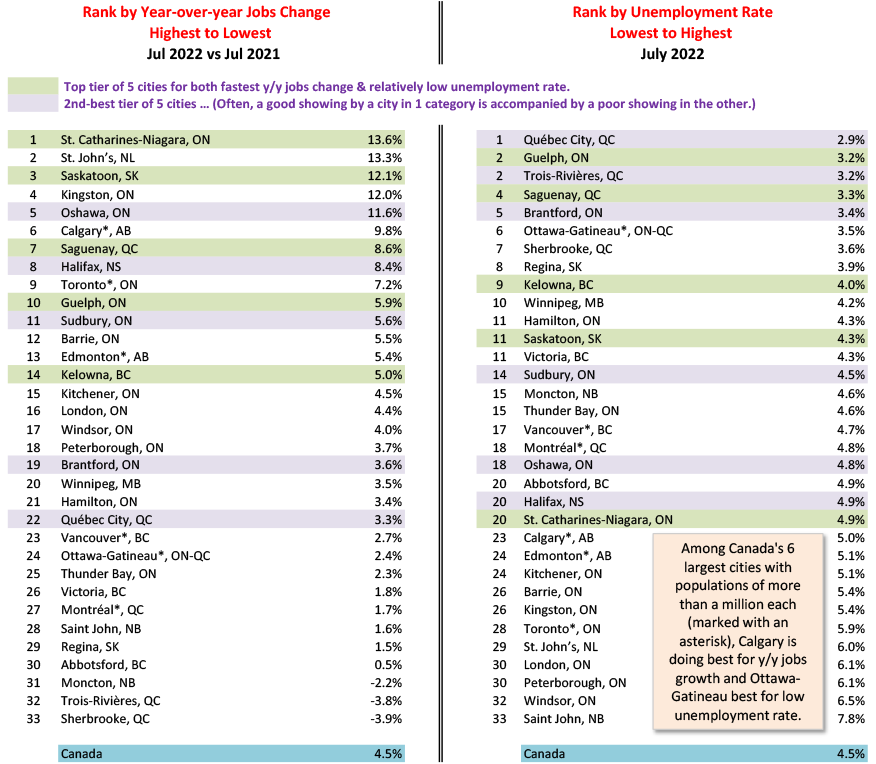
Based on averages of latest three months, seasonally adjusted (SA) data. Cities are census metro areas (CMAs). When the ranking numbers are the same, the cities are in a tie.
Data source: Statistics Canada/Tables: ConstructConnect — CanaData.
Unemployment Rates in Canada's 6 Most Populous Cities
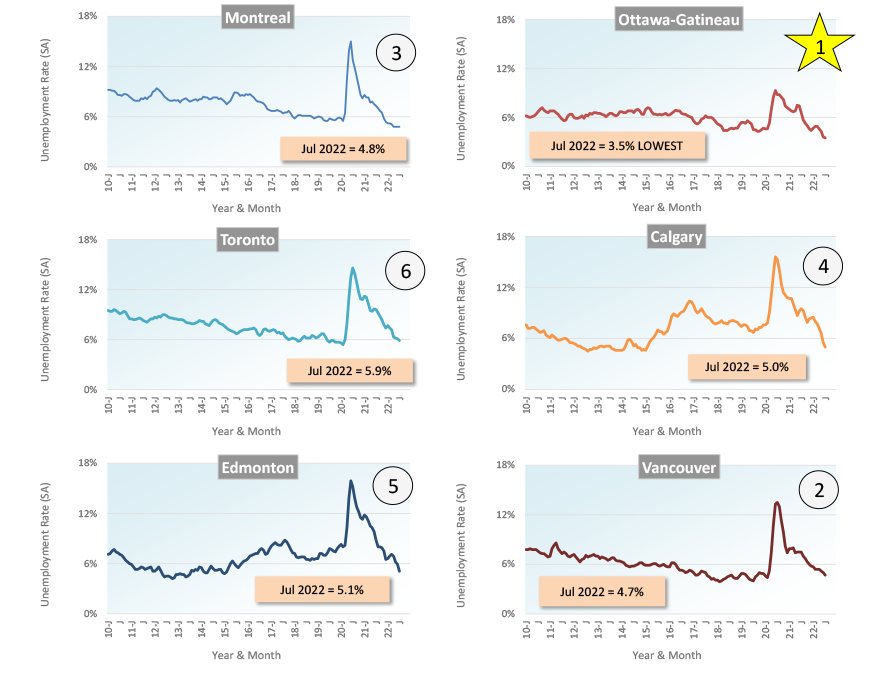
Data source: Statistics Canada (SA = Seasonally Adjusted) / Charts: ConstructConnect-CanaData.
Change in Total Employment — Canada vs U.S.
The latest data points are for March 2021.
*“Year-over-year” is each month versus the same month of the previous year.
Data sources (seasonally adjusted): Statistics Canada and U.S. Bureau of Labor Statistics (Department of Labor).
Chart: ConstructConnect — CanaData.
Change in Construction Employment — Canada vs U.S.
The latest data points are for February 2021.
*“Year-over-year” is each month versus the same month of the previous year.
Data sources (seasonally adjusted): Statistics Canada and U.S. Bureau of Labor Statistics (Department of Labor).
Chart: ConstructConnect — CanaData.
Change in Private Sector vs Public Sector Employment in Canada
The latest data points are for February, 2021.
*“Year-over-year” is each month versus the same month of the previous year.
Data sources (seasonally adjusted): Statistics Canada.
Chart: ConstructConnect — CanaData.
Change in Full-time vs Part-Time Employment in Canada
The latest data points are for February, 2021.
*“Year-over-year” is each month versus the same month of the previous year.
Data sources (seasonally adjusted): Statistics Canada.
Chart: ConstructConnect — CanaData.
Change in Manufacturing Employment — Canada vs U.S.
The last data points are for February, 2021.
“Year-over-year” is the monthly figure versus the same month of the previous year.
Data sources (seasonally adjusted): Statistics Canada and U.S. Bureau of Labor Statistics.
Chart: ConstructConnect — CanaData.
Change in Service Sector Employment — Canada vs U.S.
The latest data points are for February, 2021.
*“Year-over-year” is each month versus the same month of the previous year.
Data sources (seasonally adjusted): Statistics Canada and U.S. Bureau of Labor Statistics (Department of Labor).
Chart: ConstructConnect — CanaData.
Recent Comments