Beginning with a catalogue of woes (which I’ll quickly leave behind), U.S. jobs recovery versus the huge drop in employment from February to April is barely above 50%.

The initial jobless claims number in the latest week went in the opposite direction to what was hoped for; it increased by +137,000 (Graph 1).
And most pertinent of all, coronavirus infections continue to rage across the U.S., negating many of the best-intended plans to re-open the economy.
But hope is on the horizon. Effective vaccines are being rolled out and will ‘blanket’ the population by the Summer. And savings levels have swelled, which will soon fuel purchases in consumer services areas where pent-up demand can’t wait to burst through the doors (e.g., a return to dining out again; going to cinemas and the theater; and the compulsion to travel, for vacations and/or to visit with distant friends and family, plus business trips.)
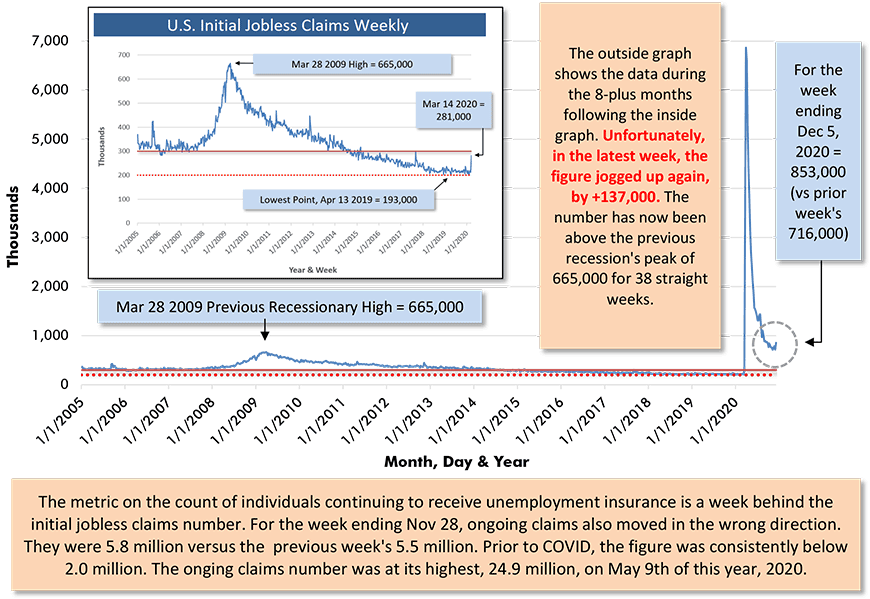
Chart: ConstructConnect.
Against this backdrop, there are the following additional observations to be gleaned from the latest public and private sector data releases.
(1) There are two other labor market numbers that bear watching. From November’s Employment Situation report issued by the Bureau of Labor Statistics (BLS), the number of ‘discouraged workers’ (i.e., they’ve given up trying to find positions) in America in the latest month was 657,000, up +12% from October’s figure of 588,000, and more than double year-ago November’s number of 316,000. Also, the count of individuals now categorized to long-term unemployment status (i.e., they’ve been out of work for 27 weeks or more) has climbed to 3.9 million from 3.6 million in October and only 1.2 million in November 2019. (I promise that from here on, the bullet points in this article will be more balanced, leaning towards a brighter side.)
(2) The not seasonally adjusted (NSA) unemployment rate nationally in America is currently 6.4%. The degree of joblessness, however, displays considerable variation regionally. Currently the metro areas in the U.S. with the lowest unemployment rates are: Salt Lake City, 4.1%; Minneapolis-St. Paul, 4.2%; St. Louis, 4.3%; Kansas City, 4.5%; Atlanta, 4.7%; Columbus and Indianapolis tied at 4.9%; Jacksonville, 5.0%; and Austin and Cincinnati, both 5.1%.
A number of those eleven cities can boast of holding buffers against jobs losses thanks to vibrant high-tech sectors. How are some of the other urban centers often cited as having the closest ties to high-tech activity doing on the unemployment front? Raleigh and Seattle are each presently chalking up an unemployment rate of 5.3%; San Jose is at 6.0%; Dallas-Ft Worth, 6.1%; Denver, 6.5%; Washington (which, as the nation’s capital, also benefits from the jobs stability traditionally found in a ‘government town’), 6.6%; Boston, 6.7%; San Francisco, 7.2%. The reader will notice that only San Francisco has a reading much above the national figure of 6.4%.
There are three cities with unemployment rates in double-digit percentages: Los Angeles, 11.0%; New Orleans, 11.3%; and Las Vegas, 13.8%. Sitting only slightly under the unfortunate 10% benchmark are Memphis and New York, both at 9.7%.
(3) Speaking of the high-tech sector and its corporate leaders, the FAAMG group of companies has managed some impressive equity price gains to date this year, even with the handicap of some deep cratering in share prices that was experienced in February and March. The tumbles downwards in the second and third months of 2020, provoked by worries about the imminent coronavirus contagion, proved to be temporary. As of mid-December, compared with the first trading day of this year, the share price of Facebook is +31%; Amazon, +67%; Apple, +63%; Microsoft, +34%; and Google/Alphabet, +28%. If you think those gains are impressive, wait ‘til you hear the next one. Tesla’s share price has risen by +641% since the beginning of this year.
(4) Nobody (by which I mean economists and other economy-watchers) is particularly worried about inflation anymore. I’m not as sanguine on the subject, but I’ll come to that in a moment. The U.S. all-items Consumer Price Index (CPI) advance in November was a mild +1.2% year over year. The ‘core’ rate of annual increase (i.e., omitting volatile energy and food items) was +1.6%. The ‘energy’ sub-index was -9.4%, with gasoline at -19.3%.
Four of the most dramatic shifts in prices on the downside, year over year in November, were in ‘lodging away from home, including hotels and motels’, -12.7%; ‘women’s dresses’, -13.5%; ‘airline fares’, -17.0%; and ‘men’s suits, sports coats and outerwear’, -21.4%. Two of the biggest price jumps on the upside were in ‘used cars and trucks’, +10.9% and ‘major appliances’, +17.2% (with ‘laundry equipment’ at +13.6%).
(5) Some of the reasons for thinking inflation may not prove to be moribund over the longer term include the following. With China embarking on another massive infrastructure spending program and world trade about to revive, commodities ‒ which are the building blocks of everything ‒ are drawing more attention again. The global price of oil has firmed up a little, to around $45 USD per barrel; softwood lumber doubled in price in early Fall, although it has retreated somewhat since then; and the cost of the iron ore used in steelmaking has risen to its highest level in years.
Plus, there’s the move afoot to reverse globalization. Over the past twenty years, the defining purpose of globalization has been to reduce the costs of goods production and services delivery. Inherent in the shift to deglobalization is a willingness to put up with more expensive inputs and processes to secure supply lines under all circumstances. Deglobalization implies a shifting dynamic between workers and employers in labor negotiations. Employees in industrialized nations have become accustomed to knowing that if they make ‘waves’, their jobs may be outsourced. Deglobalization, ‘Buy America’ policies and labor-friendlier initiatives to be introduced by the incoming administration in Washington will restore some of labor’s lost empowerment.
(6) Many of my colleagues in the economy-monitoring fraternity are counting on the ‘savings rate’ to turbo charge the economies of the U.S. and Canada when the pandemic loosens its grip. What’s all the excitement about? The answer appears in Graphs 2 and 3. In Q2 of this year, the savings rate in the U.S. soared to an all-time high of 26.0%. In Q3, it fell back, but remained exaggerated at 16.1%. Canada’s savings rate shot up to 27.5% in Q2, then descended about halfway to 14.6% in Q3.
The ‘savings rate’, as a math expression, is a residual. Simplified, it’s incomes minus taxes (a calculation which yields ‘disposable income’), also minus expenditures, as a percentage of ‘disposable income’. It’s easy to understand the increase in the savings rate due to people ‘sheltering at home’ and spending less on commuting, dry cleaning, entertainment and so on. But an extra-big boost to the ‘savings rate’ has come from governments issuing unemployment relief funds and other support payments in excess of the drop in ‘disposable incomes.’ (Gross incomes have fallen but so have taxes.)
There’s a belief that the topping-up of savings, including cash simply held in bank accounts, will light a fire under consumer services spending once everyone feels confident to go out into the world again. The vast amount of debt taken on by government is seen as concerning, but it’s generally conceded that there are sickness and recessionary crises to be overcome first.
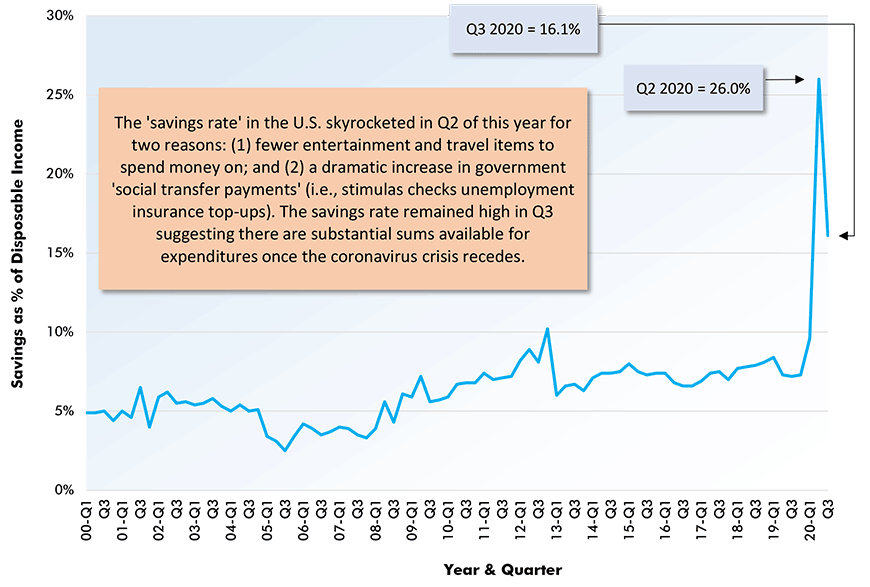
Chart: ConstructConnect.
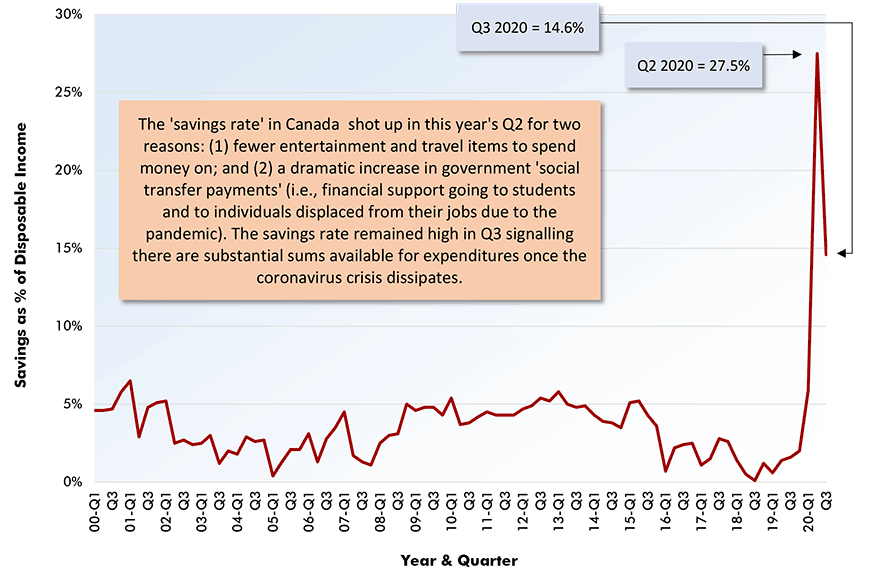
Chart: ConstructConnect.
Graph 4: U.S. Unemployment: Headline Rate & Broadest Measure (U-6)
(Seasonally adjusted – SA)
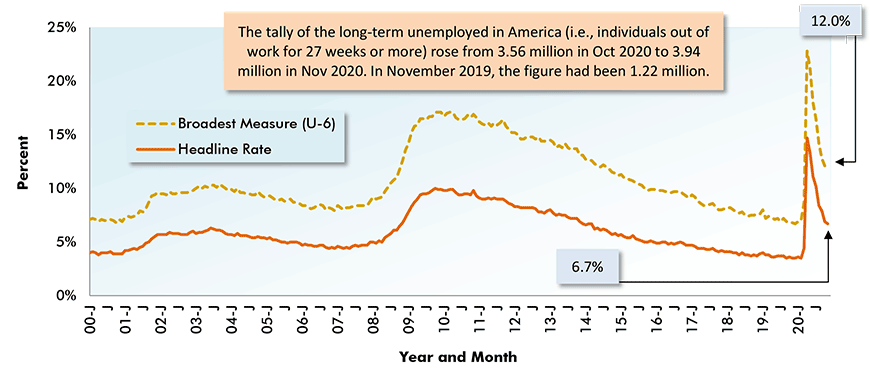
"U-6 is total unemployed, plus all persons marginally attached to the labor force, plus total employed part time for economic reasons, as a percent of the civilian labor force, plus all persons marginally attached to the labor force."
Chart: ConstructConnect.
Graph 5: Y/Y Jobs Change, U.S. Total Industry & Major Subsectors − November 2020 (based on seasonally adjusted payroll data)
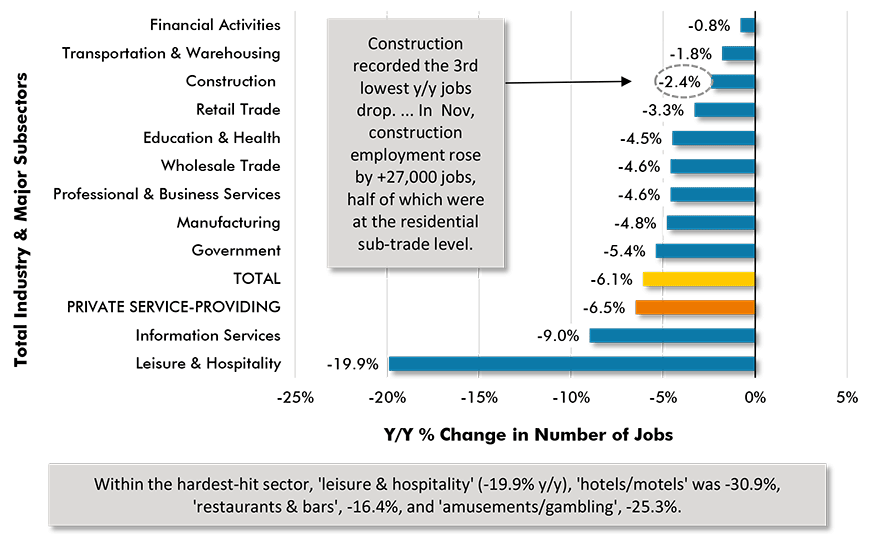
Chart: ConstructConnect.
Graph 6: U.S. Manufacturing vs Construction Employment
November 2020 ‒ Seasonally Adjusted (SA) Payroll Data
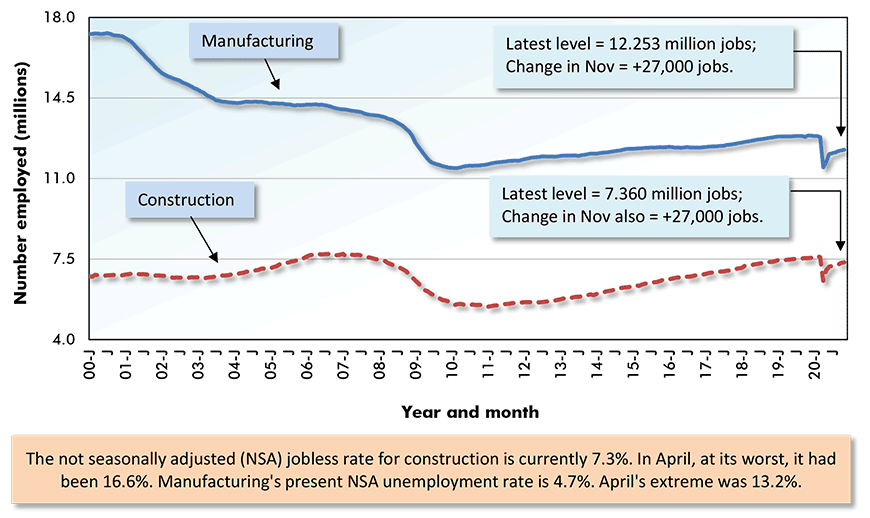
Chart: ConstructConnect.
Graph 7: Canadian Provincial Labour Markets – November 2020
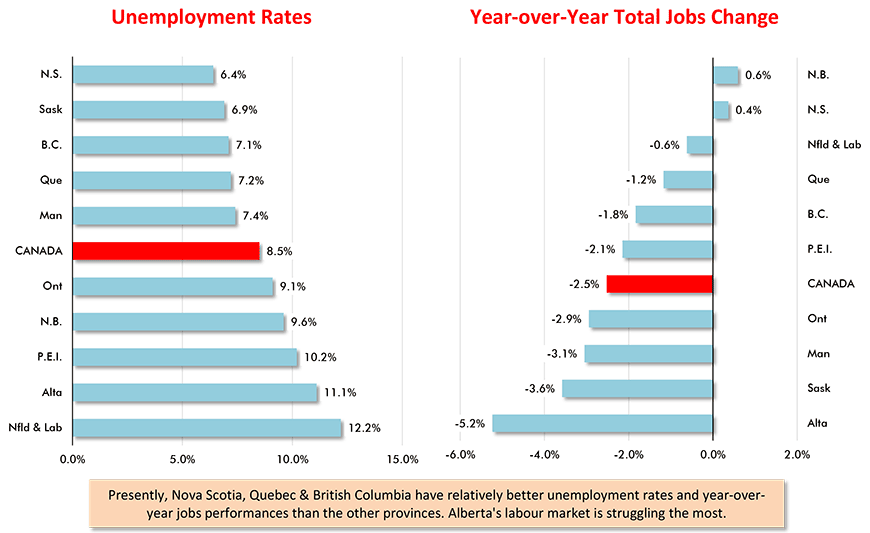
Chart: ConstructConnect.
Alex Carrick is Chief Economist for ConstructConnect. He has delivered presentations throughout North America on the U.S., Canadian and world construction outlooks. Mr. Carrick has been with the company since 1985. Links to his numerous articles are featured on Twitter @ConstructConnx, which has 50,000 followers.


Recent Comments