
U.S. Housing Starts Up by a Fifth
U.S. housing starts, as an average of the seasonally adjusted and annualized (SAAR) monthly figures to date in 2021, have been ahead by almost a fifth (+18.5%) compared with the same January-to-September period of 2020.

Versus the first three quarters of 2019, they’ve been even more elevated, +26.8%, or up by a quarter.
In the latest individual month, though, U.S. residential groundbreakings of 251,000 units were +7.4% year over year, but -1.6% month to month.
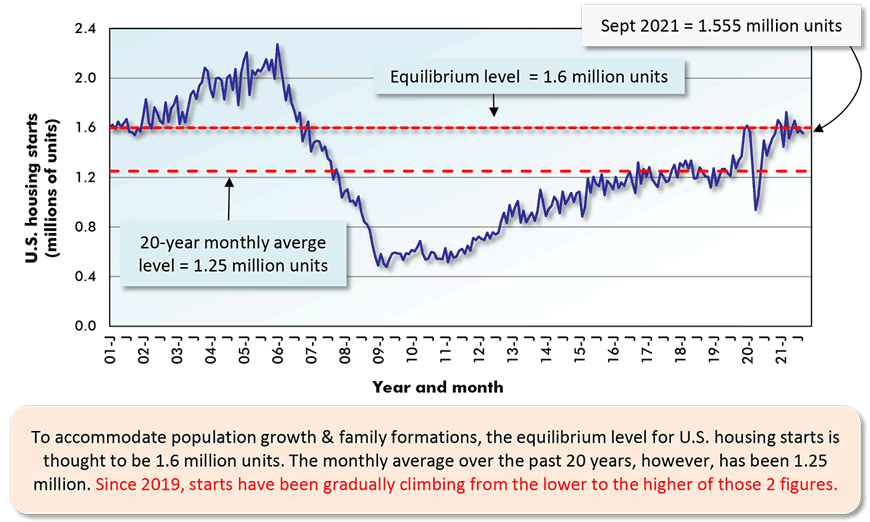
Graph 1 makes clear that while monthly U.S. homebuilding starts have been relatively strong throughout this year so far, they have also flattened. The level of starts has shown little variability from month to month, most often resting just under 1.6 million units.
Furthermore, from Graph 6, ‘permits’ appear to have peaked at the beginning of 2021 and have tailed off since, although still remaining high. ‘Permits’ are a leading indicator, by a couple of months, for ‘starts’.
The pickup in demand for new homes over the past year, and in the face of the pandemic, has been driven by ultra-low mortgage and other interest rates and by a surge in savings that has enabled the attainment of down payment targets. Lockdowns leading to fewer spending outlets have led to the savings spike.
Also, the pronounced shift to working from home has fueled a demand for more comfortable surroundings. And many individuals and families have decided to exit crowded and potentially less healthy city cores for the suburbs or more pastoral settings. Millennials, as they were partnering up and dreaming of children, plus acquiring their first serious jobs, were beginning to do this anyway before the coronavirus crisis hit.
Among the three major types of construction, residential has arisen, of late, to be the mainstay of total activity. Engineering work has been about on an even keel, but non-residential building has sunk significantly. Non-res is where the declines in counts of office, retail and hotel/motel projects have been centered.
A key question for contractors concerns when the baton will be handed over from residential to nonresidential building work. Presently, the most likely scenario would place the timing approximately in the middle of next year.
Also warranting mention is that the current mini-boom in U.S. homebuilding is partly to make up for a severely fallow patch between 2009 and 2015. Economists and analysts will say there’s been a need to satisfy pent-up demand.
Long-term, however, the demand for housing in any country depends on population growth and the tendency towards new family formations.
The days of the U.S. having strong population growth, which now rides mostly on immigration vastly exceeding emigration, rather than births minus deaths, are almost certainly in the past. By the way, the number of births in the U.S. has plummeted, but maybe those millennial families talked about above can begin to turn that around.
Canadian Housing Starts Up by a Third
Canadian housing starts, as an average of the seasonally adjusted and annualized (SAAR) monthly figures to date in 2021, have advanced by a third (+33.3%) compared with the same January-to-September period of 2020. Versus the first three quarters of 2019, they’ve been up to a similar degree, +34.2%.
In the individual month of September 2021, however, Canadian housing starts were +20.1% year over year, but -4.4% month to month. The monthly units number peaked at an all-time high in February of this year, 333,000. April dropped to 275,000 and May bounced back a bit to 285,000. Since then, however, the monthly number has been gradually diminishing from month to month.
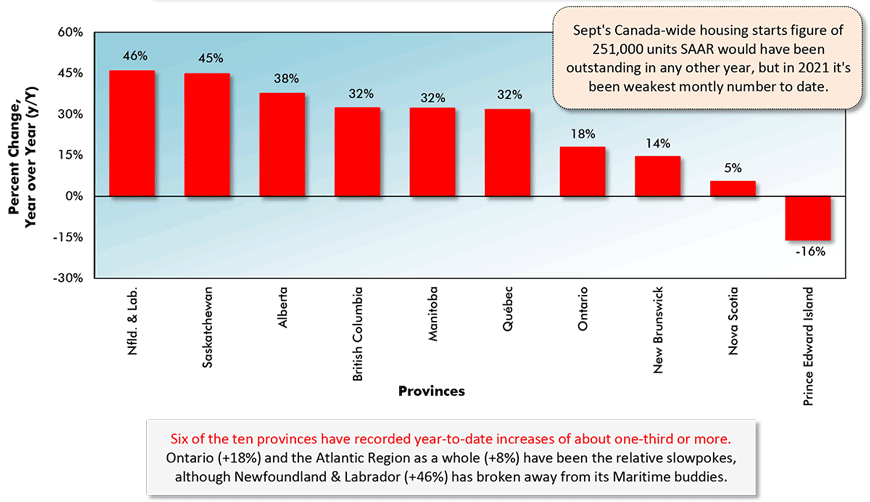
September’s 251,000 units was the lowest monthly number so far in 2021. Just the same, in almost any other year, it would have stood out as being either the best or second-best monthly result. Prior to 2021, the peak monthly figure for Canadian housing starts was 277,000 units in September 2007.
In both the United States and Canada, the new housing market strength is being reflected in other market areas as well. For example, in the U.S., electronic equipment and appliance retail sales, much of it destined for home use, were +17.2% year over year in September. Furniture and home furnishing retail sales in the latest month were +13.4% y/y in the U.S. and +14.1% in Canada.
The market strength has also become apparent in prices. The ‘furniture’ sub-index of the U.S. consumer price index is currently +13.7% y/y. In Canada, the y/y furniture price gain is +12.0%.
The price for laundry equipment in the U.S. is +19.1% y/y. The price for fridges and freezers in Canada is +11.3% y/y. The opportunities inherent in the demand-supply imbalances underway must be catching the attention of manufacturers.
Graph 1: U.S. Total Monthly Housing Starts
Seasonally Adjusted at Annual Rates (SAAR)
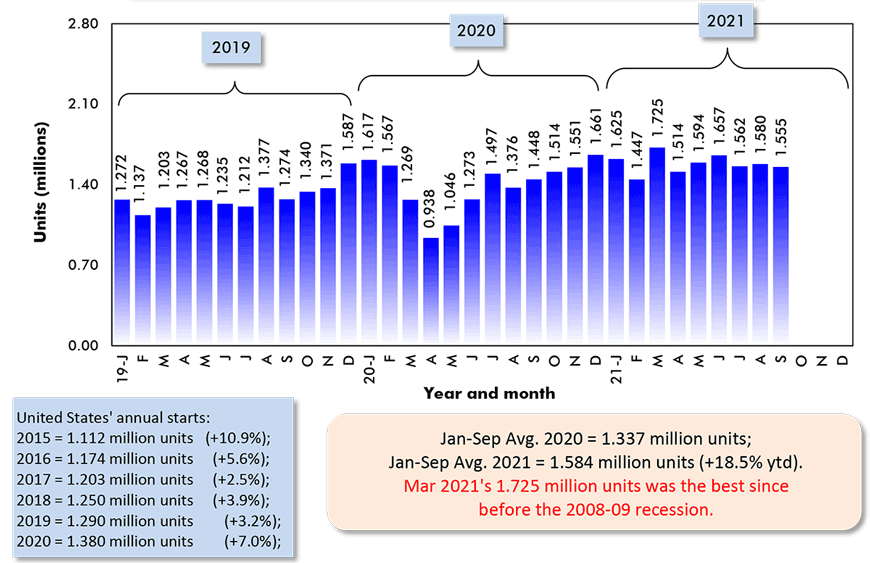
The last data points are for September 2021.
Data source: U.S. Census Bureau (Department of Commerce).
Chart: ConstructConnect.
Graph 2: Canada Monthly Housing Starts
Seasonally Adjusted at Annual Rates (SAAR)
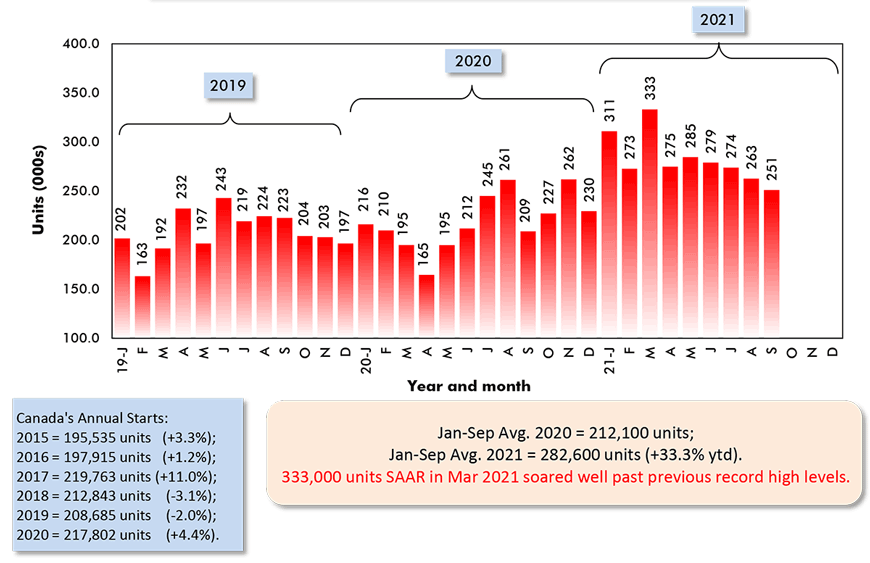
Data source: Canada Mortgage and Housing Corporation (CMHC).
Chart: ConstructConnect.
Graph 3: U.S. and Canada Monthly Housing Starts
Seasonally Adjusted at Annual Rates (SAAR)
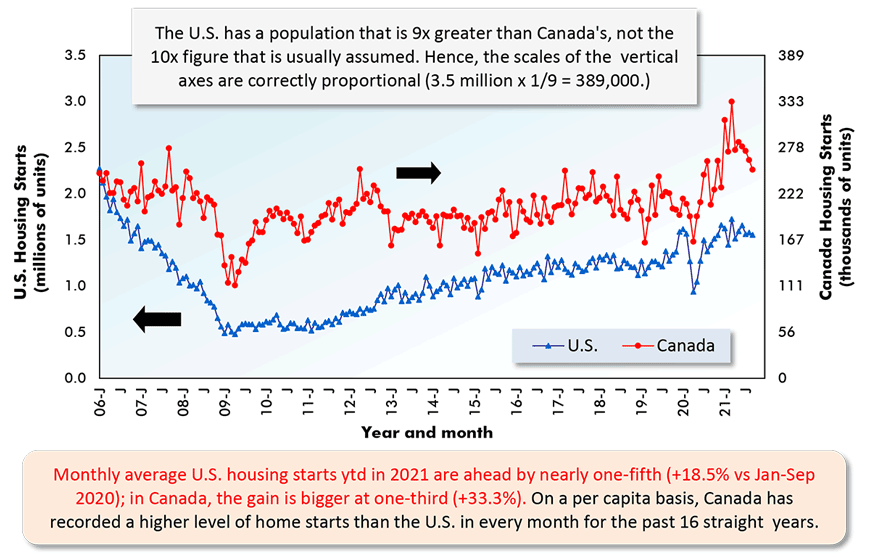
The last data points are for September 2021.
ARROWS: U.S. numbers to be read from left axis; Canadian from right axis.
Data sources: U.S. Census Bureau & Canada Mortgage and Housing Corp (CMHC).
Chart: ConstructConnect.
Graph 4: U.S. Single-Family & Multi-Family Monthly Housing Starts
Seasonally Adjusted at Annual Rates (SAAR)
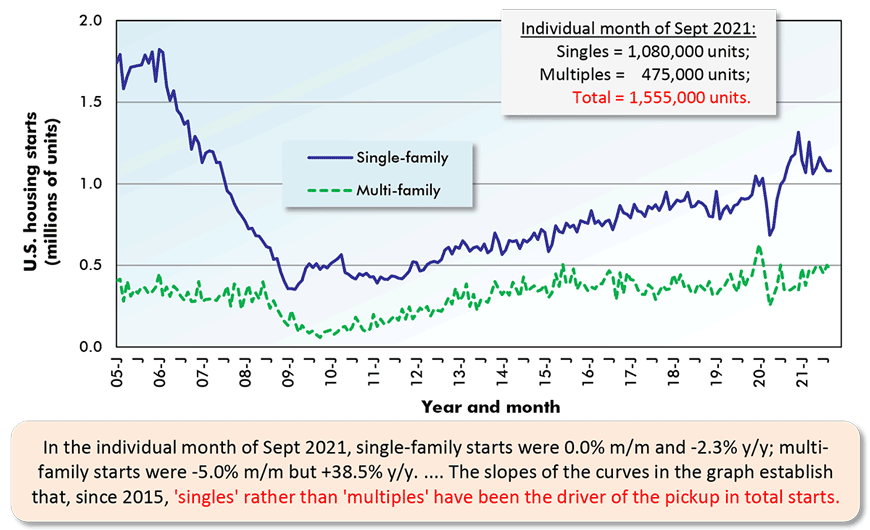
The last data points are for September 2021.
Data source: U.S. Census Bureau (Department of Commerce).
Chart: ConstructConnect.
Graph 5: U.S. Total Monthly Housing Starts
Seasonally Adjusted at Annual Rates (SAAR)
The last data point is for September 2021.
Data source: U.S. Census Bureau (Department of Commerce).
Chart: ConstructConnect.
Graph 6: U.S. Monthly Residential Building Permits
Seasonally Adjusted at Annual Rates (SAAR)
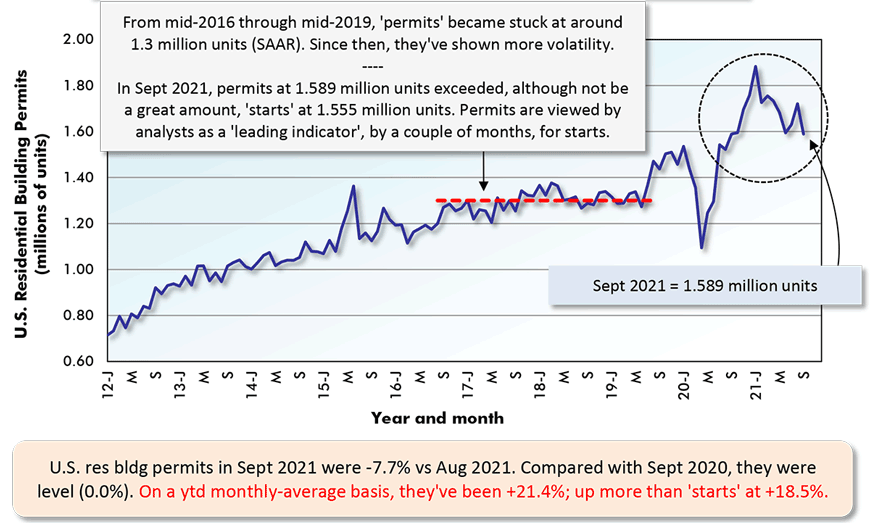
The last data point is for September 2021.
Data source: U.S. Census Bureau (Department of Commerce).
Chart: ConstructConnect.
Graph 7: U.S. Housing Starts
Jan-Sept 2021 vs Jan-Sept 2020 % Changes
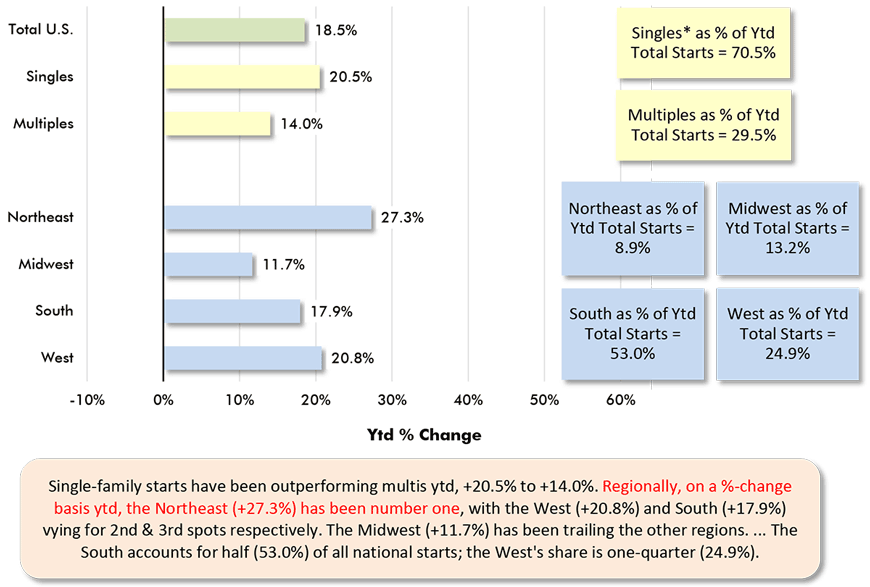
Based on averages of monthly seasonally adjusted and annualized (SAAR) unit starts.
* ‘Singles’ includes townhouse complexes, except when multiple units have common heating & air conditioning.
Data source: U.S. Census Bureau.
Chart: ConstructConnect.
Graph 8: Percent Change in Year-To-Date Housing Starts –
Ranking Of Canada’s Provinces
(Jan-Sept 2021 vs Jan-Sept 2020)
Data source: Canada Mortgage & Housing Corporation (CMHC) based on actuals rather than seasonally adjusted data.
Chart: ConstructConnect.
Graph 9: Percent Change in Year-To-Date Housing Starts –
Ranking Of Canada’s Major Cities
(Jan-Sept 2021 vs Jan-Sept 2020)
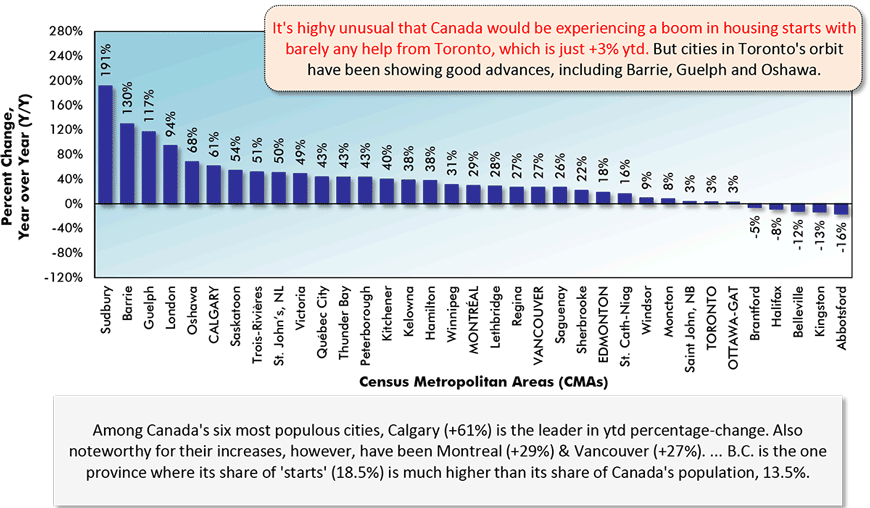
Canada’s Census Metropolitan Areas (CMAs) have core populations of 50,000 plus.
Canada’s 6 CMAs with populations in excess of 1 million are in capital letters.
Data source: Canada Mortgage & Housing Corporation (CMHC) based on actuals rather than seasonally adjusted data.
Chart: ConstructConnect.
Graph 10: Housing Starts in Canada’s 6 Most Populous Cities
January to September 2021 Actuals
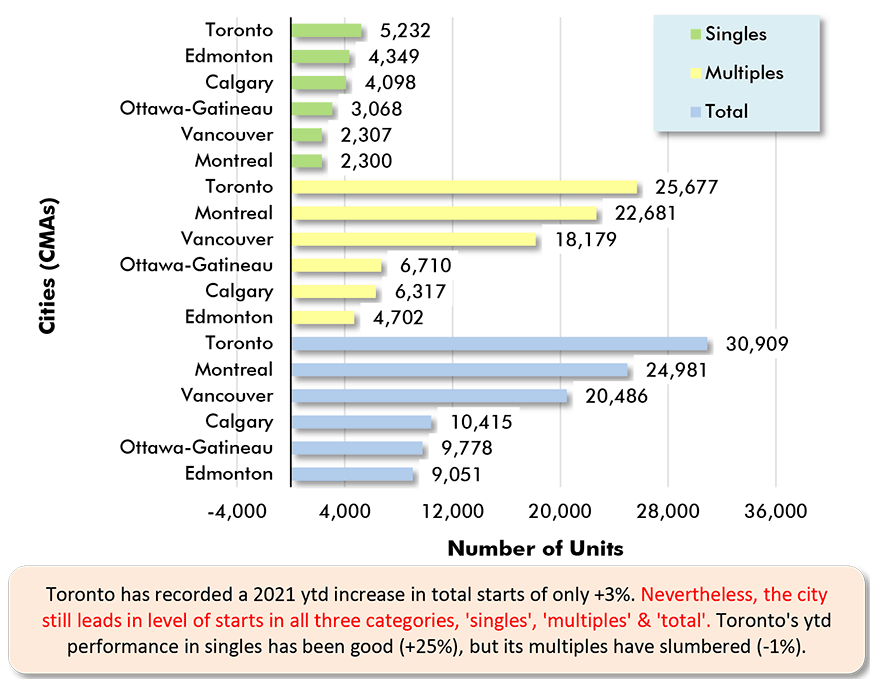
Data source: Canada Mortgage & Housing Corporation (CMHC).
Chart: ConstructConnect.
Graph 11: Housing Starts in Canada’s 6 Most Populous Cities
Jan-Sept 2021 vs Jan-Sept 2020
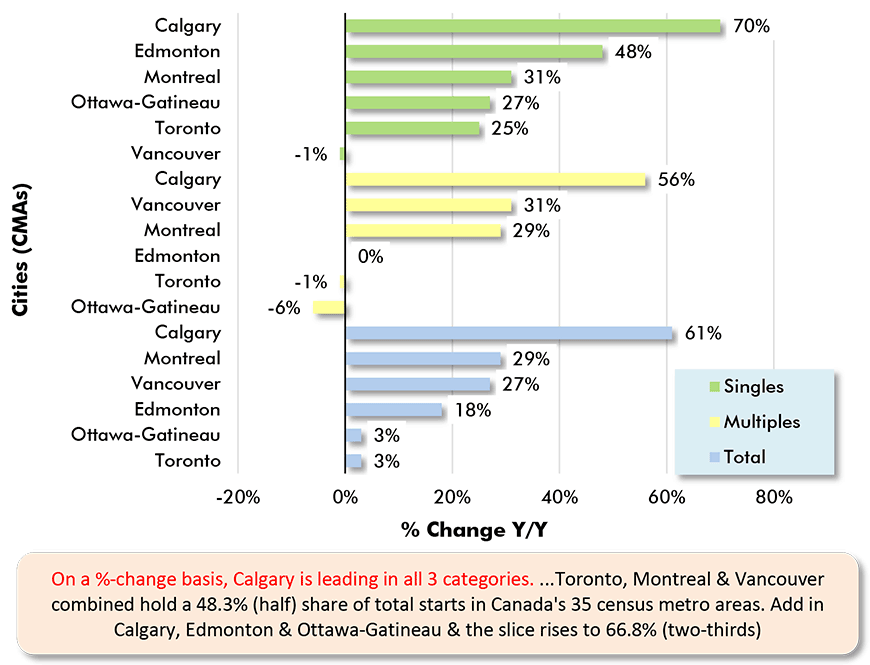
Data source: Canada Mortgage & Housing Corporation (CMHC).
Chart: ConstructConnect.
Alex Carrick is Chief Economist for ConstructConnect. He has delivered presentations throughout North America on the U.S., Canadian and world construction outlooks. Mr. Carrick has been with the company since 1985. Links to his numerous articles are featured on Twitter @ConstructConnx, which has 50,000 followers.


Recent Comments