
Looming largest as an indicator of how well the U.S. economy can perform in the short run is the coronavirus case count. The number of new COVID-19 infections is now averaging 250,000 per day. Deaths have recently been exceeding 4,000 per day, with a cumulative mortality figure since March of 2020 that will soon surpass 400,000.

If there are any doubts about the toll this is taking on business conditions, consider weekly initial jobless claims. They dropped below a million in late August of last year and appeared to be settling in around 750,000. For the latest week, though, ending January 9, 2021, they shot back up again by +181,000, to reach a level of 965,000.
The number of individuals collecting ongoing unemployment insurance also increased in the latest period, to 5.3 million from 5.1 million at the end of last year. (Prior to COVID, the unemployed insurance recipient count was consistently below 2.0 million.)
Also, there are new variants of the virus that are more transmissible. Effective vaccines are available, but the speed of the inoculation process has been disappointing.
Against this backdrop, there are the following ‘nuggets’ to be gleaned from the latest public and private sector data releases and pronouncements.
(1) President-Elect Joe Biden has just issued details of the stimulus measures he intends to present to Congress. His American Rescue Plan includes a further $1,400 going to most U.S. citizens (based on a not-too-stringent ‘means’ test) beyond the $600 already approved in December; $400 per week in UI benefits to last through September of this year; an extension of the eviction and foreclosure moratorium to also be in place through the end of September; and significant financial support for schools, virus testing and child day-care (i.e., a greater tax write-off for expenses).
(2) The proposals outlined in (1) above won’t be the end of the matter. A further phase of economic relief commitments is planned for February. The second wave will deal with infrastructure upgrades necessitated, in part, by climate change and with student debt relief. A well-considered and firm infrastructure spending package is something the construction industry has been looking forward to for years.
(3) While the overall economy shed -140,000 jobs in December, according to the Bureau of Labor Statistics (BLS), the construction sector added +51,000 positions. Total employment in the U.S. is currently -6.2% year over year, but the number of jobs in construction is only -1.9% y/y.
(4) Relative strength in its labor market is helping support employment in some other corners of the economy with close ties to construction. Notably, the number of jobs with ‘building material and supplies dealers’ is +8.3% y/y. ‘Oil and gas extraction’ jobs are +3.7% y/y. Energy projects are traditionally a big source of construction activity and it’s good news that the price of crude has recovered over $50 USD per barrel. ‘Real estate’ sector employment is down, but by only -1.5% y/y. Staffing at ‘architectural and engineering services’ firms is also off, but to only a minor degree, -1.0% y/y. Cement and concrete products manufacturers have reduced payrolls by -2.3% y/y. Taking the most severe action, ‘machinery and equipment rental and leasing’ firms have tamped down their jobs count to the tune of -12.6% y/y.
(5) The construction ‘bid price’ index published by the BLS among its Producer Price Index (PPI) series has been restrained lately, just +1.2% year over year. Within the ‘bid price’ index, however, there have been some dramatic material cost shifts. ‘Softwood lumber’ in December 2020 was +52.2% more expensive year over year. In September 2020, it peaked at +81.2% y/y. ‘Copper wire and cable’ is presently +11.2% y/y. ‘Gypsum products’ are +4.0% y/y. Exhibiting only minor increases are: ‘hot rolled steel bars, plates and structural shapes’, +1.4% y/y; ‘cement’, +1.9%; and ‘ready-mix concrete’, also +1.9%. Currently recording negative year-over-year changes are ‘aluminum sheet and strip’, -5.7%, and ‘asphalt,’ -13.4%.
(6) A +8.4% month to month jump in the seasonally adjusted (SA) price of gasoline caused the U.S. ‘All Items’ Consumer Price Index (CPI) to step up by +0.4% m/m in December 2020. The days of bargain-priced petrol may be slipping away. On a year-over-year basis, U.S. inflation stayed low in the latest month, at +1.4%. The price of food, though, was +3.9% y/y. The price of gasoline y/y was still down, -15.2%. Some other consumer goods categories still suffering through sharp y/y price drops include airline fares, -18.4%, and the cost of hotel and motel rooms, -11.2% (no surprise, given the ‘stay at home advisories’ in effect everywhere). Moving markedly in the opposite direction have been ‘major appliances’, +16.4% y/y, and ‘used cars and trucks’, +10.0%. Also, add peanut butter to the ‘price skyrocketing’ column, +11.2%.
(7) North of the border, Statistics Canada is taking a novel approach to reporting inflation results. It’s publishing both an ‘official’ and an ‘adjusted’ rate. The former is based on the old standard make-up of the CPI. The latter takes into account an alteration in the weighting of the ‘basket of goods’ consumers are purchasing during the pandemic – specifically, they’re buying more food and less clothing. Statistics Canada’s ‘official’ all-items CPI was +1.0% y/y in December; its ‘adjusted’ CPI was +1.4%.
(8) The American Institute of Architects (AIA) surveys eight ‘forecasting houses’ for their U.S. nonresidential put-in-place capital spending projections. AIA then calculates and publishes the consensus (i.e., average) results. For 2021/2020 and 2022/2021, the AIA’s findings, expressed as a consensus, are as follows: ‘total nonresidential’, -5.7% and +3.1%; ‘commercial’, -7.1% and +3.1%; ‘industrial’, -4.5% and +1.5%; and ‘institutional’, -4.0% and +3.2%. ConstructConnect is one of the eight survey participants and its PIP forecast contributions are: ‘total nonresidential’, -5.0% and 0.0%; ‘commercial’, -6.4% and -0.5%; ‘industrial’, -3.3% and +2.4%; and ‘institutional’, -4.3% and -0.4%. At the time of the survey, in late Fall 2020, ConstructConnect was taking a quite cautious stance towards not just 2021, but 2022 as well.
(9) The U.S. manufacturing sector, going forward, will benefit from several factors: the new USMCA trade agreement reached with Mexico and Canada (offering more protection for the domestic auto industry); the ‘Buy America’ platform to be implemented by the coming Democratic administration in Washington; and an expected shift, although who knows to what extent, towards deglobalization.
(10) Enthusiasm concerning plant expansions should be kept in check, however, until manufacturers experience further climbs in their capacity utilization rates. According to the Federal Reserve, improving activity levels have lifted the capacity utilization rate in manufacturing from around 70% in Summer 2020 to 73% by year’s end. But the figure must increase into the mid-80% range before there will be a widespread need for industrial footprint expansions.
(11) The U.S. foreign trade deficit in November 2020 (the latest month for which data is available) was -$817 billion annualized (i.e., the monthly figure multiplied by 12). The big trade deficit was comprised of a ‘services’ surplus amounting to +$218 billion and a shockingly large ‘goods’ deficit coming to -$1.035 trillion. Running such an enormous ‘current account’ shortfall can cause problems for the ‘capital account’. Money leaving the country in goods and services trade must be counterbalanced by foreigners investing in U.S. bonds and other financial instruments. Or the currency will fall. Or interest rates may need to be raised.
(12) With a +0.5% month-to-month pickup in exports and a -0.3% decline in imports, Canada’s merchandise trade balance in November improved to -$40.8 billion CAD from -$44.7 billion in October. More than a decade ago, before the 2008-09 recession, Canada used to always be able to count on a large trade surplus that would contribute positively to the nation’s gross domestic product (GDP) bottom line. Those days are becoming an increasingly distant memory.
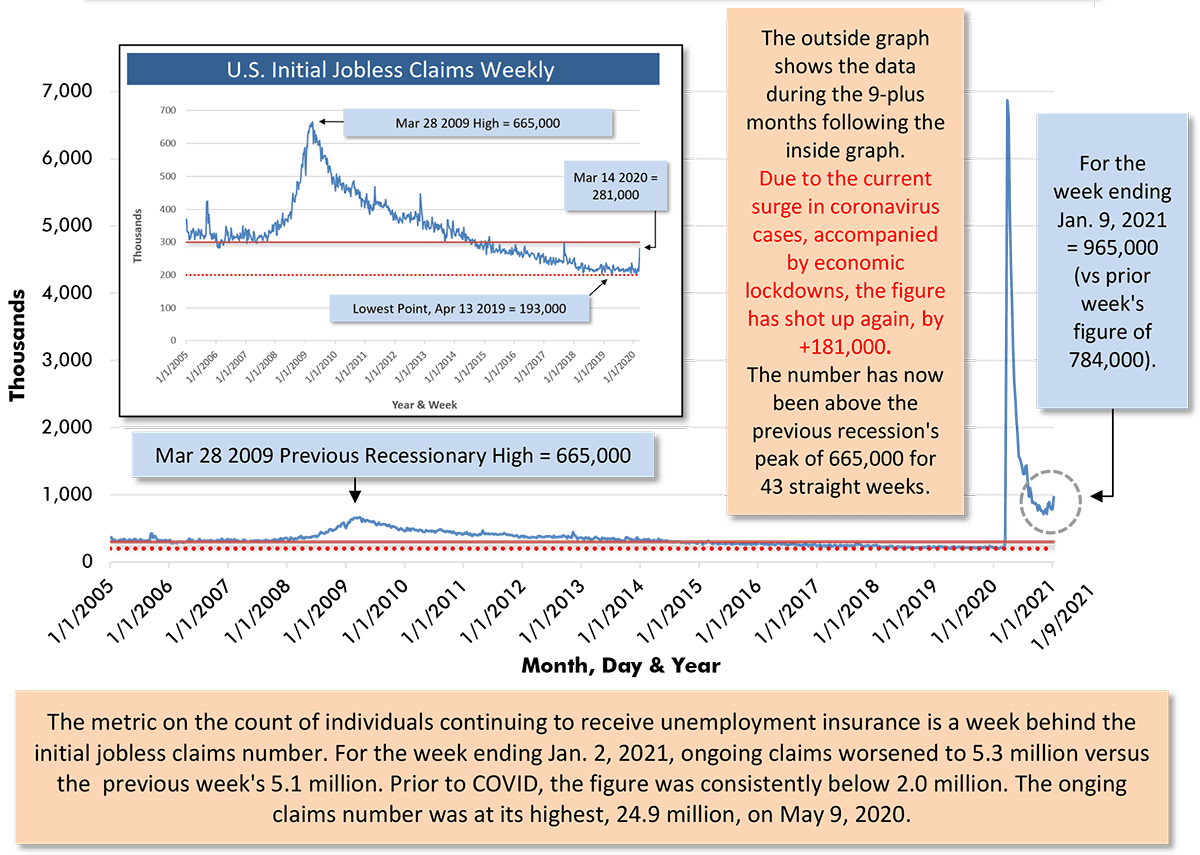
Chart: ConstructConnect.
Alex Carrick is Chief Economist for ConstructConnect. He has delivered presentations throughout North America on the U.S., Canadian and world construction outlooks. Mr. Carrick has been with the company since 1985. Links to his numerous articles are featured on Twitter @ConstructConnx, which has 50,000 followers.


Recent Comments