
Housing starts in the U.S. and Canada plunged during the several months of late winter and early spring of last year, when the coronavirus arrived in North America as an almost entirely unknown but frightening force. At the time, employment suffered a huge hit and there was an expectation by most analysts that new homebuilding activity would be suspended for a long spell.

Such dire speculation prove to be unfounded, however, partly thanks to some of the advances in high-tech that are always being talked about.
In-person home visits slammed to a stop, but real estate sales scampered to the Internet. Viewing properties remotely was a trend already underway, but it received an accelerated boost, and the usual give and take of contract negotiations switched seamlessly to digital means.
Once 2020’s summer season was underway, monthly housing starts (seasonally adjusted and annualized/SAAR) returned to normal levels and, in some months through to the end of the year, tested upper bounds.
2020 U.S. total starts (in units), as an average of the monthly SAAR figures, were +7.9% compared with 2019. Canadian total starts were +5.1%.
By the end of 2020, U.S. single-family groundbreakings were firmly in the ascendancy. They finished the year +12.3% relative to 2019.
Multiple-unit starts, though, were fading. Compared with their nation-wide level in 2019, U.S. ‘multis’ in 2020 were -1.9%.
In the latest figures presented by Canada Mortgage and Housing Corporation (CMHC), single-family starts in Canada’s 35 most populous urban areas were +8% in 2020 while multiples were +3%.
Graph 1: U.S. Monthly Housing Starts
Seasonally Adjusted at Annual Rates (SAAR)
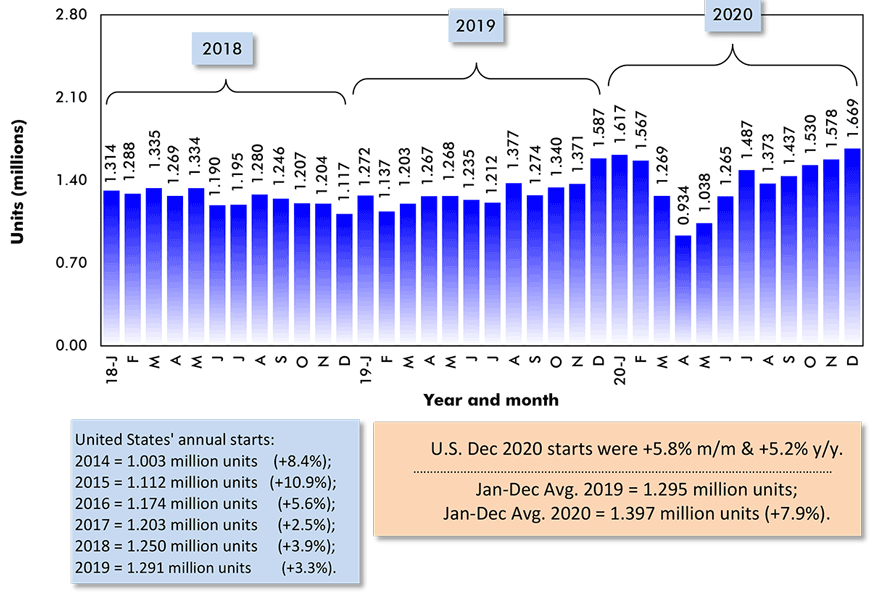
Data source: U.S. Census Bureau (Department of Commerce).
Chart: ConstructConnect.
Graph 2: Canada Monthly Housing Starts
Seasonally Adjusted at Annual Rates (SAAR)
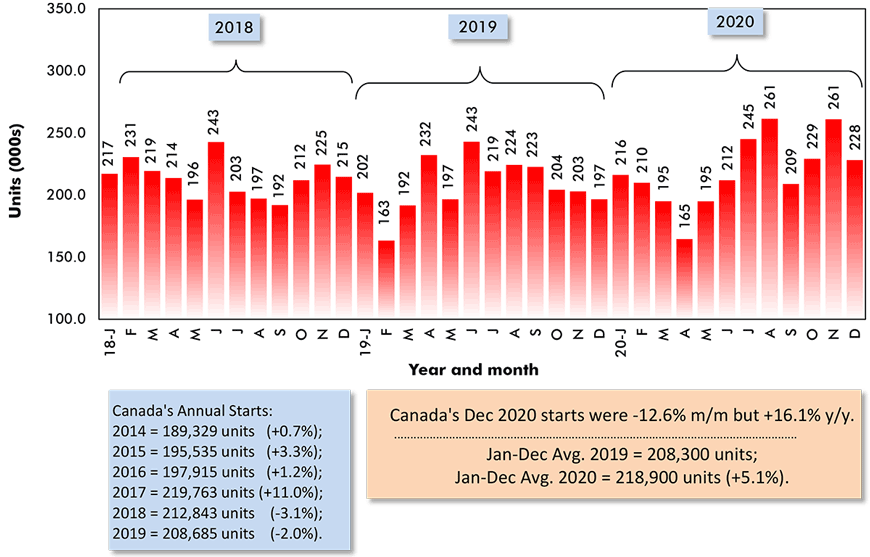
Data source: Canada Mortgage and Housing Corporation (CMHC).
Chart: ConstructConnect.
Graph 3: U.S. and Canada Monthly Housing Starts
Seasonally Adjusted at Annual Rates (SAAR)
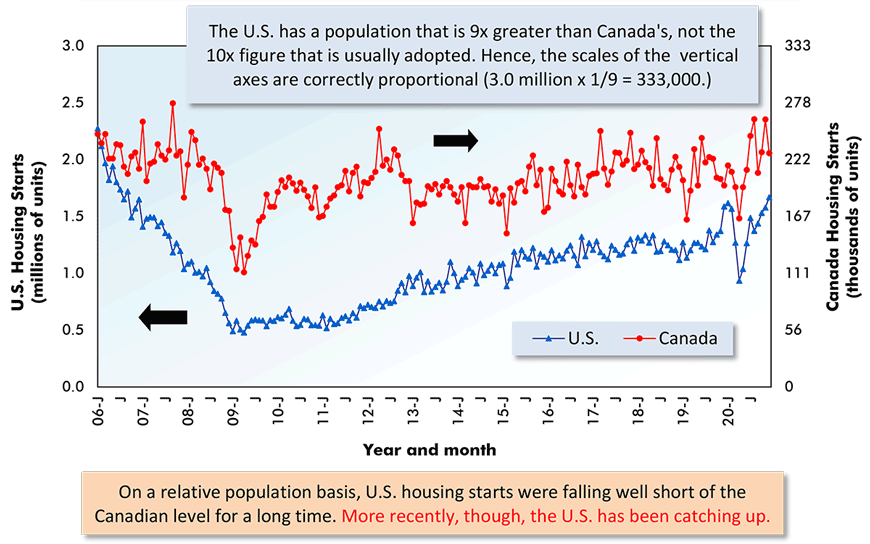
The last data points are for December 2020.
ARROWS: U.S. numbers to be read from left axis; Canadian from right axis.
Data sources: U.S. Census Bureau & Canada Mortgage and Housing Corp (CMHC).
Chart: ConstructConnect.
Pent-up Demand and the Torrid Pace of Permits
The figure usually quoted on the annual ‘starts’ level needed to keep everyone in America housed adequately, given population growth and new family formations, is 1.6 million units. That 1.6 million number, however, has been a distant dream during almost the entirety of the past decade-plus.
The conclusion being drawn by many housing market observers is that an enormous amount of pent-up demand for housing has been accumulating since the prior recession.
Graph 4 shines a spotlight on the pent-up demand issue. The deep ‘well’ in housing starts in 2008-2009 was probably the flip side of the extraordinary strength from 2003-2005.
Sluggish starts from 2010 on certainly indicate an inadequate level of new construction activity, but there may be some dispute as to what is the relevant figure to be held up for comparison.
Average annual housing starts in the U.S. since the year 2000 have been not 1.6 million units, but rather 1.25 million units.
Is 1.25 million units the more realistic number, especially given that population growth in the nation has slowed from +0.65% per year to +0.35% in the latest annual period, July 1, 2019 to July 1, 2020?
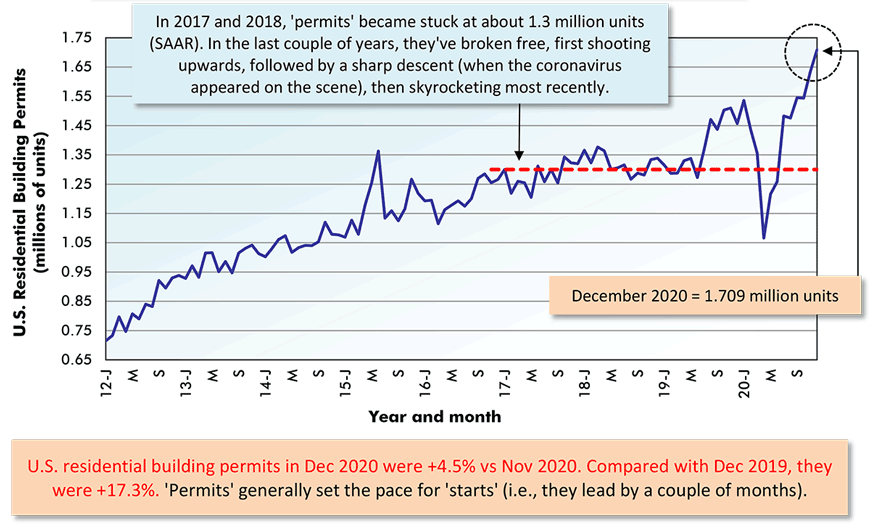
Residential building permits are a leading indicator for foundation laying and they’re apparently leaning towards the higher number.
Permits, as appearing in Graph 5, have recently set a torrid pace, climbing to 1.7 million units in December, 2020.
Graph 4: U.S. Total Monthly Housing Starts
Seasonally Adjusted at Annual Rates (SAAR)
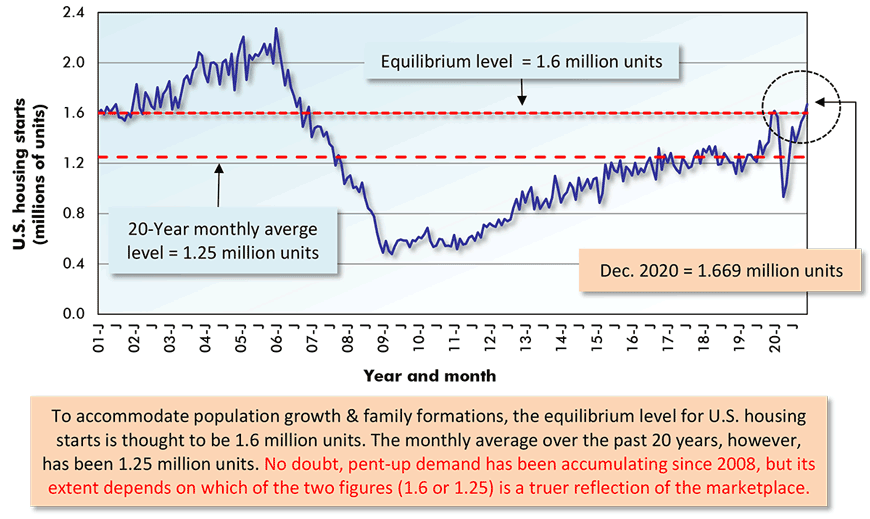
The last data points are for December 2020.
Data source: U.S. Census Bureau (Department of Commerce).
Chart: ConstructConnect.
Graph 5: U.S. Monthly Residential Building Permits
Seasonally Adjusted at Annual Rates (SAAR)
The last data point is for December 2020.
Data source: U.S. Census Bureau (Department of Commerce).
Chart: ConstructConnect.
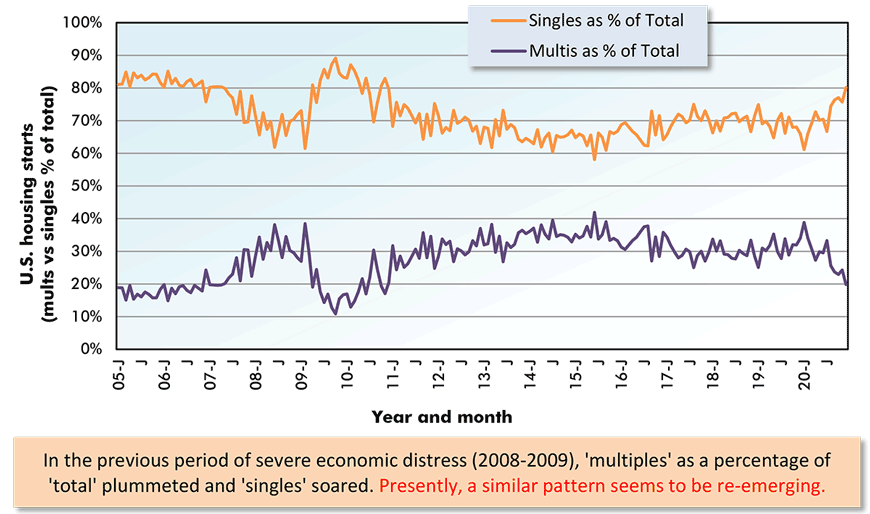
A Shift in the Balance of Demand: Towards Singles & Away from Multiples
The pandemic is causing a shift in the balance of housing demand away from multi-unit to single-family properties.
High-rise urban dwellers are looking to escape crowded city cores in favor of more pleasant countryside living.
Making suburban or rural living more pleasant or ‘bucolic’ at this time are two other descriptive words that come to mind, ‘healthier’ and ‘cheaper’.
And don’t forget that with working from home becoming more acceptable, and often necessary, there’s the reduction in commuting time to relish. Plus, housing with more square footage facilitates the setting up of ‘fireside’ or tucked away in the ‘extra bedroom’ offices.
Adding to the rising vacancy rate problem for apartment and condominium structures has been the reduction in the U.S. residency count of temporary foreign workers and young adults coming to study from abroad, who traditionally lean heavily towards renting.
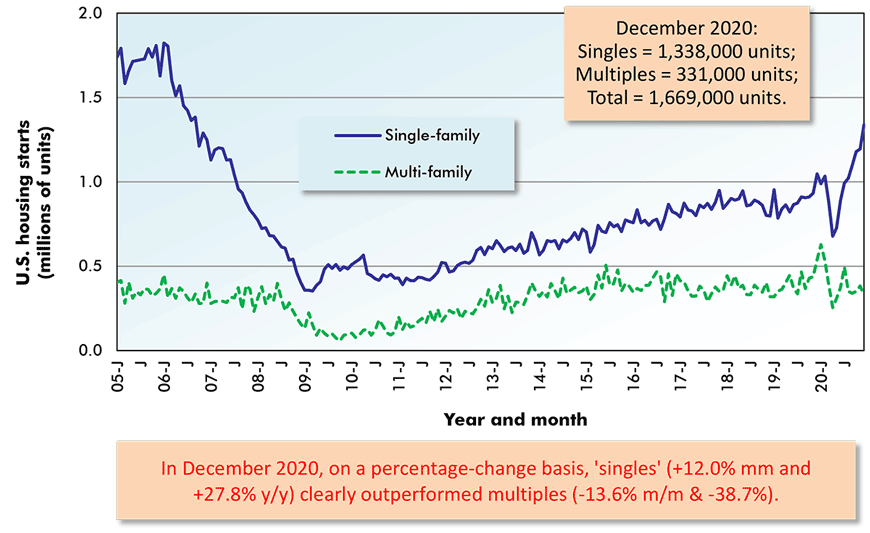
Graph 6 shows U.S. single-family starts surging since last Summer, while multi-family starts have been hanging back.
On an average of monthly SAARS statistics basis, single-family starts in the U.S. in 2020 were +12.3% versus 2019, while multi-family starts were -1.9%.
Graph 6: U.S. Single-Family & Multi-Family Monthly Housing Starts
Seasonally Adjusted at Annual Rates (SAAR)
The last data points are for December 2020.
Data source: U.S. Census Bureau (Department of Commerce).
Chart: ConstructConnect.
Graph 7: U.S. Single-Family & Multi-Family Monthly Housing Starts
Seasonally Adjusted at Annual Rates (SAAR) – Shares of Total
The last data points are for December 2020.
Data source: U.S. Census Bureau (Department of Commerce).
Chart: ConstructConnect.
Pacific Coastline Cities Struggle with Starts
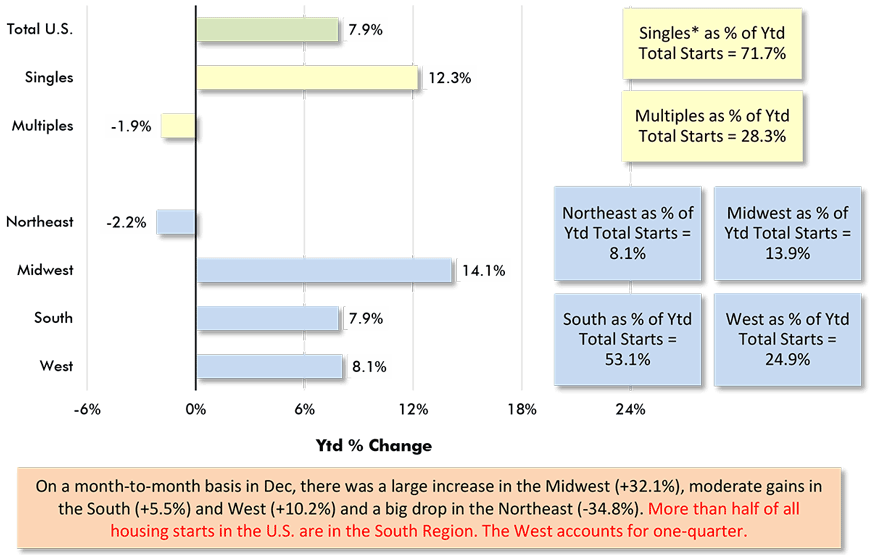
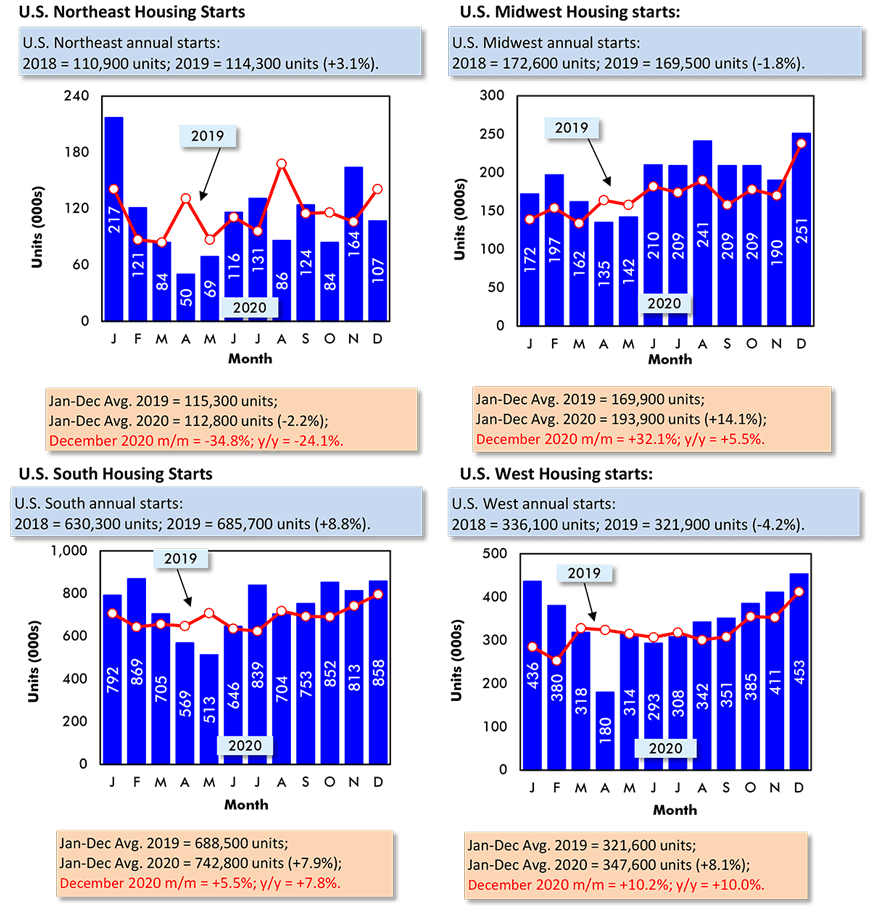
Among the Census Bureau’s four major ‘geo’ areas, only the Northeast Region recorded a reduction in the number of housing starts (expressed in units) in 2020 relative to 2019, a small -2.2%.
The Midwest registered a nice year-over-year increase, +14.1%. The South and West were also on the upside, +7.9% and +8.1% respectively.
All four regions recorded single-family starts gains that were in close alignment: Northeast, +7.2%; Midwest, +13.6%; South, +11.4%; and West, +12.4%.
In multi-family starts, though, the picture was more diverse: Northeast, -13.0%; Midwest, +12.1%; South, -2.7%; and West, -6.3%.
The South continued to account for slightly more than half (53.1%) of all U.S. housing starts last year. The West took the next largest share, one-quarter (24.9%). The Midwest claimed 13.9% and the Northeast, 8.1%.
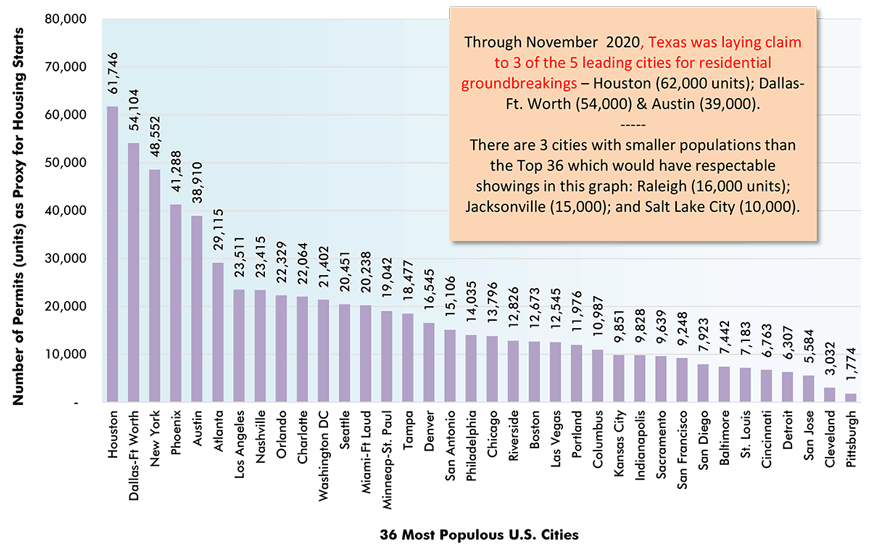
As for how major U.S. cities have been doing on the homebuilding front, the data is currently available only through November, 2020. Moreover, it consists of ‘permit’ counts rather than groundbreaking or ‘start’ counts. (Permits are therefore accepted as ‘proxies’ for starts.)
From Graph 10, three of the five U.S. cities with the highest year-to-date number of residential permits issued through November 2020 were in Texas ‒ Houston, 61,700 units; Dallas-Ft Worth, 54,100 units; and Austin, 38,900 units. The only other two cities to break into the Top 5 were population-rich New York, 48,600 units, and sun-drenched Phoenix, 41,300 units.
After the Top 5, there was a sizable drop to sixth-place Atlanta, 29,100 units.
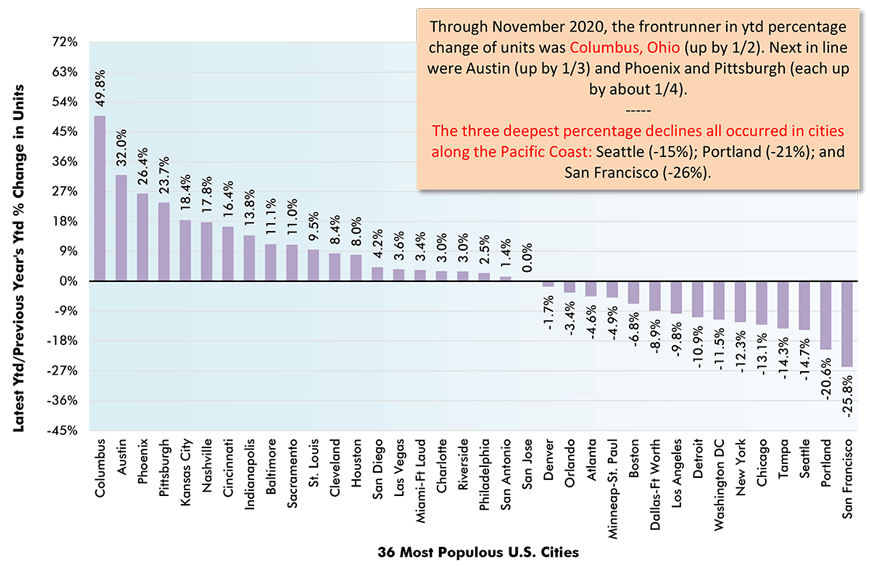
As for percent change in residential permits year over year, as recorded in Graph 11, the winner among American cities in 2020 was Columbus, Ohio, +49.8%. In second-place runner-up position was Austin, +32.0%; coming in third was Phoenix, +26.4%.
Of at least equal interest have been the metro statistical areas with the weakest 2020/2019 performances of residential permit counts. The three cities with the biggest pullbacks are all situated along the Pacific Coastline ‒ Seattle, -14.7%; Portland, -20.6%; and San Francisco, -25.8%.
Graph 8: U.S. Housing Starts
Jan-Dec 2020 vs Jan-Dec 2019 % Changes
Based on averages of monthly seasonally adjusted and annualized (SAAR) unit starts.
* ‘Singles’ includes townhouse complexes, except when multiple units have common heating & air conditioning.
Data source: U.S. Census Bureau.
Chart: ConstructConnect.
Graph 9: U.S. Regional Housing Starts
Data source: U.S. Census Bureau (Department of Commerce).
Chart: ConstructConnect.
Graph 10: Year to Date Residential Permits Issued (Units) in the 36 Most Populous U.S. Metro Statistical Areas (MSAs)
(Jan-Nov 2020)
At the city level, the number of residential building permits issued serves as a proxy for housing starts.
Data source: U.S. Census Bureau.
Chart: ConstructConnect.
Graph 11: Percent Change in Year-to-Date Housing Permits Issued (Units) in the 36 Most Populous U.S. Metro Statistical Areas (MSAs)
(Jan-Nov 2020 vs Jan-Nov 2019)
At the city level, the number of residential building permits issued serves as a proxy for housing starts.
Data source: U.S. Census Bureau.
Chart: ConstructConnect.
Toronto and Ottawa have Propped up Canadian Housing Starts
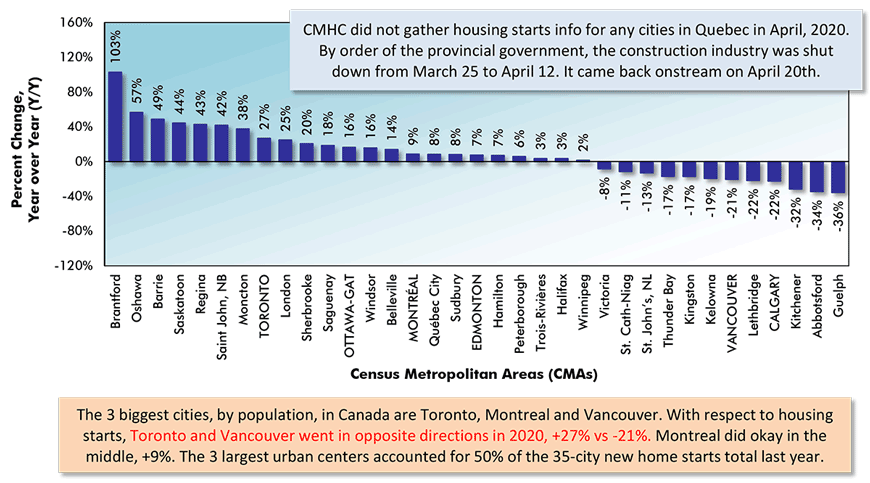
Canada’s three biggest cities, by population, ‒ Toronto, Montreal and Vancouver ‒ accounted for half of all housing starts in the nation’s 35 census metropolitan areas (CMAs) in 2020. Add in Ottawa-Gatineau, Calgary and Edmonton, the country’s only other cities with resident counts exceeding a million, and the slice expanded to 70%.
While in most U.S. cities, single-family starts remain comfortably higher than multi-family starts, the same is not true in Canada’s major urban centers. Last year, multiple-unit starts in Montreal were an exceedingly high 91%; in Vancouver, 86%; and in Toronto, 85%. For all 35 Canadian cities, the ‘multiples’ proportion was just under 80%.
On a year-over-year starts basis, Canada’s six major markets separated in three distinct ways in 2020. Toronto (+27%) and Ottawa-Gatineau (+16%) were truly bright spots; Montreal (+9%) and Edmonton (+7%) exhibited a little sparkle; but Vancouver (-21%) and Calgary (-22%) turned out the lights.
Running through Ottawa-Gatineau is the river that marks the boundary between the provinces of Ontario and Quebec. The Ontario side of the nation’s capital in 2020 had housing starts that were +28% year over year; the Quebec side, -10%.
Toronto’s housing starts of +27% year over year were impressive, but even better were residential groundbreakings in three peripheral (i.e., semi-‘bedroom’) communities: Brantford, +103%; Oshawa, +57%; and Barrie, +49%. A little further afield, though, housing starts weakened last year: Guelph, -36% and Kitchener-Waterloo-Cambridge, -32%.
Toronto’s housing starts strength seems vulnerable. Canada as a whole has managed a nearly 80% jobs recovery ratio relative to the huge drop in employment that occurred between February and April of 2020, due to the onset of coronavirus infections. Toronto’s jobs recovery ratio, or claw-back ratio, since last Spring has been only 60%.
Toronto’s present unemployment rate of 10.7% is in 28th spot in a ranking of all Canadian cities from tightest (best) to loosest (worst).
Also, as is the case everywhere these days, with borders closed, population gains are at a minimum.
But potential suppressants for Toronto’s homebuilding sector have been pointed out vociferously and numerously by many in the past and they’ve always been brushed aside by other factors feeding a juggernaut advance (e.g., ultra-low interest rates and a desire not to miss out on a buying opportunity.)
Graph 12: Percent Change in Year-To-Date Housing Starts –
Ranking Of Canada’s Major Cities
(Jan-Dec 2020 vs Jan-Dec 2019)
Canada’s Census Metropolitan Areas (CMAs) have core populations of 50,000 plus.
Canada’s 6 CMAs with populations in excess of 1 million are in capital letters.
Data source: Canada Mortgage & Housing Corporation (CMHC) based on actuals rather than seasonally adjusted data.
Chart: ConstructConnect.
Graph 13: Housing Starts in Canada’s 6 Most Populous Cities
January to December 2020 Actuals
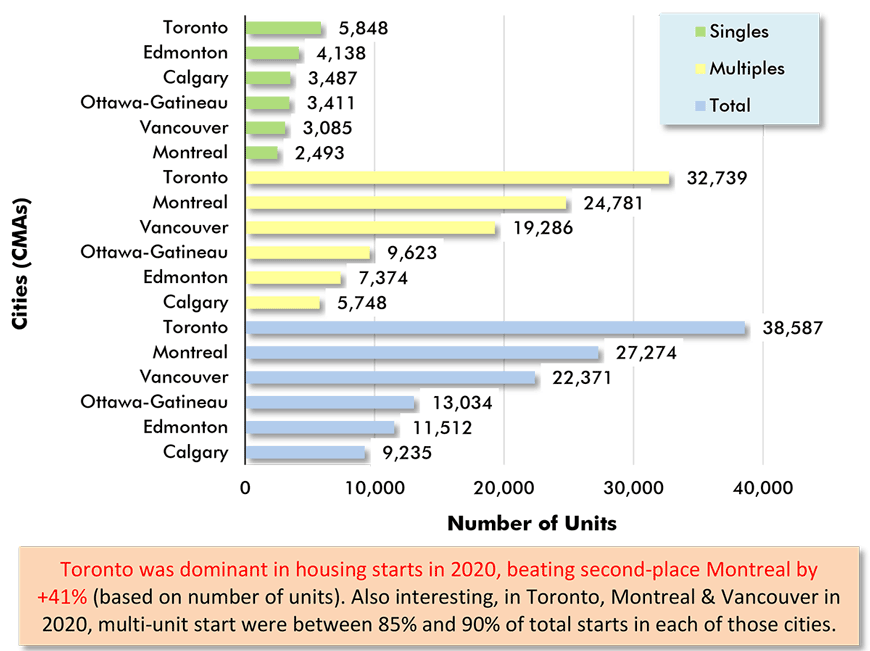
Data source: Canada Mortgage & Housing Corporation (CMHC).
Chart: ConstructConnect.
Graph 14: Housing Starts in Canada’s 6 Most Populous Cities
Jan-Dec 2020 vs Jan-Dec 2019
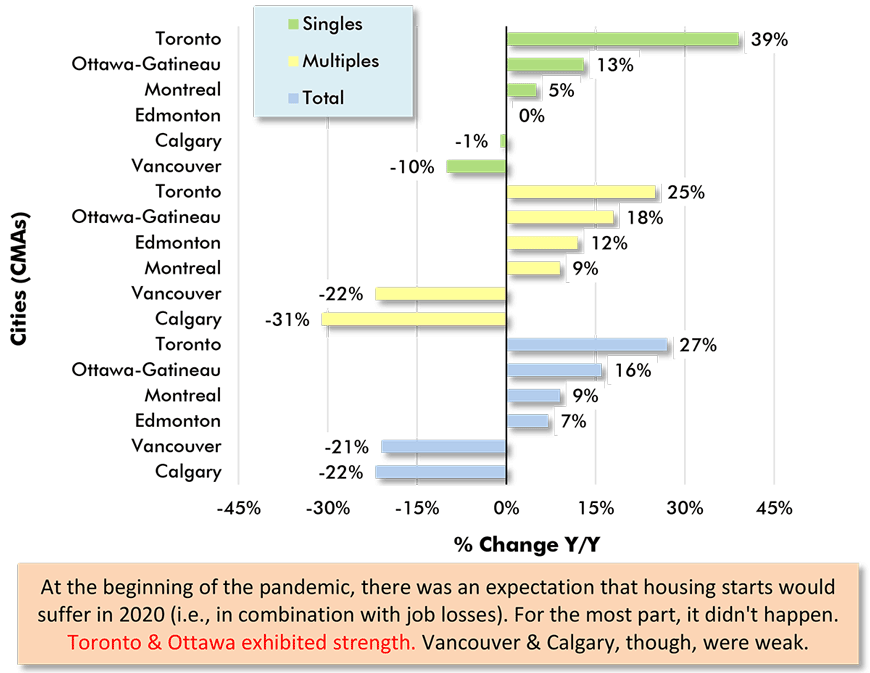
Data source: Canada Mortgage & Housing Corporation (CMHC).
Chart: ConstructConnect.
Alex Carrick is Chief Economist for ConstructConnect. He has delivered presentations throughout North America on the U.S., Canadian and world construction outlooks. Mr. Carrick has been with the company since 1985. Links to his numerous articles are featured on Twitter @ConstructConnx, which has 50,000 followers.


Recent Comments