
Key takeaways from the latest U.S. energy trade statistics are as follows:
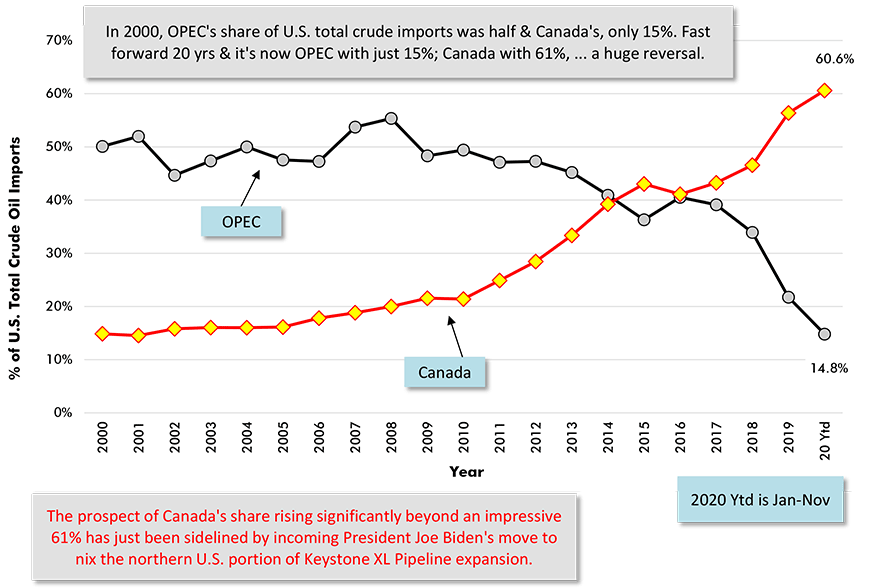
- In 2000, OPEC’s share of U.S. total crude imports was half & Canada’s, only 15%. Fast forward 20 yrs & it’s now OPEC with just 15%; Canada with 61%, … a huge reversal.
- The prospect of Canada’s share rising significantly beyond an impressive 61% has just been sidelined by incoming President Joe Biden’s move to nix the northern U.S. portion of Keystone XL Pipeline expansion.
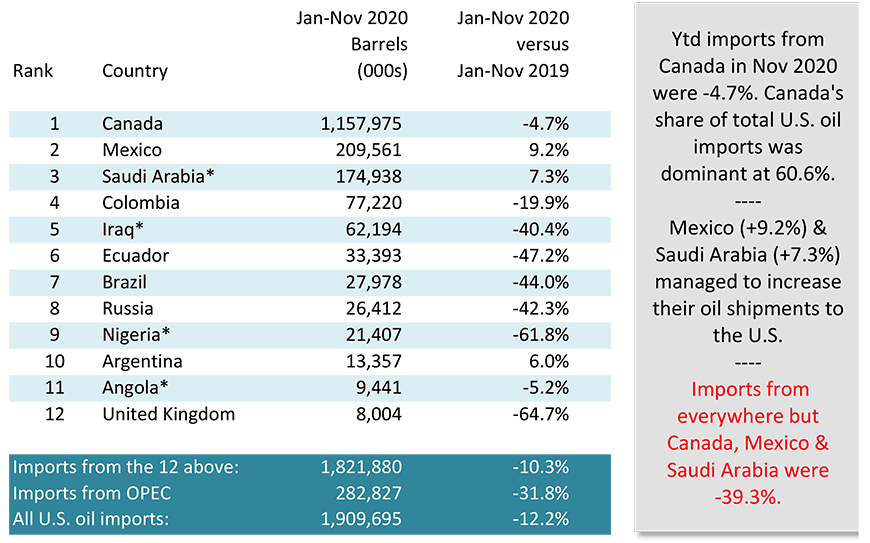
- Ytd imports from Canada in Nov 2020 were -4.7%. Canada’s share of total U.S. oil imports was dominant at 60.6%.
- Mexico (+9.2%) & Saudi Arabia (+7.3%) managed to increase their oil shipments to the U.S.
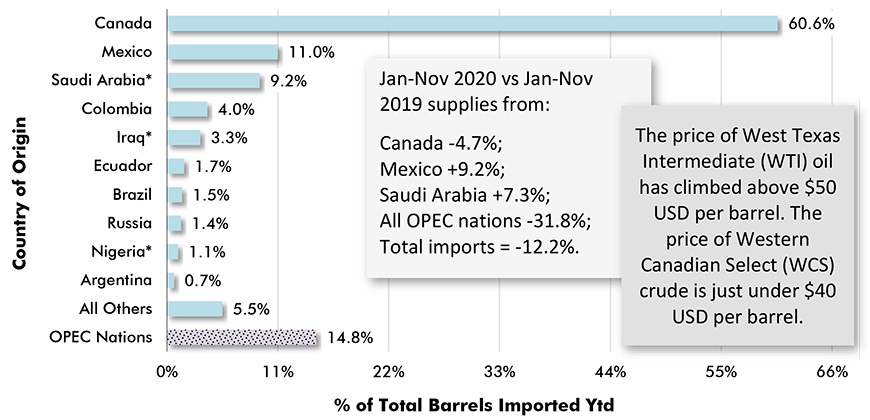
- Imports from everywhere but Canada, Mexico & Saudi Arabia were -39.3%. Jan-Nov 2020 vs Jan-Nov 2019 supplies from: Canada -4.7%; Mexico +9.2%; Saudi Arabia +7.3%; All OPEC nations -31.8%; Total imports = -12.2%.
- The price of West Texas Intermediate (WTI) oil has climbed above $50 USD per barrel. The price of Western Canadian Select (WCS) crude is just under $40 USD per barrel.
Graph 1: Shares of U.S. Total Oil Imports (Barrels)
Sourced from OPEC and Canada
Data sources: Census Bureau, Bureau of Economic Analysis (BEA) & Energy Information Administration (EIA).
Chart: ConstructConnect.
Table 1: Top Dozen Suppliers of U.S. Oil Imports Year-to-date (Ytd) – November 2020
* Denotes OPEC nations. OPEC figure adjusted for Ecuador’s Jan 2020 withdrawal of membership.
Data source: U.S. Bureau of Economic Analysis (BEA).
Chart: ConstructConnect.
Graph 2: Foreign Sources of U.S. Imported Oil
% of Total Barrels Year to Date − November 2020 Year to Date
* Asterisk indicates country an OPEC member. Figures adjusted for Ecuador’s Jan 2020 departure from OPEC.
Data source: Census Bureau & Bureau of Economic Analysis (BEA).
Chart: ConstructConnect.
Alex Carrick is Chief Economist for ConstructConnect. He has delivered presentations throughout North America on the U.S., Canadian and world construction outlooks. Mr. Carrick has been with the company since 1985. Links to his numerous articles are featured on Twitter @ConstructConnx, which has 50,000 followers.


Recent Comments