
As I sit writing this Nuggets report, it’s just after Valentine’s Day and we’re about one month away from the mid-March annual anniversary of when the coronavirus descended on us all and turned our employment and social lives upside down, amidst the terrible medical toll taken on the population at large.

Saying 2020 was a ‘difficult’ year is an epic understatement. Among bad years, even throughout history, 2020 was one of the sorriest. The myriad statistics generated last year reflected the grim reality.
There’s an emerging sense, though, that corners have been turned on the health, business and political fronts and soon the latest numbers on the economy will warrant comparison with their more traditional levels and percent changes.
On that note, let’s look at some of the ‘nuggets’ to be gleaned from the latest public and private sector data releases.
(1) In both the U.S. and Canada, there were prodigious job losses between February and April of last year, during the first wave of COVID-19-induced lockdowns. Since April 2020, the jobs recovery ratio in the U.S. has been a rather mediocre 51.7%. Canada has done a little better, with a jobs claw-back ratio of 71.4%.
(2) In the construction sector, the U.S. jobs claw-back ratio is 73.7%. The comparable Canadian figure is 81.3%. In manufacturing, the jobs recovery ratios for the two countries are 56.2% south of the border, but a commendable 97.1% north of the divide.
(3) For the hardest hit sector in both economies, ‒ ‘restaurants, bars and hotels/motels’, ‒ it’s the U.S. doing better than Canada, with a jobs claw-back ratio of 49.3% versus 36.2%. While such employment in the U.S., in terms of number of jobs, is currently -22.9% compared with February 2020, Canada’s figure is deeper in the hole, at -31.9%.
(4) The airline and accommodation sectors remain distressed to extreme degrees. Are there any indications of a pickup in travel yet? Not really. The latest weekly average of checkpoint clearings conducted by the U.S. Transportation Security Administration (TSA) was -58.9% compared with the count over the same time frame (i.e., the week ending February 15th, 2020) last year.
(5) Stepping back and looking over the longer term reveals an interesting shift taking place in the number of manufacturing jobs relative to construction jobs in the economies of the U.S. and Canada. In both countries, employment in construction, which was once well short of manufacturing, has been catching up. The trend has been more advanced in Canada than in the U.S.
(6) In the year 2000 in the U.S., there were 0.40 jobs in construction for every 1.00 job in manufacturing. The ratio is now 0.60 to 1.00. In Canada, the ratio has moved from 0.36/1.00 in 2000 to 0.83/1.00 presently. Graphs 1 and 2 show that the transitions, while dramatic, have been gradual. Construction jobs have been steady or climbing while manufacturing jobs have been receding or advancing more slowly. Offshoring of work in the 00s cost manufacturing employment dearly. Greater automation on production lines has also played a major role. For Canada, construction employment has been bolstered by a homebuilding sector that never saw the steep declines in activity that occurred in the U.S. in the ‘financial crisis’ years after 2008-09.
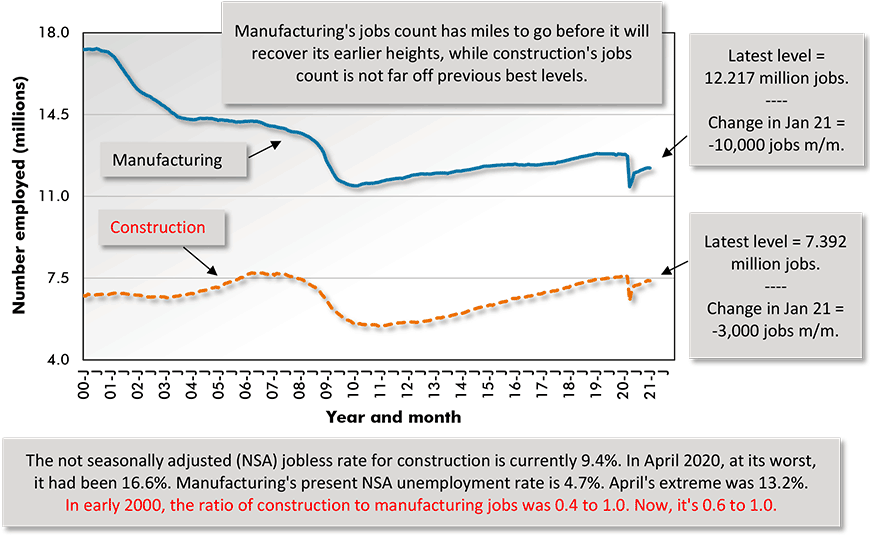
Chart: ConstructConnect.
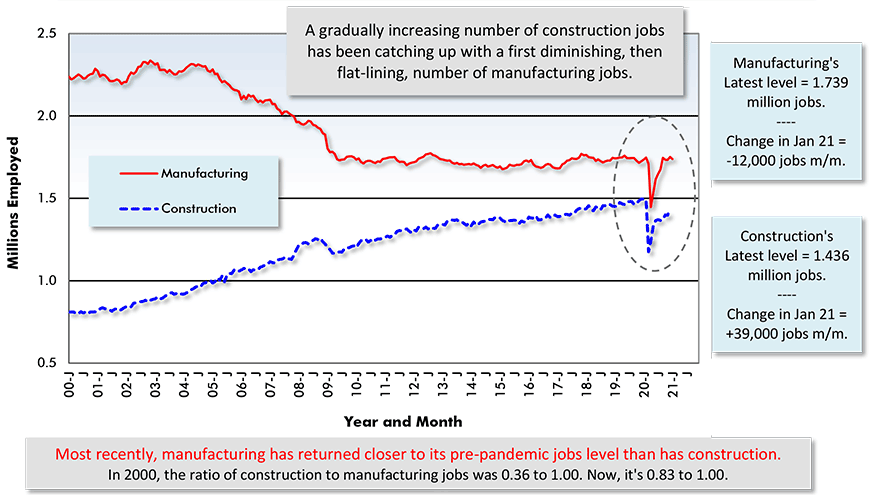
Chart: ConstructConnect.
(7) Are circumstances aligning to promote a manufacturing jobs comeback? One can point to several potential positives including de-globalization and the new USMCA which promotes more domestic output of many goods, including motor vehicles and parts. But here’s another possibility to consider. Contractors are already expressing worry about possible labor shortages when the economy heats up again. Anticipating this concern, some firms have been increasingly proceeding down the path of prefabricated construction. What makes this particularly interesting, in the context of construction versus manufacturing jobs, is that it takes workers out of the former category and places them in the latter.
(8) Washington ran up a huge budgetary deficit in the fiscal year ending September 30th, 2020.
With a further big whack of stimulus spending planned, there will be another enormous shortfall in government finances for 2020-2021. At the same time, the foreign trade deficit has shot up alarmingly. The net of goods exports minus goods imports has returned beyond negative a trillion dollars. This is the ‘twin deficits’ problem, in fiscal balance and foreign trade (i.e., both exceeding -$1 trillion USD), that used to be such a source of consternation.
Graph 3: United States’ Foreign Trade: Goods and Services Balance − December 2020
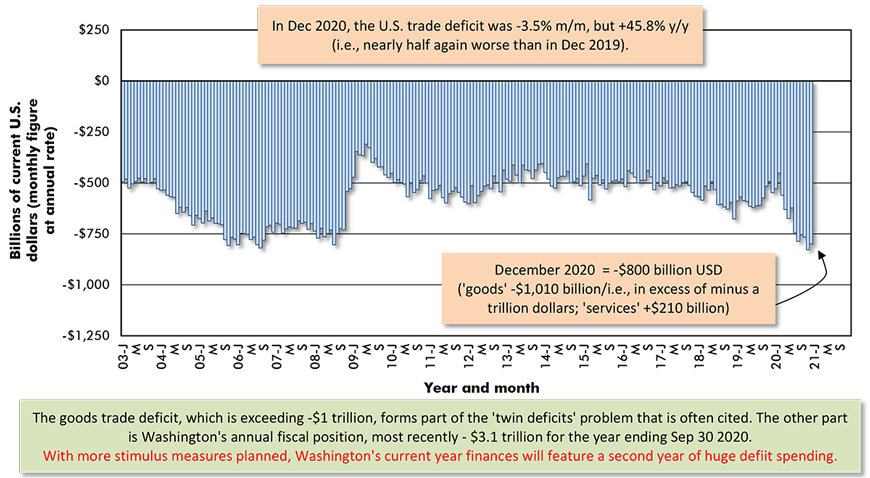
The last data point is for December 2020.
Based on seasonally adjusted monthly figures, projected at an annual rate.
Data source: Bureau of Economic Analysis (BEA).
Chart: ConstructConnect.
Graph 4: Canada’s Foreign Trade: The Merchandise Trade Balance − December 2020
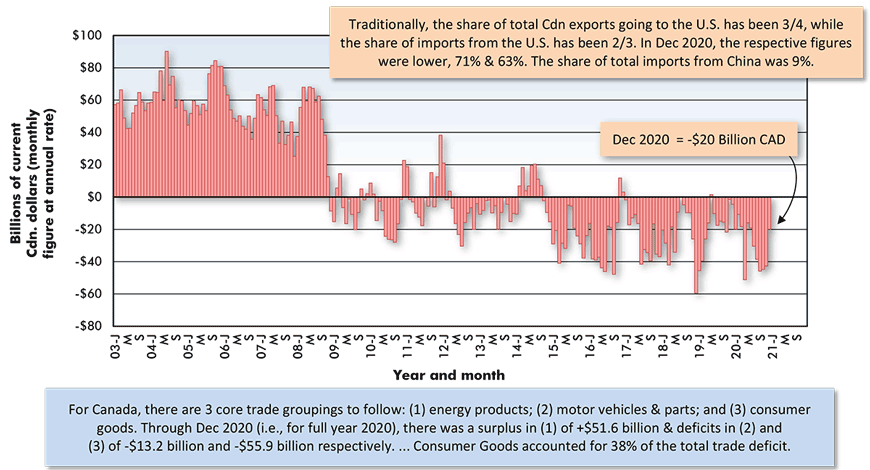
The last data point is for December 2020.
Based on seasonally adjusted monthly figures, projected at an annual rate.
Data source: Statistics Canada.
Chart: ConstructConnect.
(9) Interestingly, in the ‘old days’ (i.e., in the 00s), China was by far the major source of the U.S. deficit in the trade of goods. That country would consistently account for between 45% and 50% of America’s trade gap. After a couple of years of butting heads with Beijing, with various tariff measures introduced to argue more forcefully for change, China’s share of the U.S. goods trade deficit has now fallen to under one-third, 32.8%.
(10) In the place of China, however, some other countries and trading blocs have expanded their proportions of the U.S. goods trade deficit. Three years ago, the Euro Area normally accounted for between 15% and 18% of the U.S. goods trade deficit. In the most recent month, December 2020, the Euro Area claimed 21.4%, led by Germany, 7.4%; Ireland, 6.5%; and Italy, 4.2%. Motor vehicles and pharmaceuticals figured prominently in the imports from those nations.
(11) Mexico’s slice of the U.S. goods trade deficit used to hover just under 10%. Most recently, its share was 12.0%. Other nations with sizable portions of the U.S. trade deficit are Japan, 7.1%; Malaysia, 4.0%; Taiwan, 3.6%; Switzerland, 3.2%; and South Korea, 3.0%.
(12) By far, the leader among U.S. states for goods exports is Texas. Its full year 2020 dollar-volume of foreign sales at $279 billion was 80% ahead of next-place California’s $156 billion. Well back in third and fourth spots were New York and Louisiana. Texas and Louisiana benefit immensely from energy product sales externally. Those two states are where the construction industry looks first for mega-sized petroleum refinery, chemical plant and LNG facility work.
Graph 5: The 25 Leading States for Goods Exports, Jan-Dec 2020
Ranked by $ Volume (Also Showing YTD % Changes – i.e., vs Jan-Dec 2019)
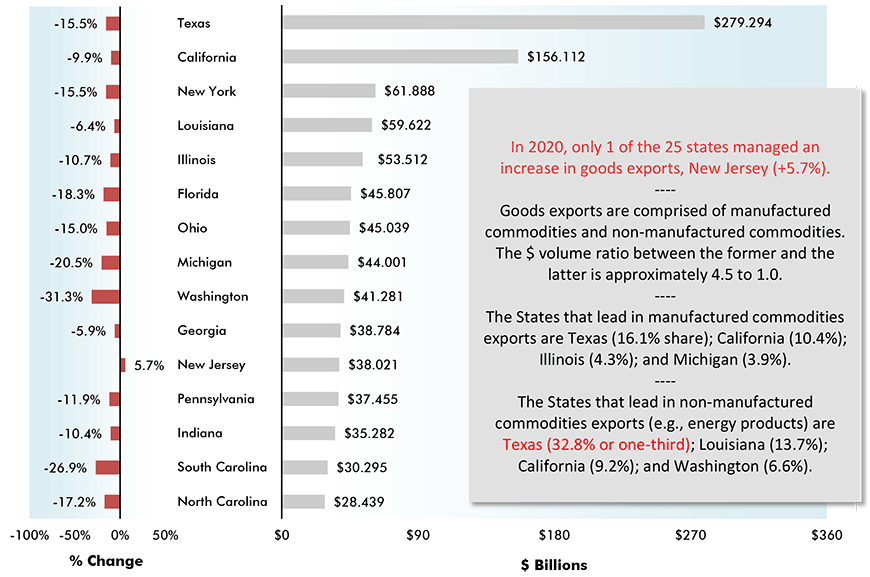
Data source: U.S. Census Bureau and Bureau of Economic Analysis (BEA).
Chart: ConstructConnect.
(13) Key product exports from Canada’s provinces mostly plummeted in 2020 relative to 2019. Only farming output from Saskatchewan showed much buoyancy, +31.6% year over year. Changing the time frame, though, entirely alters the complexion of the story. Graph 6 shows percent change results for full year 2020 over full year 2019. Graph 7 shortens the comparison period to latest-three-months (Oct-Dec 2020) versus previous-three-months (Jul-Sep 2020). Almost all the horizontal bars in Graph 7 have moved to the right side of the axis, speaking of positive performances. More orders from foreign customers tethered to global commodity prices on the rise once again have been just the ticket needed.
Graph 6: Canada’s Key Export Product Sales by Province
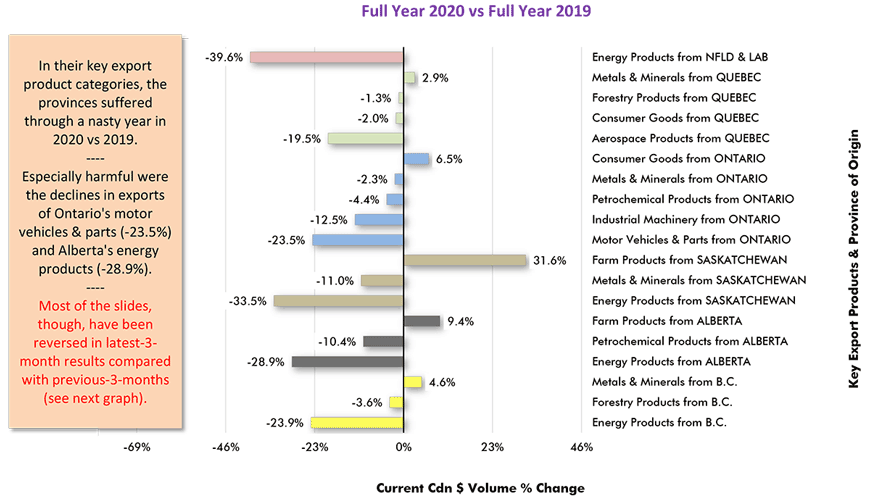
Data source: Statistics Canada Table 12-10-0119-01.
Chart: ConstructConnect.
Graph 7: Canada’s Key Export Product Sales by Province
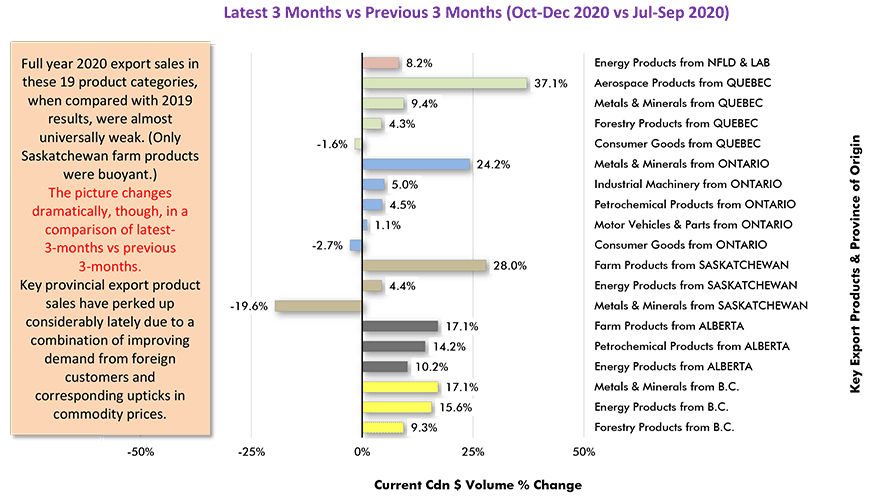
Data source: Statistics Canada Table 12-10-0119-01.
Chart: ConstructConnect.
Alex Carrick is Chief Economist for ConstructConnect. He has delivered presentations throughout North America on the U.S., Canadian and world construction outlooks. Mr. Carrick has been with the company since 1985. Links to his numerous articles are featured on Twitter @ConstructConnx, which has 50,000 followers.


Recent Comments