The ease with which the U.S. and Canadian economies recover from the coronavirus-caused economic downturn is very much going to depend on whether we can escape without a significant upsurge in inflation.

Over the next six months to a year, everyone in my profession will be keeping an eagle eye on how prices are performing.
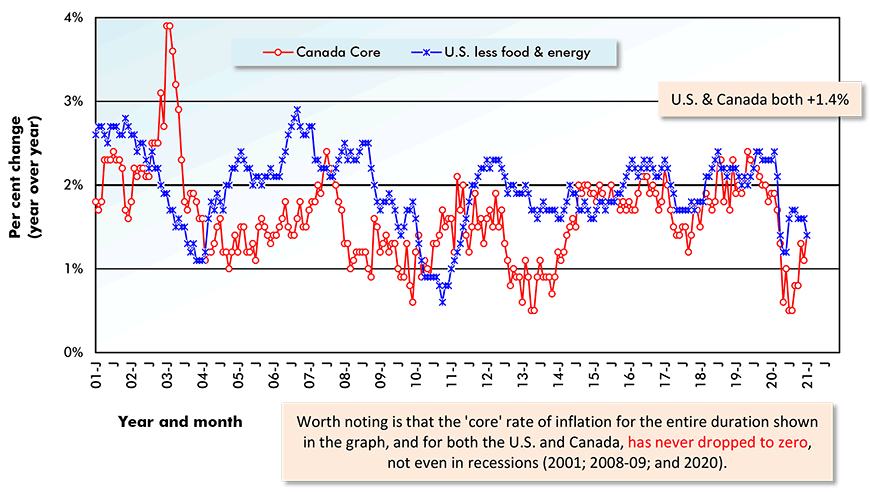
For the moment, general price inflation, as represented by Consumer Price Index (CPI) numbers, remains restrained, although there are some indications that ‘all item’ and ‘core’ values are flirting with +2.0% year over year. For example, in Canada, two of the three ‘core’ measures monitored by the Bank of Canada now do sit at +2.0% y/y. The third BoC ‘core’ measure is +1.3% y/y (see lower text box in Chart 5).
The highest current reading for U.S. general inflation is +1.5% y/y for the Personal Consumption Expenditures (PCE) price index, excluding food and energy.
By the way, ‘core’ as opposed to ‘all items’ CPI omits items that often exhibit extreme price volatility, mainly in the food and energy realms.
The price of gasoline, which is an important benchmark, since its attached to a product that is used extensively, remains less than it was a year ago in both countries, -8.6% y/y in the U.S. and -3.3% y/y in Canada. But in the latest month (January 2021), and with the per-barrel cost of global oil back up around $60 USD, gasoline was +6.9% m/m south of the border and +6.1% m/m on the northern side.
The Government Deficit and Debt Dilemma
Given the vast expansions of government deficits and debt that have occurred (and, one might say, been necessitated by) efforts to revive the economy and provide cushions for many ‘stranded’ individuals and companies, it’s crucially important that interest rates stay low.
To a major degree, central bank interest rates are governed by inflation rates. A too rapid increase in the latter spurs upwards adjustments of the former.
There’s the danger that if they yields rise too far (and there’s no clear consensus yet on what that level might be), carrying costs will become excessively prohibitive. And another financial crisis will be precipitated.
The fervent hope is that economic matters will improve quickly and greatly enough that tax revenue will negate big portions of government debt financing problems.
An expectation that inflation will soon heat up is already leading to climbs in commercial bank interest rates separate from the ‘hold-the line’ stances being adopted by the Federal Reserve and Bank of Canada.
Moderate versus over-heated inflation may well turn out to the fulcrum upon which all our senses of well-being will depend once these pandemic days are behind us.
(Not Seasonally Adjusted)
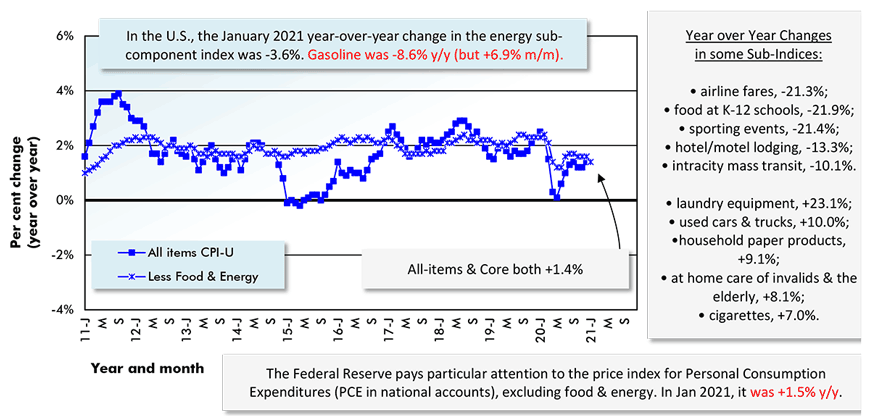
The U.S. figure (CPI-U) is the All Items Consumer Price Index for All Urban Consumers.
*Core inflation is CPI-U less its often most volatile sub-components, food and energy.
Chart: ConstructConnect.
(Not Seasonally Adjusted)
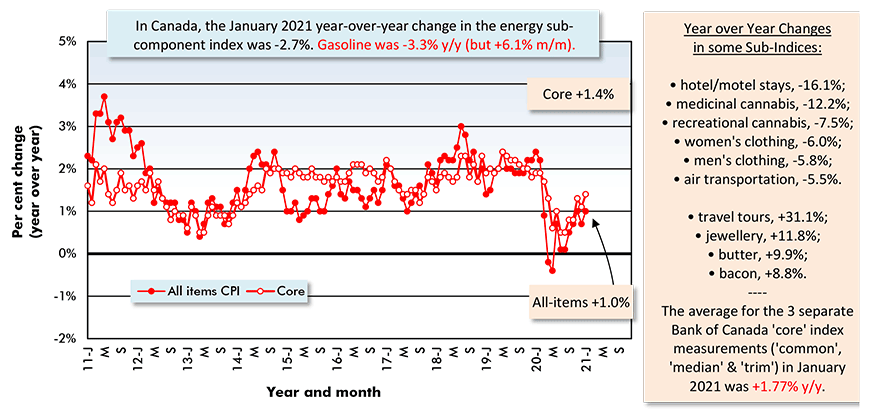
The Canada figure (CPI) is the All Items Consumer Price Index.
*Core inflation is CPI-U less its often most volatile sub-components, food and energy.
Chart: ConstructConnect.
(CPI & CPI-U Not Seasonally Adjusted)
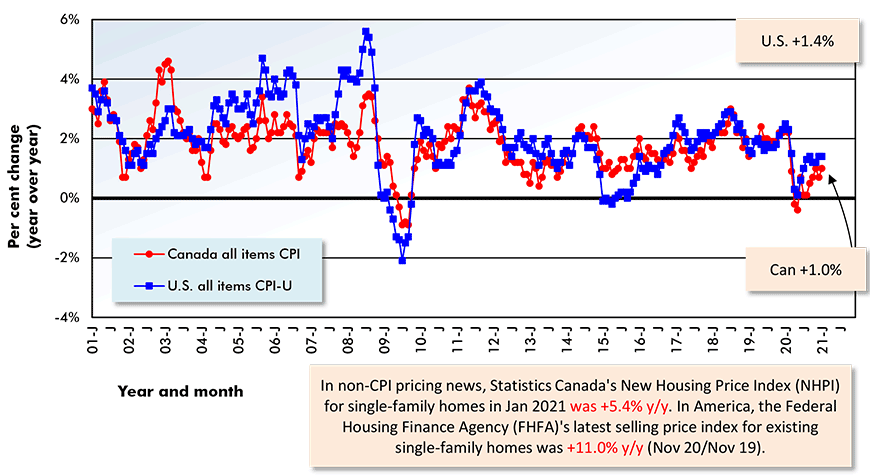
Chart: ConstructConnect.
(CPI Core & CPI-U Less Food and Energy Not Seasonally Adjusted)
*Core is all-items inflation less its often most volatile sub-components, food and energy.
Chart: ConstructConnect.
Previous Month & Current Month (December 2020 & January 2021)
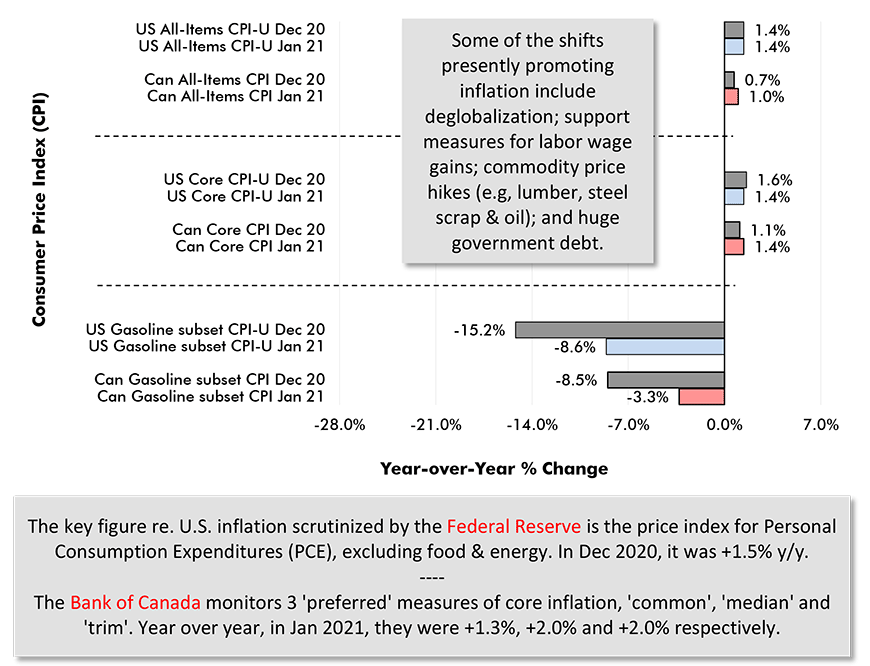
Chart: ConstructConnect.
Please click on the following link to download the PDF version of this article:
Economy at a Glance Vol. 17, Issue 37 and 38 – Moderate versus Over-heated Inflation as the Fulcrum for Well-Being – PDF
Alex Carrick is Chief Economist for ConstructConnect. He has delivered presentations throughout North America on the U.S., Canadian and world construction outlooks. Mr. Carrick has been with the company since 1985. Links to his numerous articles are featured on Twitter @ConstructConnx, which has 50,000 followers.


Recent Comments