
Stock Markets: Has all the Bubbly been Baked In?
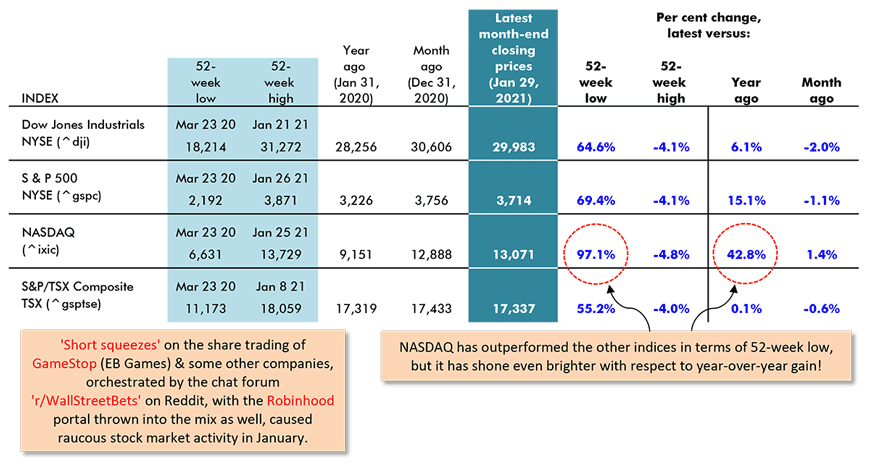
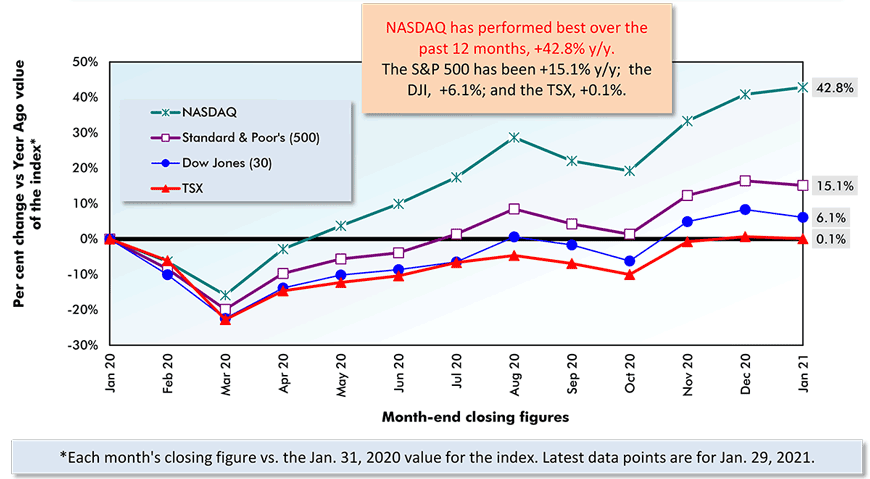
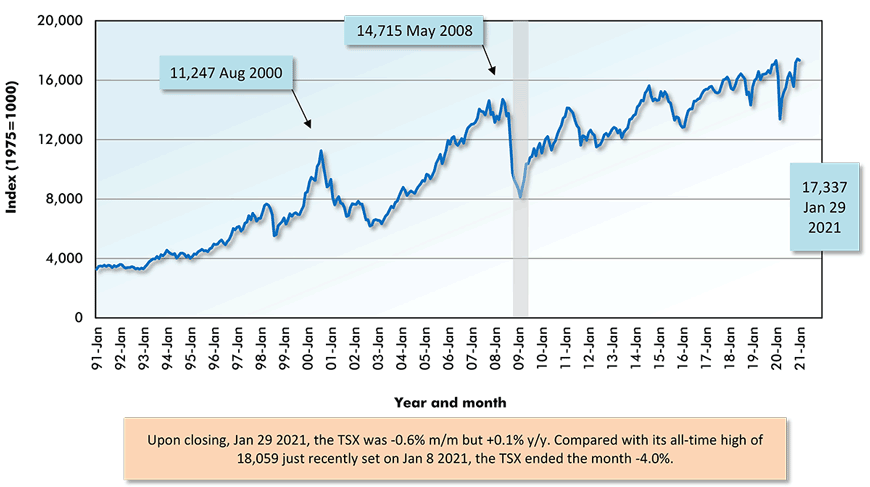
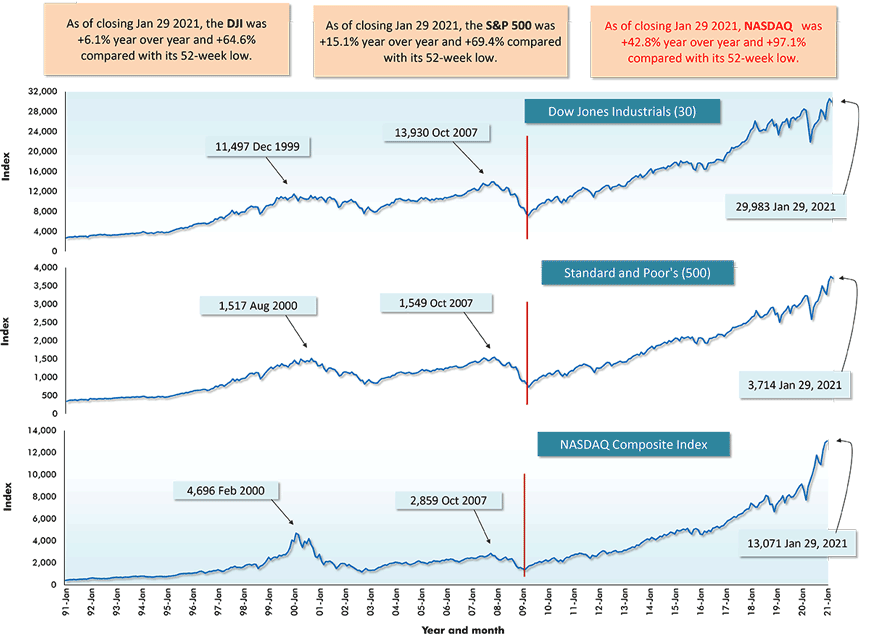
In January 2021, with the coronavirus pandemic raging as a backdrop, the three major U.S. stock market indices ‒ DJI (30), S&P 500 and NASDAQ ‒ set record highs. The TSX also managed a new perch, but its readings have not been soaring to anything like the same degree as the American indices over the past decade.

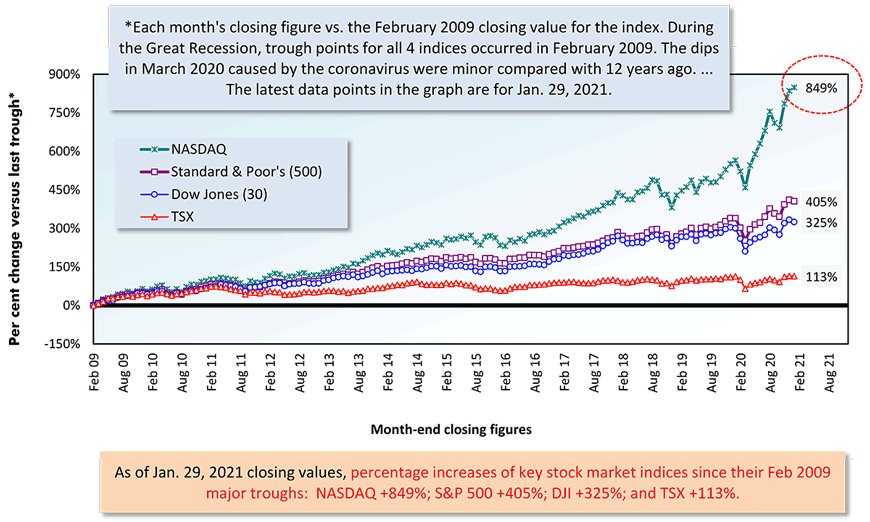
Versus their major trough values in February 2009, NASDAQ is presently +849%; the S&P 500, +405%; and the DJI (30), +325%. The TSX is a relatively modest +113%. (By the way, in March of last year, there were ‘dips’ in the indices that might be categorized as minor troughs. But they were nothing compared with what happened in the financial crisis recession of 2008-2009.)
‘Real’ gross domestic product (GDP) grew, off a low base, by just +4.0% in Q4 2020, period-to-period annualized, and the advance is expected to be even more subdued in Q1 2021, due to the lockdowns necessitated by winter’s COVID-19 resurgence. But from this coming Summer on, the economy is expected to launch into orbit as ‘herd immunity’ is achieved by means of a massive immunization effort.
This raises the question: Has 2021’s second-half improvement already been factored into where stock market values are today? In other words, has 2021’s projected return from darkness into light been built into the recent soaring values achieved by the DJI, S&P 500 and NASDAQ?
Probably not. I’m not a stock market prognosticator, but based on the resilience, followed by vitality, of the indices over the past number of years, it seems likely they still have upside potential.
Securities Dealers Automated Quotations (NASDAQ), Toronto Stock Exchange (TSE) and Reuters.
Table: ConstructConnect.
The Hedge Fund Gaming of GameStop Saga
The U.S. stock market indices reaching new highs has become old news. They seem to do that on a regular basis these days.
January 2021’s stock market highlight featured something else entirely, ‘short squeezes’ in the trading of certain stocks, including those of GameStop, a ‘bricks and mortar’ retailer of computer amusements (with stores under the EB Games name), and Blackberry, a former ‘darling’ among cell phone makers.
A ‘short sale’ of a stock is usually when you enter into agreement with someone else to sell them shares (which you don’t currently own) in a company at a specified price near the current price and at some specific time in the future. You’re betting that when the contract satisfaction date rolls around, the price of the shares will have fallen and you can purchase the equities, hand them over and pocket the difference as profit.
Why would a buyer enter into such an agreement? Because they want to acquire the shares later than now, but they also wish to know what they’ll be paying. They don’t want to be caught having to pay an exorbitant amount, should the share price take off.
‘Short selling’ is a perfectly reasonable means to even out market activity and provide assurance that neither party in the transaction will be severely ‘burned’. That’s true, except when there’s a ‘short squeeze’.
A short seller can find that as the fulfilment date approaches, they can’t buy the specified number of shares set out in the contract, even if they’re being listed as a bargain, and they need to bid the price higher. Once the price climbs above the contract price, there’s a problem that can quickly escalate into a crisis.
Wagging a Finger at Trading Shenanigans
A gathering of smaller investors in a chat room (r/WallStreetBets) on Reddit spotted that some big hedge funds were shorting the shares of GameStop and some other companies. With a transaction date fast approaching, they banded together and first withheld sales of their shares, then joined the frenzied bidding war that ensued. A lot of demand started chasing too little supply. GameStop’s equity price took flight.
The online share trading site, Robinhood, soon became part of the story. It placed temporary halts on the wild trading activity. It may have been acting ethically, to reduce the number of heavy losers that were emerging. Or it may have been trying to dodge a capital problem, based on loans issued on margin that appeared in danger of default, once the share price dropped back down to earth again. Robinhood’s CEO has said this wasn’t an issue, but that has evoked skepticism.
In any event, in the aftermath of the trading ‘halts’, there’s been an outcry by the gathering of smaller investors that they’ve been denied their full opportunity to best the big guys ‒ i.e., the establishment as represented by the hedge funds.
The citizens of Sherwood Forest have become upset that they can’t keep sticking it to King John. As a further outrage, they believe there are no limits to the advantages flowing in the other direction.
To the ‘outside world’, this is an instance of share trading that’s analogous to gambling in a casino. The share price can bear little relationship to its underlying true value.
Many politicians and SEC regulators view negatively the kind of stock market trading that might be described as engaging in shenanigans. They worry about undermining confidence in a system that legitimately provides firms with yardsticks (e.g., share price up or down) to measure management success and the IPO financial means to take on competitors and expand the business. That latter point is where ‘construction’ enters the picture.
The GameStop saga undoubtedly has more chapters to be written.
Securities Dealers Automated Quotations (NASDAQ), Toronto Stock Exchange (TSE) and Reuters.
Securities Dealers Automated Quotations (NASDAQ), Toronto Stock Exchange (TSE) and Reuters.
Table: ConstructConnect.
Year over Year as of Month-end Closings, January 29, 2021
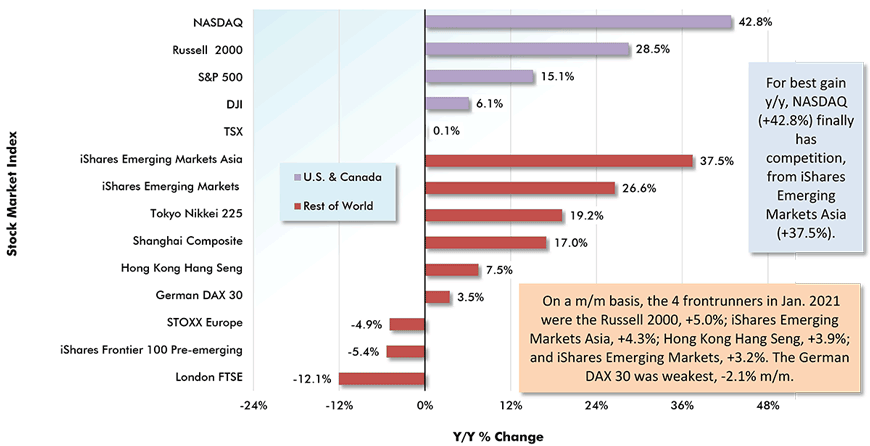
Table: ConstructConnect.
Securities Dealers Automated Quotations (NASDAQ), Toronto Stock Exchange (TSE) and Reuters.
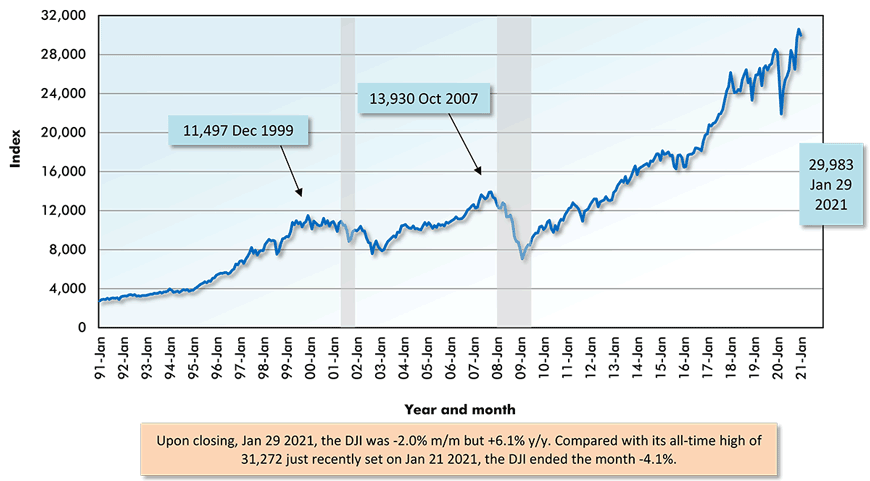
Chart: ConstructConnect.
Securities Dealers Automated Quotations (NASDAQ), Toronto Stock Exchange (TSE) and Reuters.
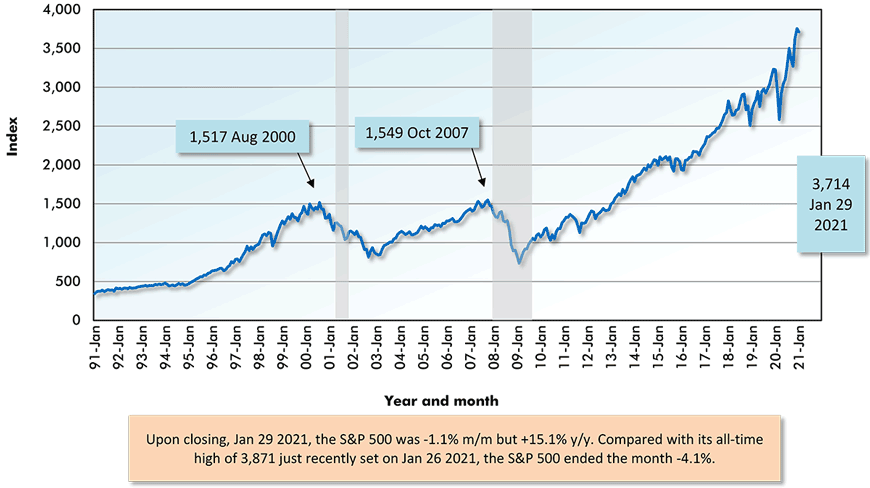
Chart: ConstructConnect.
Securities Dealers Automated Quotations (NASDAQ), Toronto Stock Exchange (TSE) and Reuters.
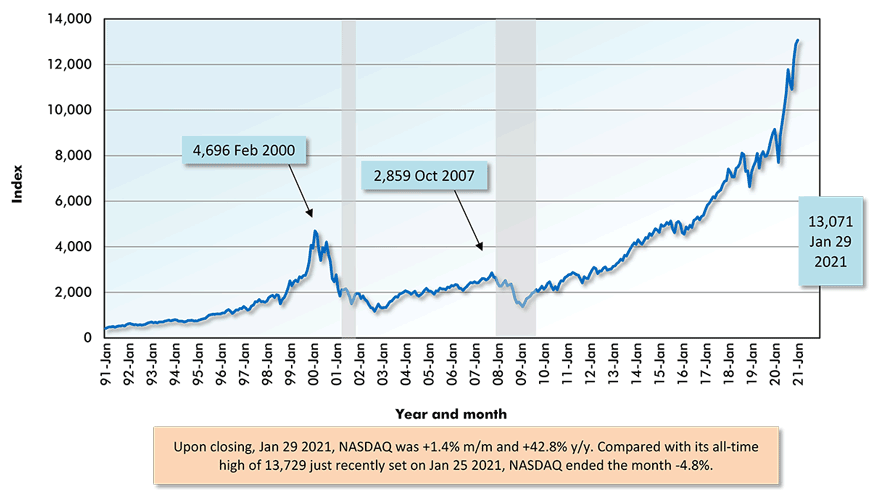
Chart: ConstructConnect.
Securities Dealers Automated Quotations (NASDAQ), Toronto Stock Exchange (TSE) and Reuters.
Chart: ConstructConnect.
Securities Dealers Automated Quotations (NASDAQ), Reuters & Yahoo.
Chart: ConstructConnect.
Alex Carrick is Chief Economist for ConstructConnect. He has delivered presentations throughout North America on the U.S., Canadian and world construction outlooks. Mr. Carrick has been with the company since 1985. Links to his numerous articles are featured on Twitter @ConstructConnx, which has 50,000 followers.


Recent Comments