
8 Different Measures of Inflation, U.S. & Canada
One chief determinant of central bank interest rate policy is inflation. Therefore, monetary authorities take an eagle-eyed look at price advances.

But they don’t rely on just the ‘headline’ all-items Consumer Price Index (CPI), nor its ‘core’ variant which leaves out purchased items that often display inordinate price volatility ‒ i.e., mainly in the food and energy realms.
The Federal Reserve’s ‘go-to’ measure on inflation is the price index for Personal Consumption Expenditures (PCE), excluding food and energy, found in Table 11 (under ‘Addenda’) in the monthly Personal Income and Outlays report published by the Bureau of Economic Analysis (BEA). This index is believed to be more attuned to what people are actually buying than the CPI calculated by the Bureau of Labor Statistics (BLS), which relies on a survey of a hypothetical ‘basket of goods’.
The PCE index in December 2020 was +1.5% year over year. The all-items CPI for last year’s final month was +1.4%, and its core version, +1.6%.
While still relying on a basket of goods (comprised of 55 items), the Bank of Canada concentrates on three modifications of Statistics Canada’s all-items CPI: ‘common’, ‘median’ and ‘trim’.
‘Common’ isolates price changes from underlying common trends; ‘median’ looks at mid-point changes tied to component weightings; and ’trim’ eliminates outlier results.
A detailed technical explanation of ‘common’, ‘median’ and ‘trim’ can be accessed at this link: https://www.statcan.gc.ca/eng/statistical-programs/document/2301_D64_T9_V2
Canadian year-over-year price changes in December 2020 were as follows: CPI all-items, +0.7%; CPI excluding food and energy, +1.1%; CPI-common, +1.3%; CPI-median +1.8%; and CPI-trim, +1.6%.
The discussion so far has identified eight price indices, three for the U.S. and five for Canada.
None of them currently lies above +2.0% y/y, the ‘tipping’ point when inflation needs to be taken more seriously.
But that’s not the end of the matter and we’ll consider the prospects of inflation heating up two sections along from here.
Previous Month & Current Month (November & December 2020)
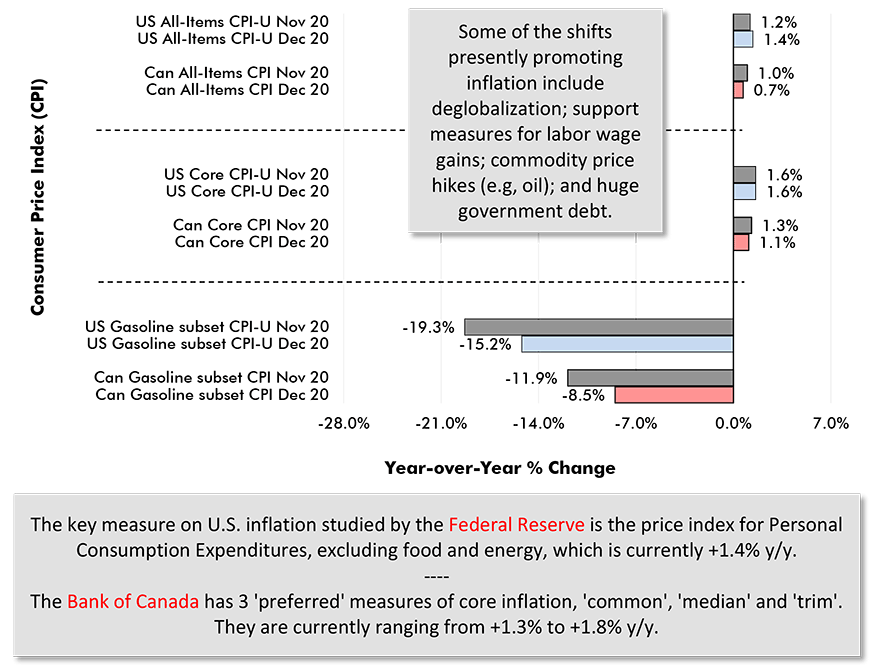
Chart: ConstructConnect.
Air Travel, Hotel Room Prices Down; Peanut Butter, Jewelry Up
Some of the notable U.S. price movements in December 2020 were as follows.
On the downside:
- motor vehicle insurance, -4.8% y/y;
- lodging away from home, including hotels and motels, -11.2% y/y;
- women’s dresses, also -11.2% y/y;
- men’s suits, sports coats and outerwear, -13.4 y/y;
- gasoline, -15.2% y/y (but +8.4% seasonally adjusted, m/m); and
- airline fares, -18.4%.
On the upside:
- care of invalids and the elderly at home, +7.4%;
- used cars and trucks, +10.0% y/y;
- peanut butter, +11.2% y/y; and
- laundry equipment, +16.4% y/y.
And below are some of the noteworthy Canadian price hikes or reductions in December.
On the downside:
- men’s clothing, -4.6% y/y;
- women’s clothing, -5.6% y/y;
- medicinal cannabis, -13.4% y/y;
- air transportation, -14.5% y/y; and
- traveler accommodation, -15.2% y/y.
On the upside:
- books and reading material, +8.6% y/y;
- fabric softener, also +8.6% y/y;
- jewelry, +11.8% y/y;
- natural gas for home usage, +10.0% y/y; and
- travel tours, +21.3%.
(Not Seasonally Adjusted)
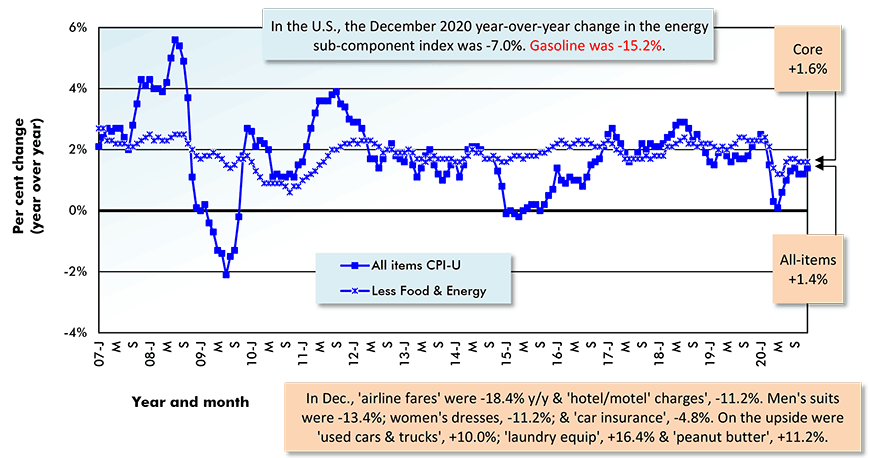
The U.S. figure (CPI-U) is the All Items Consumer Price Index for All Urban Consumers.
*Core inflation is CPI-U less its often most volatile sub-components, food and energy.
Chart: ConstructConnect.
(Not Seasonally Adjusted)
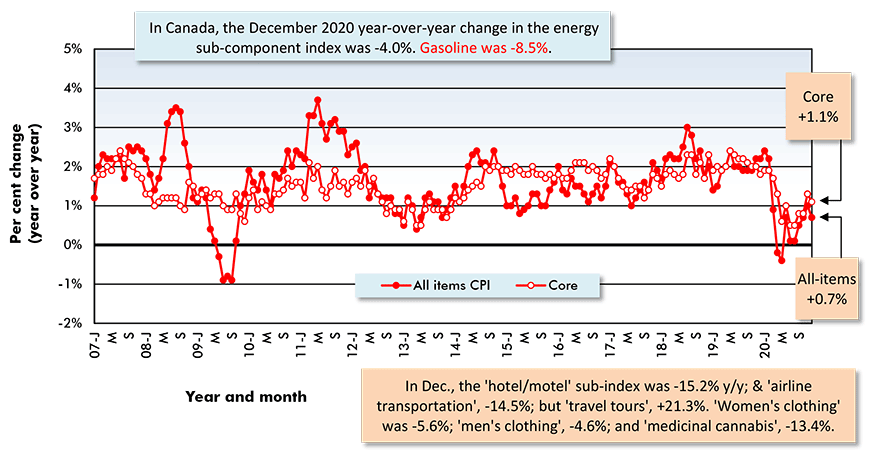
The Canada figure (CPI) is the All Items Consumer Price Index.
*Core inflation is CPI-U less its often most volatile sub-components, food and energy.
Chart: ConstructConnect.
(CPI & CPI-U Not Seasonally Adjusted)
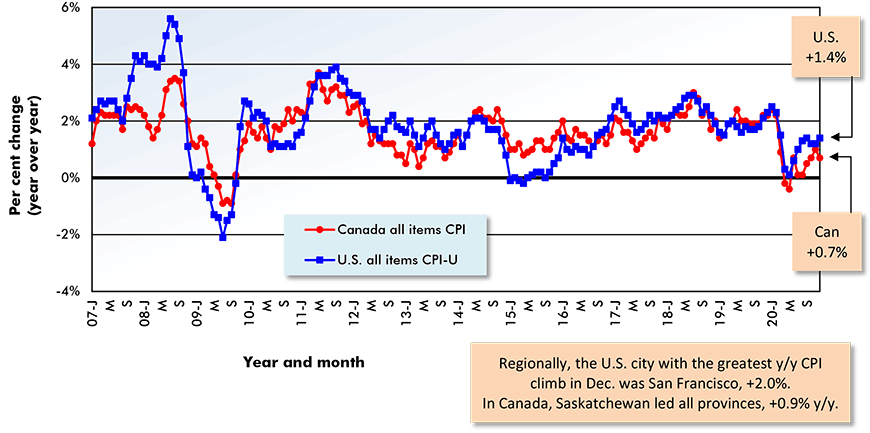
Chart: ConstructConnect.
(CPI Core & CPI-U Less Food and Energy Not Seasonally Adjusted)
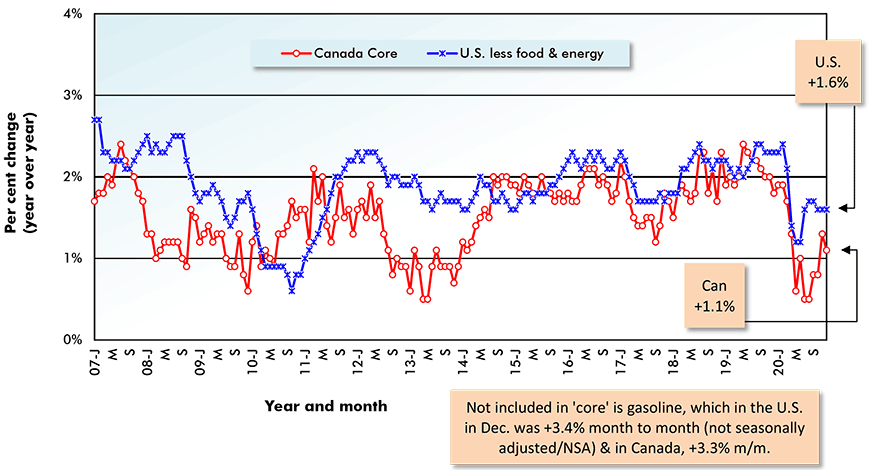
*Core is all-items inflation less its often most volatile sub-components, food and energy.
Chart: ConstructConnect.
Shortages & Career Mobility that is Frustratingly Sticky
For the moment, at least, inflation in the U.S. and Canada remains tame, as it has been for more than a decade. But are forces percolating behind the scenes that will bring it to a boil once again, within a year or two?
Perhaps the chief argument for a coming price flare-up speaks of a surge in demand for goods and services that will overwhelm supply. This draws support from the spike in the savings rate, which at 16.4% in 2020 was two-and-a-half times more than its 30-year annual average.
Eventually, cash reserves accumulated while everyone has been staying home during the pandemic will be released in a torrent of purchases, when the confidence to exit the premises and roam around has been restored once again.
The contrary case rests on there being so much excess capacity in the economy that any temporary shortages that develop will be easily overcome.
Portions of the economy, including residential construction, are doing extraordinarily well. In the latest gross domestic product (GDP) report published by the BEA, the quarter-to-quarter annualized changes in residential investment in Q2 and Q3 2020 were +63.0% and +33.5% respectively. (The comparable ‘non-residential structures’ capital spending figures were -17.4% and +3.0%.)
Evidently, government support payments dispersed throughout the economy have supported solid wage hikes. Average hourly and weekly year-over-year earnings for all U.S. jobs in December 2020 were both slightly above +5.0%.
Admittedly, the +5.0% advance is partly because many low wage earners, with traditionally more tenuous employer-employee working arrangements, have lost their positions and are no longer part of the y/y ‘all jobs’ compensation calculation.
Nevertheless, wages do appear to be on the move again and will receive further impetus from deglobalization efforts and measures likely to be taken by the new administration in Washington.
There’s the fond hope that labor shortages in one corner of the economy (e.g., residential construction) can be rectified by moving newly freed workers (e.g., in accommodation and food & drink services) over from another.
The reality, though, is that such ‘career’ mobility usually proves to be frustratingly sticky.
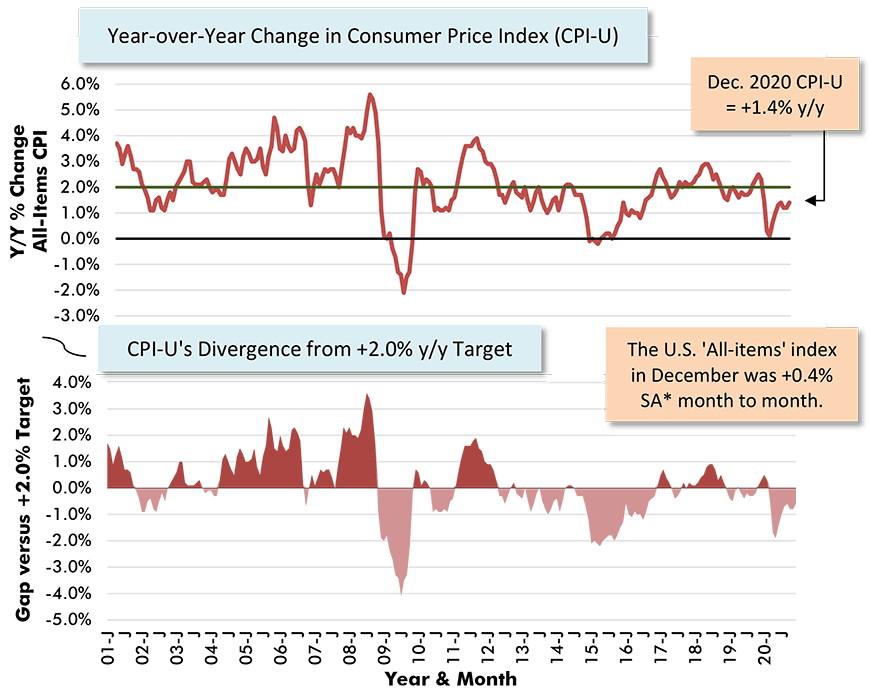
CPI-U is for ‘All Urban Consumers, U.S. City Average’. A desirable rate of inflation is around +2.0% y/y.
Latest data points are for December, 2020.
Chart: ConstructConnect.
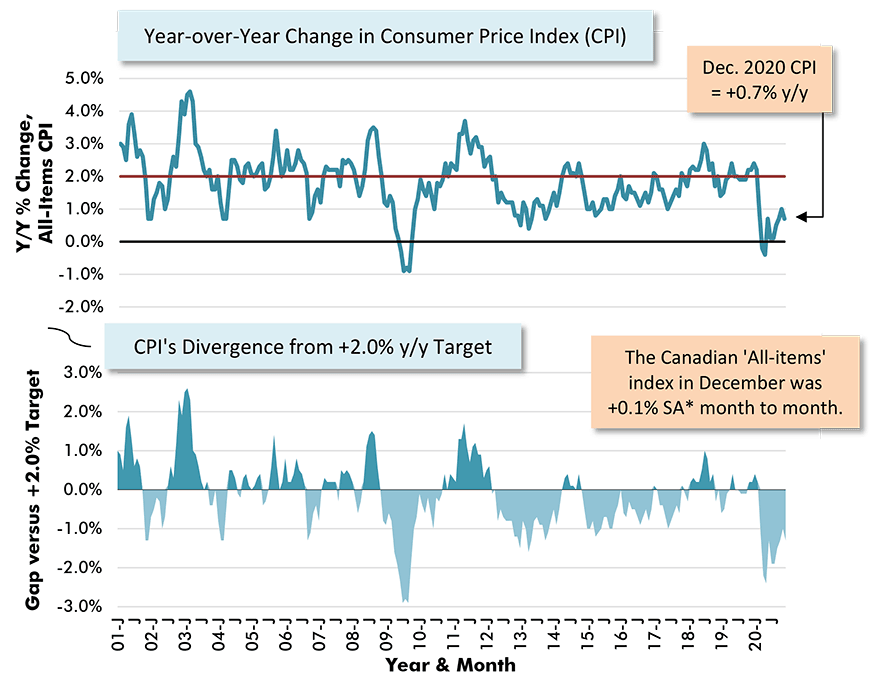
For a variety of reasons, there is a desirable rate of inflation and it’s around +2.0% y/y.
Latest data points are for December 2020.
Chart: ConstructConnect.
Alex Carrick is Chief Economist for ConstructConnect. He has delivered presentations throughout North America on the U.S., Canadian and world construction outlooks. Mr. Carrick has been with the company since 1985. Links to his numerous articles are featured on Twitter @ConstructConnx, which has 50,000 followers.


Recent Comments