
The U.S. ‘headline’ (i.e., for all job categories and seasonally adjusted) unemployment rate is currently 6.2% and it would be easy to pass that level off as not so bad, given all that has transpired. After all, the monthly figure was similarly high as recently as in 2014, not so long ago. In 2013, the monthly jobless rate averaged 7.4% and while there was a degree of consternation expressed at the time, everyone simply got on with business as usual.

The current 6.2% U rate, however, comes with another reading on labor markets that sheds a whole different light on matters. The period 2013-14 was five years after the 2008-09 world financial crisis, often referred to as The Great Recession. In the 2008-09 slowdown, the weekly initial jobless claims number rose to a peak of 655,000, which seemed disastrous.
A year ago, in mid-March 2020, the weekly initial jobless claims number soared close to 7.0 million. It quickly receded from that exaggerated position, but it has remained stuck at an excessive amount, nonetheless. In fact, it has been above 655,000 for 51 weeks in a row.
After 2008-09, it took years to see initial jobless claims gradually come down. It was a banner moment when they crossed below 300,000. They eventually touched bottom at 200,000. As for where such claims stand now, and their recovery path, the journey to a happier place hasn’t truly even started.
With the foregoing as backdrop, there are the following additional nuggets to be gleaned from the latest private and public agency data releases.
(1) Perhaps of most concern to the construction industry of late have been some big jumps in material costs. From February’s Producer Price Index (PPI) series compiled by the Bureau of Labor Statistics (BLS), the largest year-over-year input cost hikes have been recorded by: softwood lumber, +79.7%; plywood, +44.1%; particle board and oriented strand board (OSB), +62.5%; steel bars, plates and structural shapes, +15.2% (driven upwards by iron and steel scrap, +45.7); copper wire and cable, +18.2%; and diesel fuel, +36.5%.
(2) When latest-three-month percentage changes are examined as well, the list of construction materials showing significant cost-increase tendencies expands to include: steel pipe and tube, +10.3%; prefabricated metal buildings, +9.6%; asphalt, +34.0%; and regular unleaded gasoline, +39.1%. There will also be flow-through impacts from the cost of aluminum mill products moving +7.5% over the past three-month period.
(3) Among the PPI series are several that cover all new construction and its major type-of-structure components. The ‘inputs to all new construction’ PPI index is currently +10.0% y/y, with residential contributing more of an upwards bias, at +11.2%, than nonresidential, +8.6%. Among nonresidential sub-sector series, the two registering the strongest input cost advances are healthcare structures, +8.7%, and educational, +9.5%.
(4) BLS also publishes a ‘final demand construction’ index which includes not only material, but also labor costs, plus margins and other expenses (e.g., loan carrying costs). In effect, it provides insight into bid prices. And the story is not upbeat. The year-over-year change in construction’s ‘final demand’ index is presently barely positive, +1.0%. The inference is that contractors, struggling to win work from a smaller pool of potential projects, are ‘eating’ their cost hikes, in the hope that their disappearing-profit dilemma will be temporary.
(5) With so much emphasis these days on jobs creation, I’d like to lay out one area of the economy where structural declines in employment appear to have become firmly embedded, versus another area where ongoing growth seems nearly assured. The former is ‘resources’; the latter can be characterized as ‘new wave’. Graph 1 shows employment levels in oil and gas extraction, logging, coal mining and ‘metallic and non-metal mineral mining’. From none of the four curves, is one left with the impression there will be outstanding buoyancy any time soon.
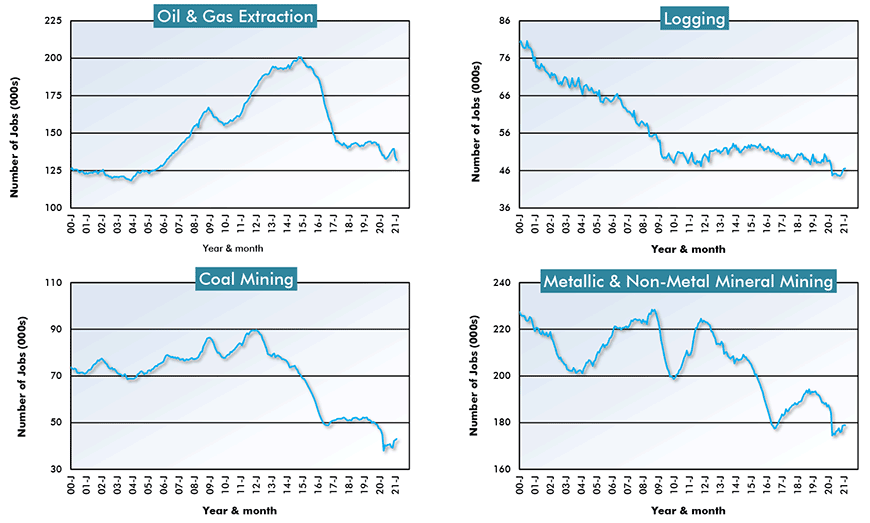
Charts: ConstructConnect.
(6) The second cluster of four graphs features jobs in ‘investigating and security services’, ‘pharmaceuticals and medicines’, ‘software publishing’ and with ‘couriers and messengers’. Upon seeing the steeply rising curves in Graph 2, one’s gut reaction is almost sure to be, “That’s more like it!” I will say, though, that I’m not entirely sure how auspicious a sign it is that security services employment has generally been taking off over many years, although even it suffered a setback last spring when coronavirus infections first settled in.
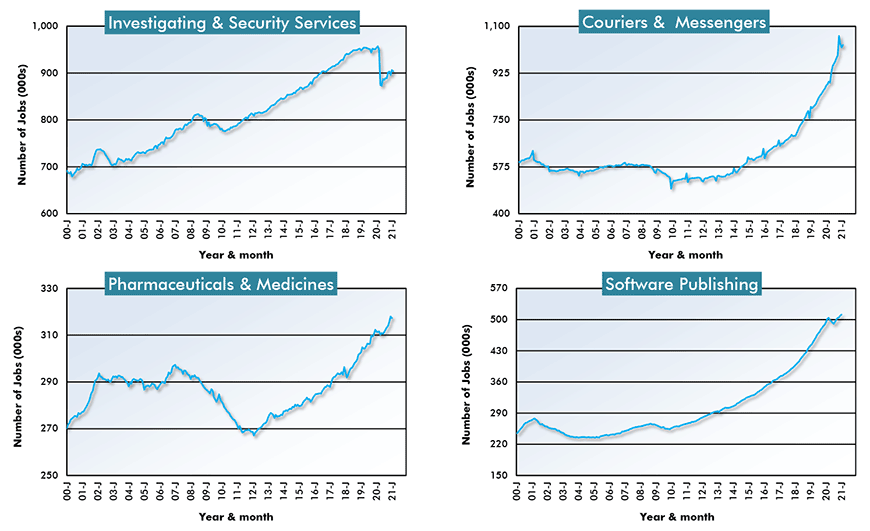
Charts: ConstructConnect.
(7) According to ConstructConnect, the ten U.S. cities with the highest dollar volumes of nonresidential building construction starts last year were: New York, $7.9 billion, but -40.8% versus full year 2019; Houston, $7.5b, but -27.8%; Chicago, $6.2b, but -3.7%; Phoenix, $5.1b and +2.9%; Dallas, $5.0b, but -41.9%; Atlanta, $4.8b, but -52.6%; Austin, $4.7b, but -31.6%; St. Louis, $4.5b and +141.4%; Washington, $4.3b, but -22.6%; and Los Angeles, $4.0b, but -35.6%. You’ll notice that only two of the ten cities pulled off year-over-year gains, as total U.S. nonresidential building starts in 2020 were -29.9% compared with 2019.
(8) In Canada, the leading four cities for nonresidential building starts in 2020 were: Toronto, $7.3b and +36.9%; Ottawa-Gatineau, $3.3b and +29.6%; Montreal, $2.6b, but -47.9%; and Vancouver, $1.2b, but -53.7%. If U.S. and Canadian cities were combined in a ranking, Toronto’s $7.3 billion would position it in third place, after Houston, but ahead of Chicago.
(9) Last year, America’s five frontrunner cities for engineering starts were: Seattle, $5.1b and +20.7%; Los Angeles, $4.9b and +199.1%; Houston, $4.8b, but -27.7%; Dallas, $4.4b and +68.2%; and Chicago, $3.8b, but -30.7%. The country-wide performance in engineering groundbreakings, by dollar volume, was -19.0% year over year.
(10) Canada is not getting the coronavirus vaccine roll-out right. Coverage of the population to date has been well below many other countries, including the U.S. But what Canada has been doing right is restoring employment since the collapse in February-April of last year. While the U.S. jobs claw-back ratio has been little more than half, Canada’s recovery rate now sits at 80%. Canada’s manufacturing sector has fully restored employment to its pre-pandemic level. The public sector in Canada currently has a payroll count that not only matches what it was before the arrival of COVID-19 but goes beyond by +100,000 jobs.
(11) Interestingly, though, in a nation where strong population growth is taken for granted, due to usually steady streams of immigrant arrivals, the latest quarter-to-quarter change (Q3/Q2 2020) in Canada’s resident count was zero. According to Statistics Canada, there’s been no comparable period of weakness going back to at least 1946 when consistent quarterly data was first calculated and issued. Sci-fi has long speculated on what would happen if the world were to shut down due to a health crisis. One major expected outcome of border closures has just been confirmed.
Table 1: U.S. and Canadian Jobs Markets – February 2021
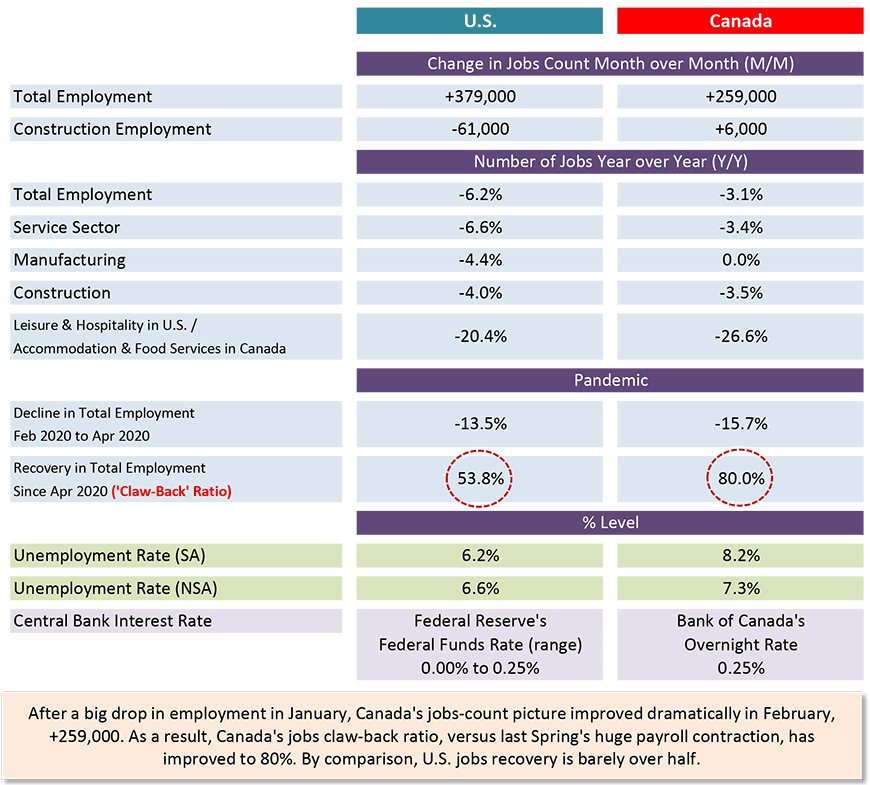
U.S. labor data is from a ‘payroll survey’ / Canadian labour data is from a ‘household survey’.
Canadian NSA unemployment rate ‘R3’ is adjusted to U.S. concepts (i.e., it adopts U.S. equivalent methodology).
Table: ConstructConnect.
Please click on the following link to download the PDF version of this article:
Economy at a Glance Vol. 17, Issue 47 – 11 Mid-March Economic Nuggets: Emphasis on Material Costs & Jobs Creation – PDF
Alex Carrick is Chief Economist for ConstructConnect. He has delivered presentations throughout North America on the U.S., Canadian and world construction outlooks. Mr. Carrick has been with the company since 1985. Links to his numerous articles are featured on Twitter @ConstructConnx, which has 50,000 followers.


Recent Comments