In mid-March of last year, the consequences of coronavirus infections stopped being hypothetical, mainly happening elsewhere, and instead became very real as they landed on our doorsteps.

Suddenly, offices were being emptied, with workers trying to set up from home. Social distancing became the new mantra, the economy went into lockdown, borders were closed, and travel ceased.
One of the sectors that suffered immediate and severe damage was the airline industry. Passenger traffic through airports took a hit to a degree never seen before.
Turning off the lights at airports leaves a huge hole in local economies. There’s a vast eco-system that begins to starve. Negatively affected are workers who handle car rentals, taxi and limo drivers, onsite retail and restaurant employees, baggage and cargo handlers, ticket agents, air traffic controllers, flight crews and numerous others working in professional and support roles.
For Contractors, A Special Mega-Project Issue
For the construction industry, there’s a special big issue. Prior to the pandemic, business and tourism travel was assessed to be an ever-growing pillar of the economy. It’s not an exaggeration to say that every major city was working with local airport authorities to expand passenger and freight-handling capacity, often at a projected cost of billions of dollars.
Contractors were seeing mega-sized airport work displayed prominently in upcoming mega project lists.
Graphs 1 and 2, however, offer warnings as they highlight how the outlook has been turned on its head. Graph 1 features daily U.S. airport checkpoint counts taken by the Transportation Security Administration (TSA). Graph 2 is based on data appearing in the Monthly Civil Aviation Statistics report published by Statistics Canada.
Is there really justification for enormous capital expenditures in the field of air travel when the number of people taking to the skies has fallen so dramatically?
Further, it won’t be possible to say the U.S. and Canadian economies have truly returned to normal until the results shown in both graphs greatly improve. Even with an accelerating vaccination program, those days appear some time away.
The major commercial airlines continue to seek government financial help. Thankfully, after flying through strong economic times prior to Spring 2020, most of them entered this latest period of distress with padded balance sheets.
But the challenges for airline executives are many and a new one is making an appearance. After lying dormant for years, the cost of jet fuel is taking wing, along with hikes in other fossil fuel prices.
According to January 2021 Producer Price Index (PPI) statistics, the cost of jet fuel may still be down year over year, -25.8%, but in the last six months, it’s +33.3%; and in the latest three months, +42.5%.
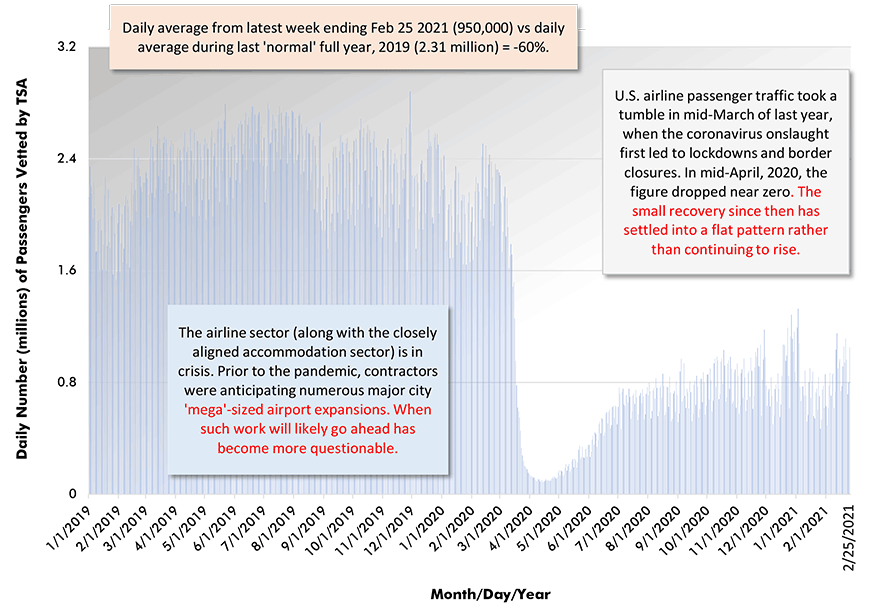
Chart: ConstructConnect.
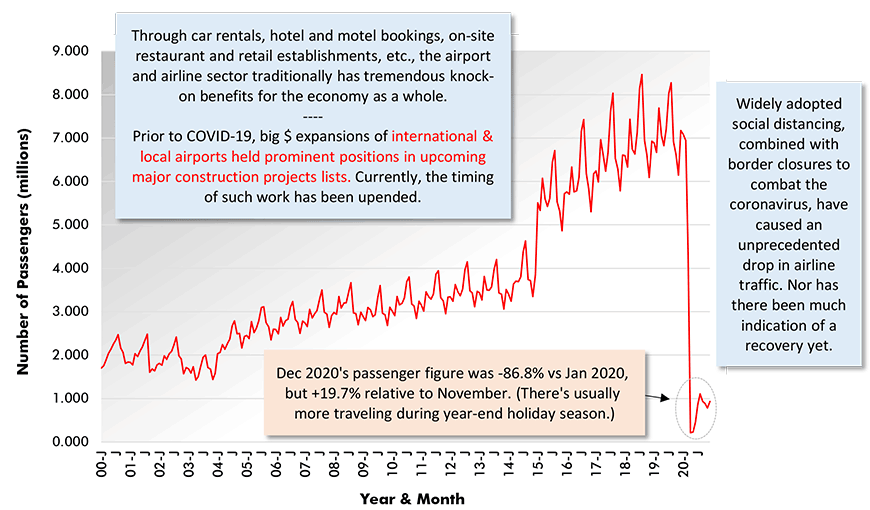
Chart: ConstructConnect.
Please click on the following link to download the PDF version of this article:
Economy at a Glance Vol. 17, Issue 39 – Two Graphs Showing U.S. and Canadian Air Passenger Traffic Deeply Troubled – PDF
Alex Carrick is Chief Economist for ConstructConnect. He has delivered presentations throughout North America on the U.S., Canadian and world construction outlooks. Mr. Carrick has been with the company since 1985. Links to his numerous articles are featured on Twitter @ConstructConnx, which has 50,000 followers.


Recent Comments