
Housing & Share Price Wealth Advances
For the past year, the news has been filled with deeply distressing stories about the coronavirus contagion and sectors of the economy where jobs and earnings losses have been enormous.

Against most initial expectations, however, there’s been one underpinning of the lives of many of us (keeping our fingers crossed) that has gone mainly from strength to strength, the value of our assets. Prices for residential properties have made solid gains and stock markets have been soaring.
Several pandemic-related factors have boosted housing real estate values. (1) The Federal Reserve has kept interest rates inordinately low, stimulating demand. (2) Existing-home owners are staying put, reducing the inventory of properties offered for sale.
(3) Prospective buyers are looking for accommodations with adequate square footage to facilitate the new work-from-home trend. And (4), in some instances, government income relief checks have helped with the accumulation of down payment funding.
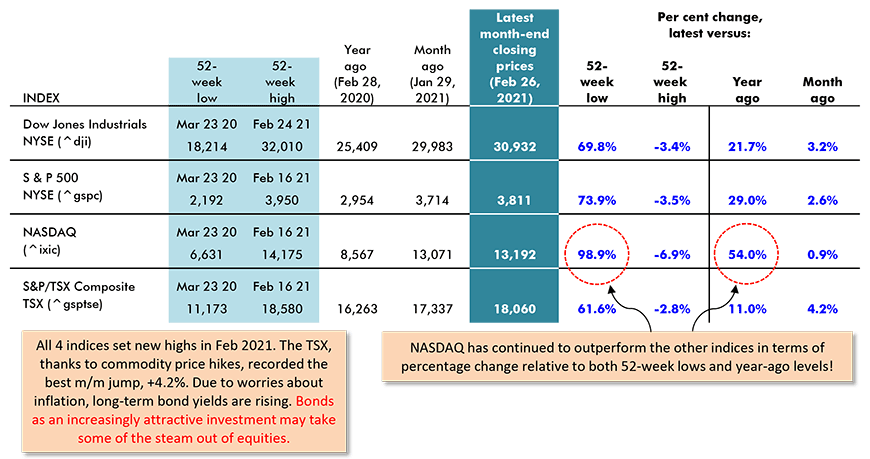
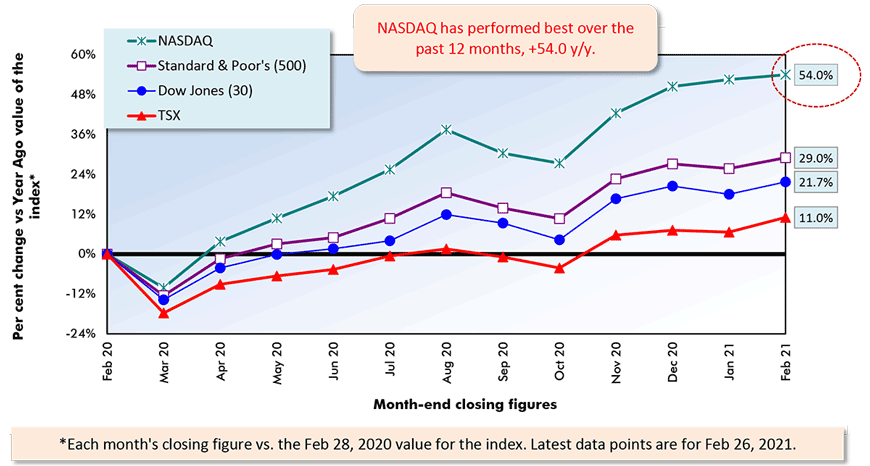
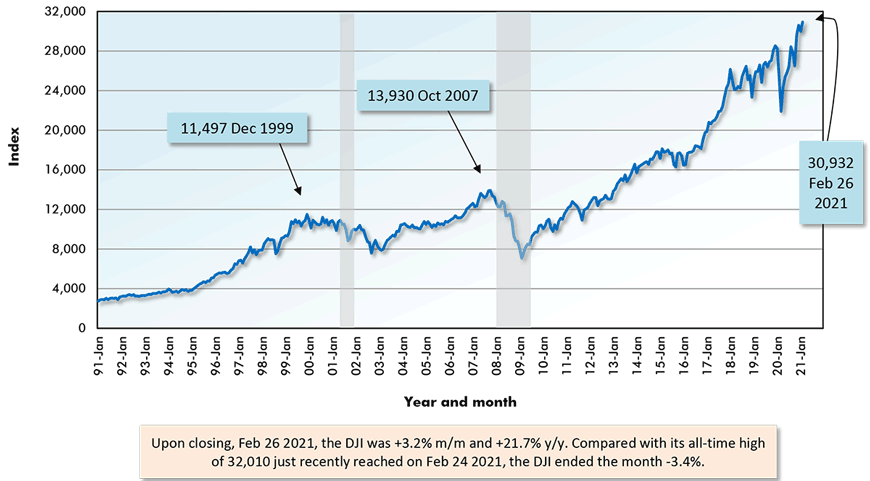
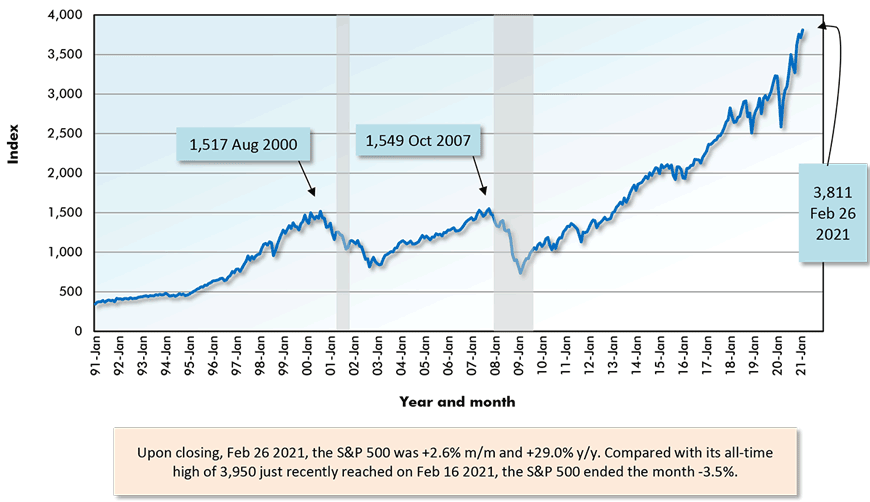
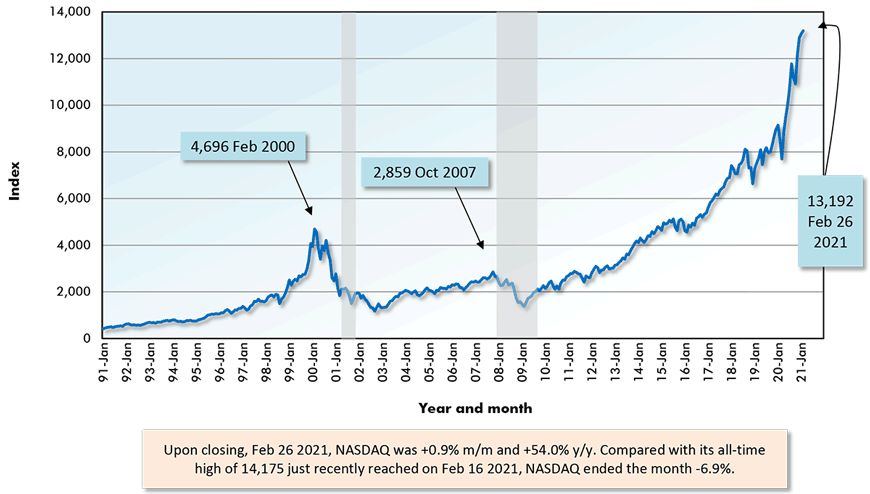
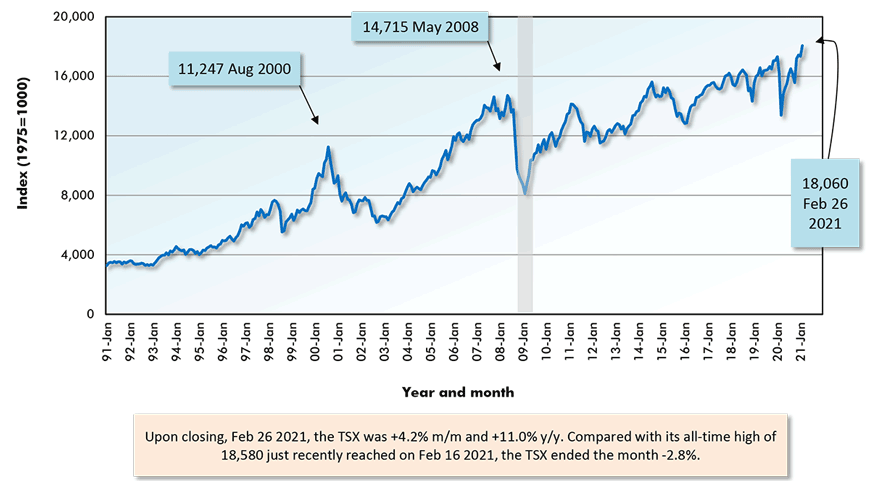
As for equity prices, February 2021 saw new all-time highs attained by the Dow Jones Industrials average, the S&P 500, NASDAQ and the Toronto Stock Exchange. Year over year, as of the latest month’s closing, the DJI was +21.7%; the S&P 500, +29.0%; NASDAQ, an outstanding +54.0%; and the TSX, a modest +11.0%. But it should be added that with commodity prices beginning to revive, the TSX managed a better month-to-month gain in February (+4.2%) than the other four indices.
Also, worth noting (see Table 2), is that NASDAQ’s supremacy for valuation appreciation has been challenged at home by the Russell 2000 firms-with-smaller-capitalizations index (+49.1% y/y) and, internationally, by the iShares MSCI Emerging Markets Asia index (+41.7% y/y).
The Tokyo Nikkei 225 index has been no slouch, either, +37.0% y/y.
Securities Dealers Automated Quotations (NASDAQ), Toronto Stock Exchange (TSE) and Reuters.
Table: ConstructConnect.
Securities Dealers Automated Quotations (NASDAQ), Toronto Stock Exchange (TSE) and Reuters.
Chart: ConstructConnect.
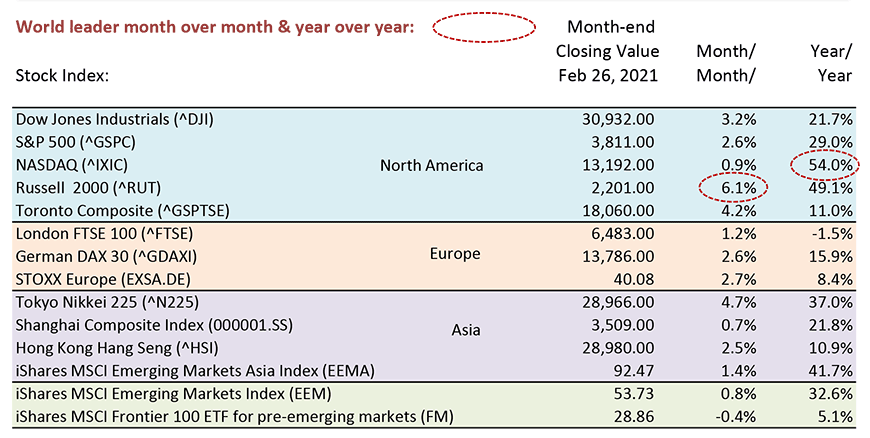
Table: ConstructConnect.
Year over Year as of Month-end Closings, February 26, 2021
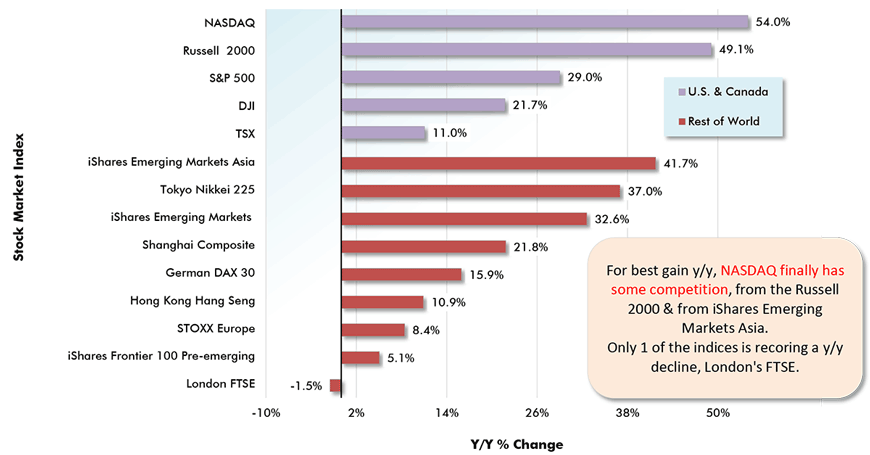
Chart: ConstructConnect.
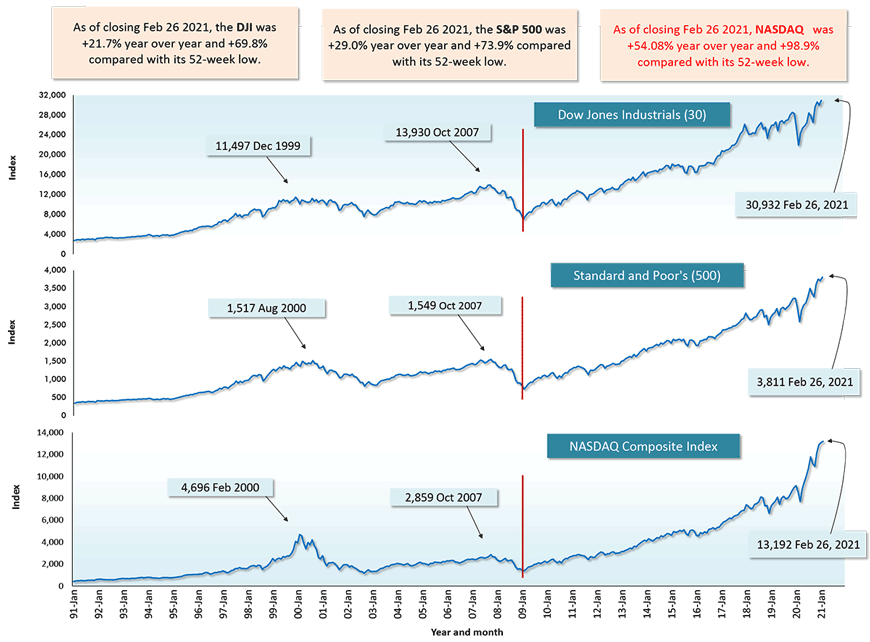
Red vertical lines denote Feb 2009 major ‘troughs’ for the indices.
Securities Dealers Automated Quotations (NASDAQ), Reuters & Yahoo.
Chart: ConstructConnect.
What has Asset Appreciation Meant for Related Jobs?
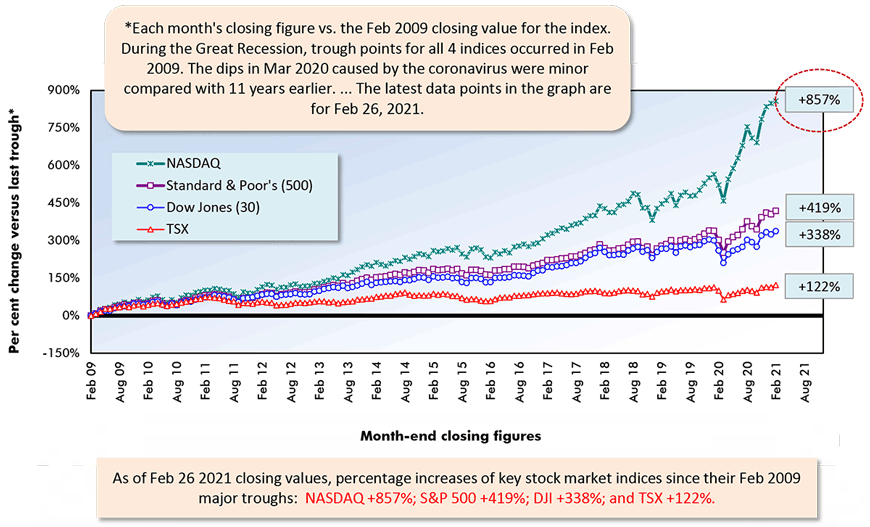
If anyone is in doubt as to how truly amazing U.S. stock market performances have been, they need only look at the results in Graph 4. Over the past dozen years, dating back to February 2009, which was the last major trough period for share prices, the DJI index has climbed +338%; the S&P 500, +419%; and NASDAQ, a stunning +857%.
Surely the improvement in asset valuations means that employment in related areas must be setting the pace among all jobs. No, not necessarily.
In the monthly Employment Situation Report published by the Bureau of Labor Statistics (BLS), there are four broad job categories with close ties to asset management: (1) finance and insurance; (2) real estate and rental and leasing; (3) legal services; and (4) accounting and bookkeeping services.
As of February 2021, the year-over-year number-of-jobs levels have been -5.5% in (2) and -3.1% in both (3) and (4), while staying flat, +0.4%, in (1). There’s a subset of (1) termed ‘securities, commodity contracts, investments, and funds and trusts’, where employment is +1.1% year over year. But the level of such employment, which does relate specifically to stock market activity, is relatively small, just under one million individuals. By way of comparison, its ‘umbrella category, ‘finance and insurance’, employs 6.5 million people.
There would seem to be two factors at play in these disappointing employment results. First, potential customers seeking these services have been able to increasingly access ‘pre-packaged’ help online. Second, the acceleration in the tendency to work from home has taken a toll on the need for in-office support staff.
Securities Dealers Automated Quotations (NASDAQ), Toronto Stock Exchange (TSE) and Reuters.
Chart: ConstructConnect.
Securities Dealers Automated Quotations (NASDAQ), Toronto Stock Exchange (TSE) and Reuters.
Chart: ConstructConnect.
Securities Dealers Automated Quotations (NASDAQ), Toronto Stock Exchange (TSE) and Reuters.
Chart: ConstructConnect.
Securities Dealers Automated Quotations (NASDAQ), Toronto Stock Exchange (TSE) and Reuters.
Chart: ConstructConnect.
Securities Dealers Automated Quotations (NASDAQ), Toronto Stock Exchange (TSE) and Reuters.
Chart: ConstructConnect.
Please click on the following link to download the PDF version of this article:
Economy at a Glance Vol. 17, Issues 43 and 44 – A Strange Pandemic for Asset Valuations: They’ve Gone Up! – PDF
Alex Carrick is Chief Economist for ConstructConnect. He has delivered presentations throughout North America on the U.S., Canadian and world construction outlooks. Mr. Carrick has been with the company since 1985. Links to his numerous articles are featured on Twitter @ConstructConnx, which has 50,000 followers.


Recent Comments