
February’s Labour Force Survey results just released by Statistics Canada record a big gain in employment of +259,000 jobs and an improvement in the ‘headline’ seasonally adjusted (SA) unemployment rate to 8.2% from 9.4% in January.

Canada’s not seasonally adjusted (NSA) ‘R-3’ unemployment rate eased down to 7.3% in the latest month from 8.2% in the prior month. ‘R-3’ adopts the same strict methodology utilized in the U.S. It takes a tougher stance on who is out of work and ‘honest-to-goodness’ looking to be rehired. Therefore, R-3 is an ‘apples-to-apples’ comparison with the 6.6% NSA unemployment rate in America.
Canada’s jobs claw-back ratio, versus the big drop in employment that occurred in the Spring of last year, as the coronavirus contagion forced economy-wide shutdowns, has improved to a not-so-bad 80.0%. At four-fifths, it’s certainly better than the barely half (53.8%) jobs recovery rate in the U.S.
Neither Canadian construction nor manufacturing, however, managed major hiring advances in the latest month. Manufacturing added just +8,000 jobs and construction, a less than sparkling +6,000.
Graph 1: Canada: Month-to-month Total Employment Change
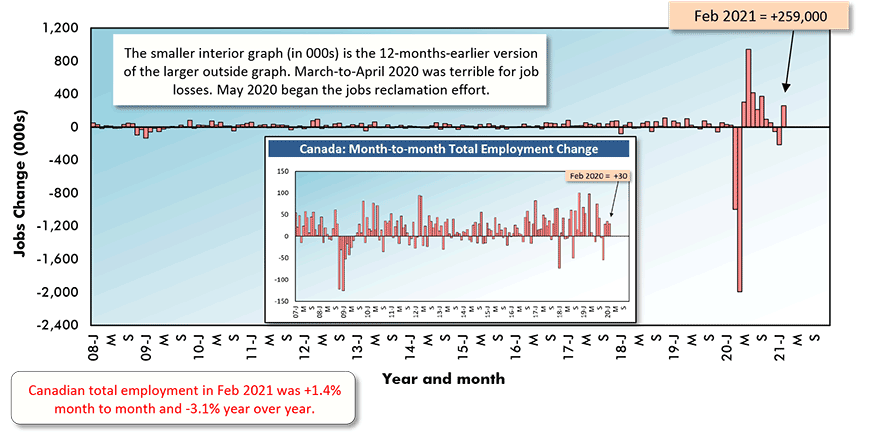
Table: ConstructConnect.
Graph 2: Canada ‘R-3’ Unemployment Rate vs U.S. Unemployment Rate
Not Seasonally Adjusted (NSA) Data (Statistics Canada calculates ‘R-3’ on same basis as U.S. rate)
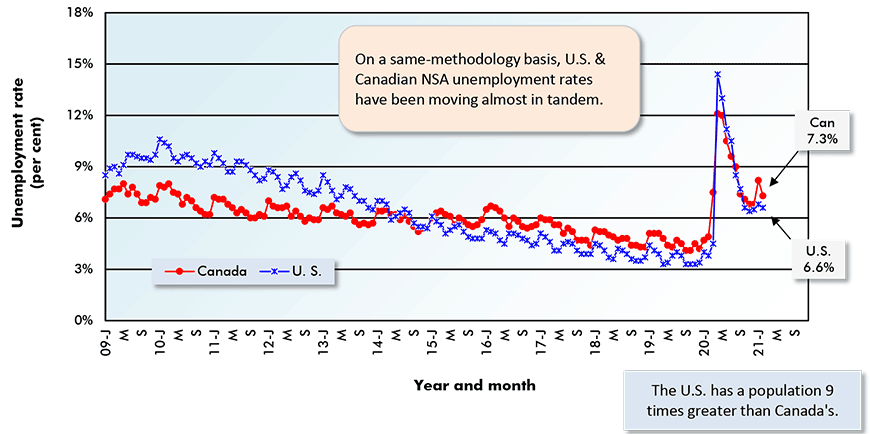
Table: ConstructConnect.
Table 1: U.S. and Canadian Jobs Markets – February 2021
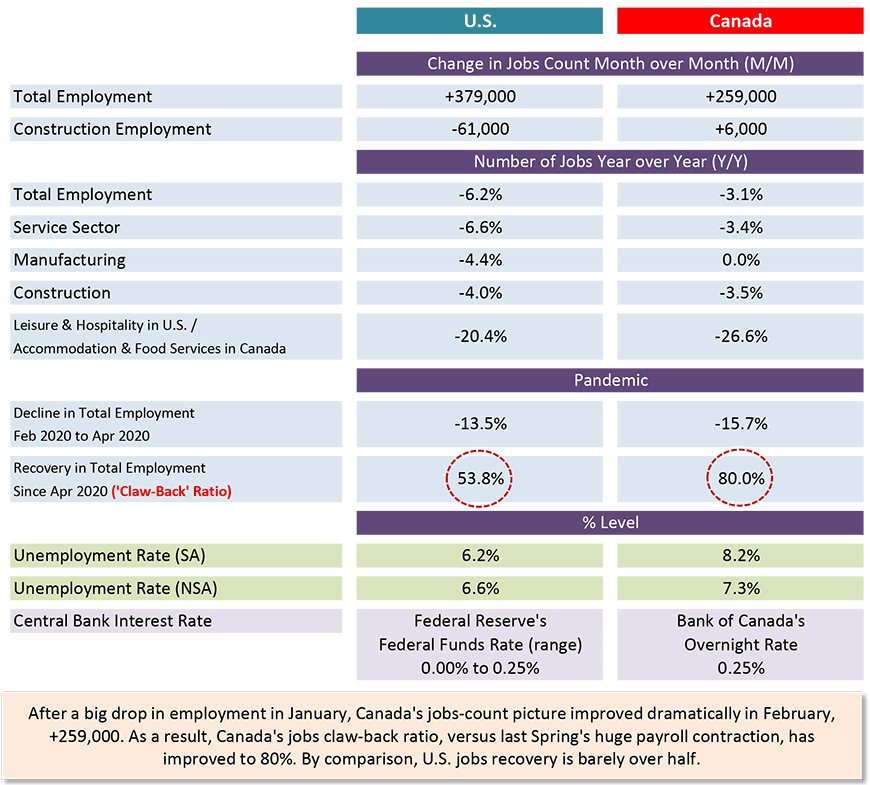
U.S. labor data is from a ‘payroll survey’ / Canadian labour data is from a ‘household survey’.
Canadian NSA unemployment rate ‘R3’ is adjusted to U.S. concepts (i.e., it adopts U.S. equivalent methodology).
Table: ConstructConnect.
Ontario’s Labour Market a Sore Spot
Among provinces, the three best for relatively low unemployment rates in February were Quebec (6.4%), Manitoba (6.8%) and British Columbia (6.9%). Unemployment rates in Ontario and Alberta remained elevated at 9.2% and 9.9% respectively.
There are still no provinces with year-over-year gains in employment. Coming closest are Nova Scotia (-0.4%) and B.C. (-0.6%).
Recently, coronavirus case counts suddenly reared up in Newfoundland and Labrador coincident with deteriorating labor market conditions. But there’s better news on the horizon with the pickup in the global price of oil. Offshore crude is one of the province’s chief export products.
Graph 3: Canada’s Provincial Labour Markets – February 2021
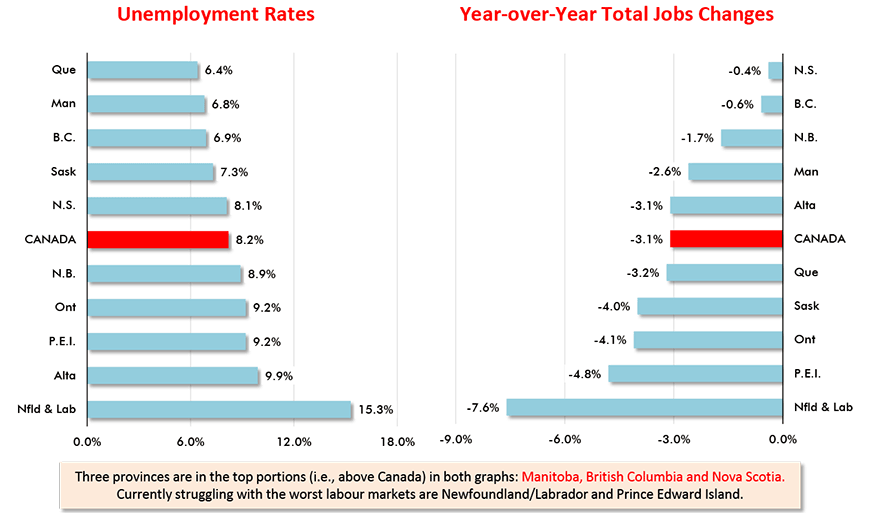
Chart: ConstructConnect.
Not to be Sneezed at Wage Gains
As in the U.S., there are some sizable year-over-year compensation increases occurring in Canada. Average hourly earnings for all employees in February were +4.8% and average weekly earnings, +5.0%.
Statistics Canada separates ‘all’ employees into union and non-union. For the former, the compensation climbs in the latest month were +2.2% both hourly and weekly; for the latter, +5.9% hourly and +6.2% weekly.
The importance of earnings increases relates to how they may rev up inflation, but that’s something that will play out over a longer time frame, say six months to a year from now.
Graph 4: Change in Total Employment – Canada vs U.S.
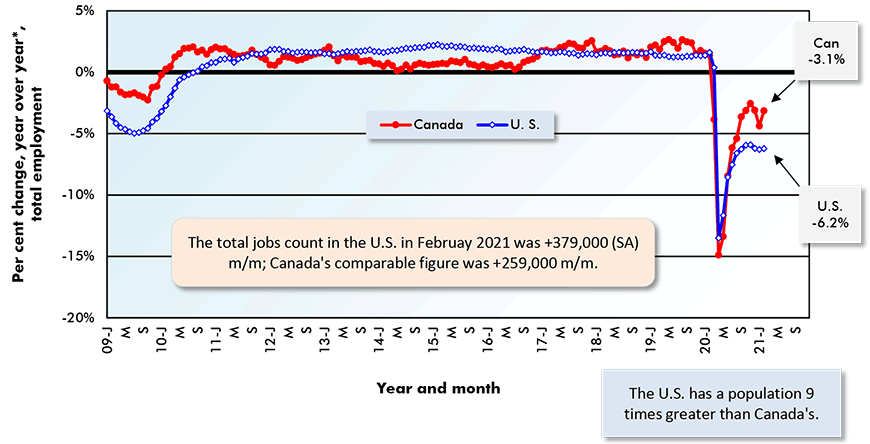
‘Y/Y’ is current month/same month previous year; ‘m/m’ is current month vs prior month.
Table: ConstructConnect.
Table 2: Monitoring the Canadian Employment Recovery ‒ February 2021
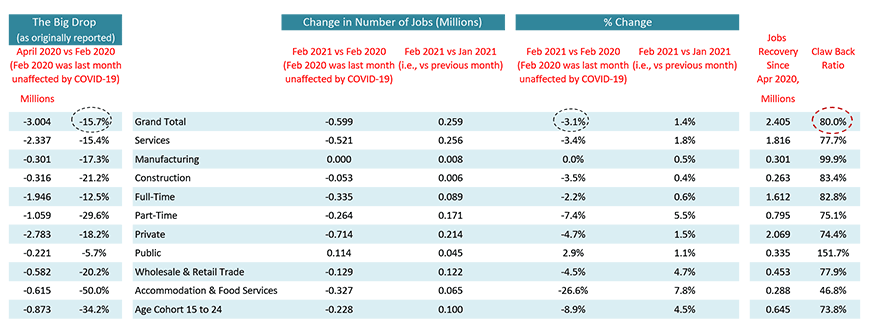
Table: ConstructConnect.
Please click on the following link to download the PDF version of this article:
Economy at a Glance Vol. 17, Issues 45 and 46 – Canada’s February Jobs Jump Shifted Labour Market Closer to ‘Normal’ – PDF
Alex Carrick is Chief Economist for ConstructConnect. He has delivered presentations throughout North America on the U.S., Canadian and world construction outlooks. Mr. Carrick has been with the company since 1985. Links to his numerous articles are featured on Twitter @ConstructConnx, which has 50,000 followers.


Recent Comments