
Permits Still Exceeding Starts
In the U.S., new home building, which seemed set to keep surging, has lost some of its momentum in the last two months. In Canada in February, there was only a minor hesitancy in the headlong rush of residential groundbreakings, due to Toronto ‘playing it cool’.

Let’s look at the U.S. first. After reaching a peak level of housing starts of 1.670 million units in December of last year, the figures have dropped to 1.584 and 1.421 in the latest two months respectively.
The bias of work still leans towards single-family starts, which in February were -8.5% month to month, but +0.6% year over year. Multi-family starts lost support, declining -15.8% m/m and -28.5% y/y.
Regionally, only the West managed percentage-change increases in housing starts both m/m and y/y in February, +17.6% and +15.8%. The Northeast was -39.5% m/m and -2.5% y/y; the Midwest, -34.9% m/m and -29.9% y/y; and the South, -9.7% m/m and -16.6% y/y.
To date in 2021, the South has accounted for half (50.8%) of all housing starts nationally. The West has claimed a share a little bigger than a quarter (27.1%). The other two regions have approximately split the remainder (10.5% for the Northeast and 11.6% for the Midwest).
One shouldn’t become too discouraged by February’s pullback in total U.S. housing starts. Residential permits, which are a leading indicator for starts, have continued strong. In the latest month, they were 1.682 million units, +17.0% y/y (although they were -10.8% m/m).
Over the past 12 months, the number of permits issued in units has exceeded the number of starts, also measured in units, by 100,000.
Climbing Mortgage Rates and Prices Apply a Damper
It seems one can’t talk about housing construction without also delving into the subject of prices.
The Census Bureau’s price deflator for new single-family houses under construction is currently +6.8% year over year. This is likely to move up in even livelier fashion over the next several months given the recent rapid increases in lumber prices.
The Census Bureau’s average sales price for new single-family housing is ahead by +7.8% y/y.
The S&P CoreLogic Case-Shiller 20-city composite price index for resales of existing homes is ahead +10.1% year over year.
Seemingly, slightly increasing mortgage rates and prices that are rising, not yet alarmingly (see next section on Canada), but noticeably nonetheless, are putting a mild and probably temporary damper on the new home building marketplace.
As another indication of the slowdown, the number of months’ inventory of new single-family homes for sale (as tabulated by the Census Bureau) touched a quite low 3.5 in July of last year. By February of this year, the inventory number was up again to 4.8 months.
It should be noted, though, that 4.8 remains tight. The inventory number usually lies between 5.0 and 6.0 months.
Graph 1: U.S. Monthly Housing Starts
Seasonally Adjusted at Annual Rates (SAAR)
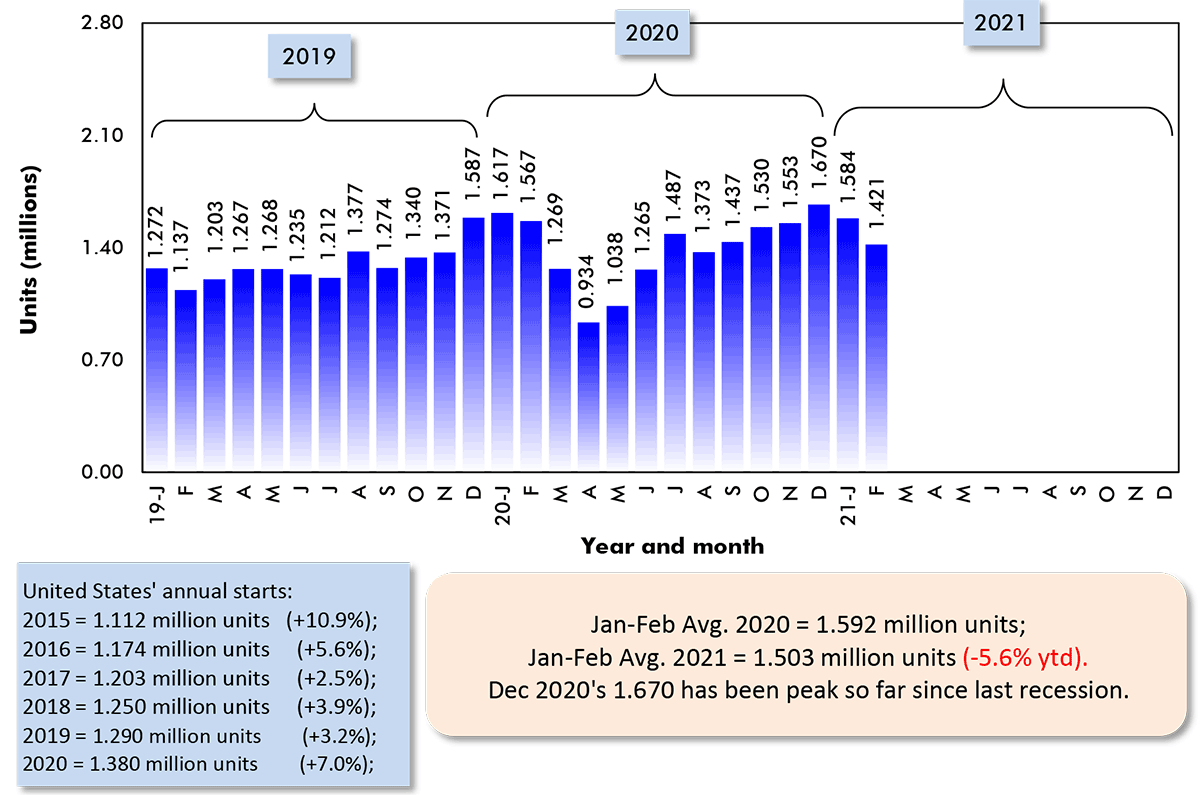
Data source: U.S. Census Bureau (Department of Commerce).
Chart: ConstructConnect.
Graph 2: U.S. Single-Family & Multi-Family Monthly Housing Starts
Seasonally Adjusted at Annual Rates (SAAR)
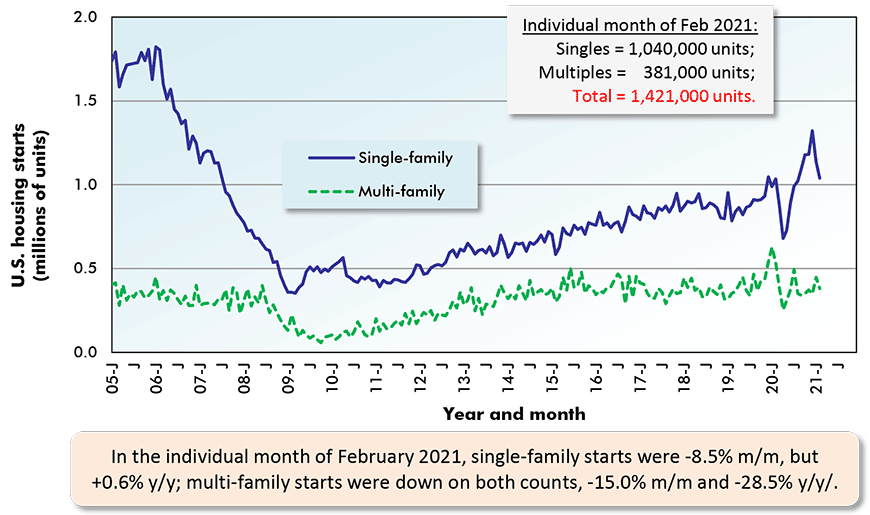
The last data points are for February 2021.
Data source: U.S. Census Bureau (Department of Commerce).
Chart: ConstructConnect.
Graph 3: U.S. Total Monthly Housing Starts
Seasonally Adjusted at Annual Rates (SAAR)
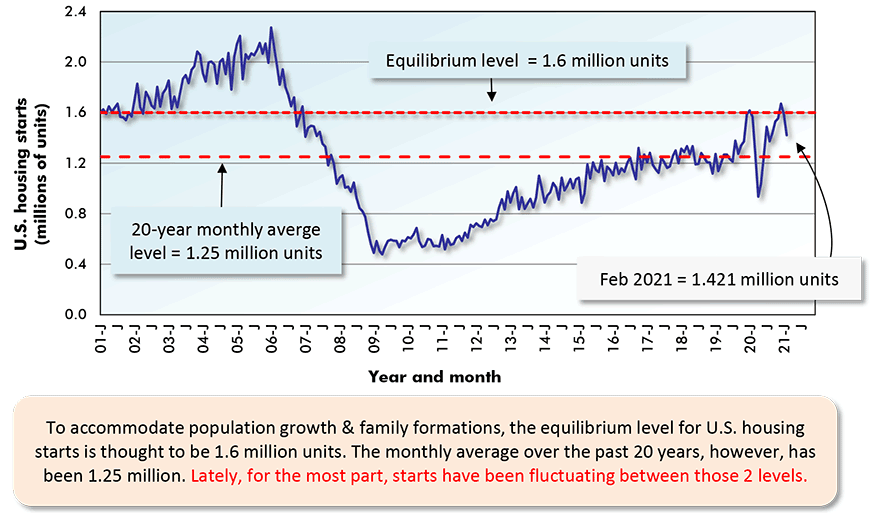
The last data points are for February 2021.
Data source: U.S. Census Bureau (Department of Commerce).
Chart: ConstructConnect.
Graph 4: U.S. Monthly Residential Building Permits
Seasonally Adjusted at Annual Rates (SAAR)
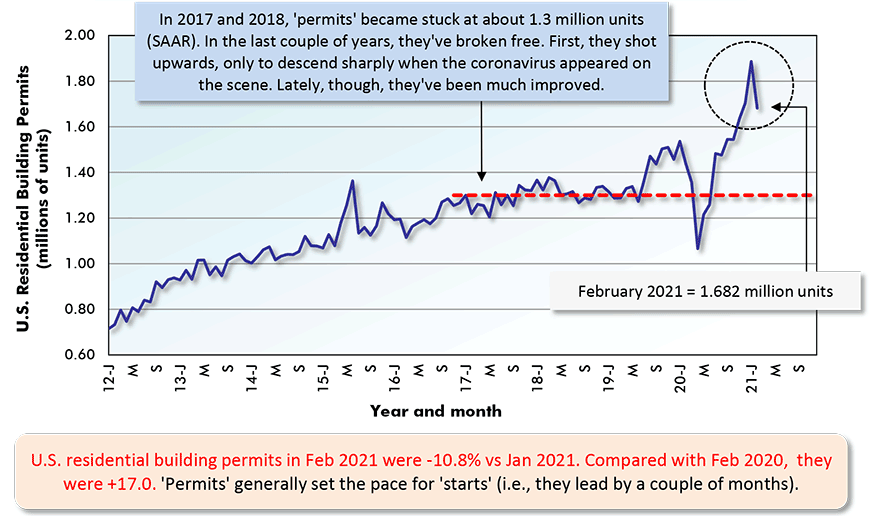
The last data point is for February 2021.
Data source: U.S. Census Bureau (Department of Commerce).
Chart: ConstructConnect.
Graph 5: U.S. Regional Housing Starts
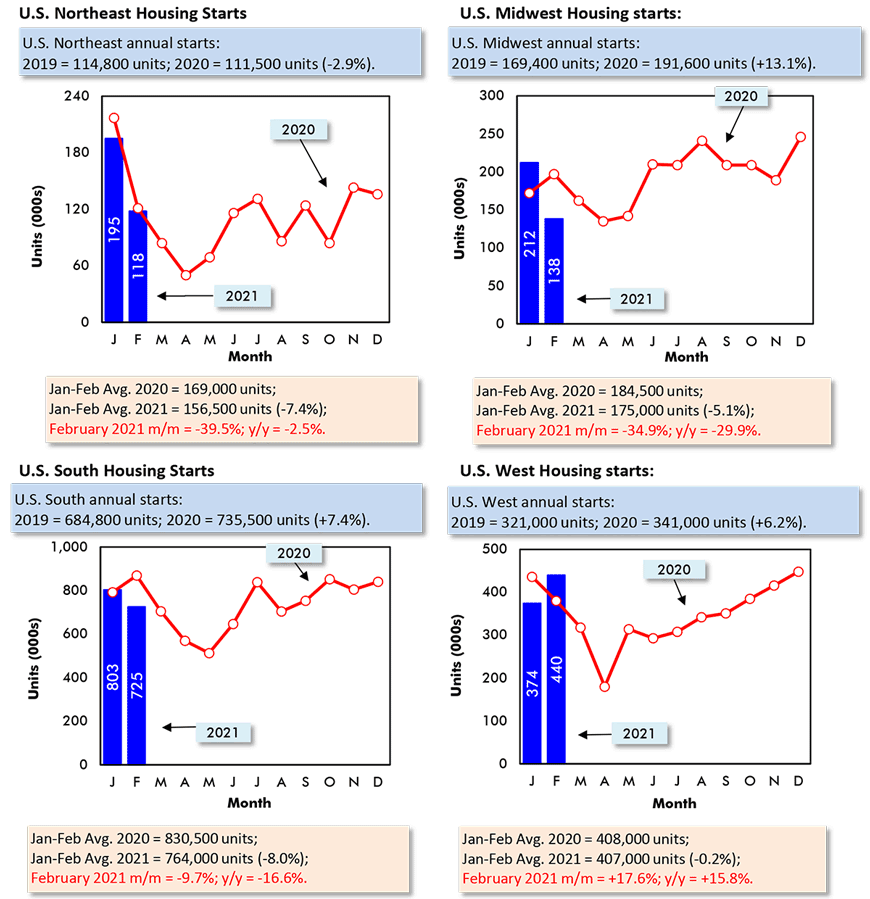
Data source: U.S. Census Bureau (Department of Commerce).
Chart: ConstructConnect.
Graph 6: U.S. Housing Starts
Jan-Feb 2021 vs Jan-Feb 2020 % Changes
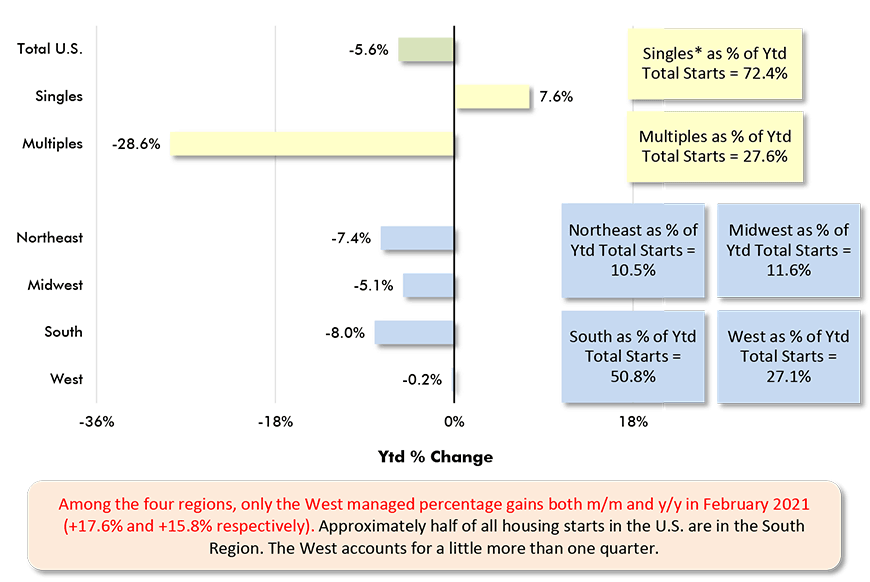
Based on averages of monthly seasonally adjusted and annualized (SAAR) unit starts.
* ‘Singles’ includes townhouse complexes, except when multiple units have common heating & air conditioning.
Data source: U.S. Census Bureau.
Chart: ConstructConnect.
Graph 7: U.S. and Canada Monthly Housing Starts
Seasonally Adjusted at Annual Rates (SAAR)
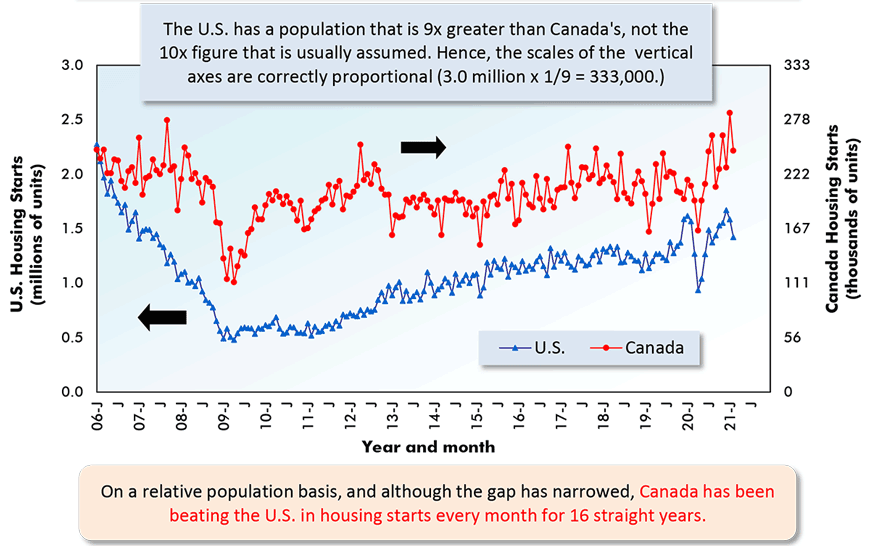
The last data points are for February 2021.
ARROWS: U.S. numbers to be read from left axis; Canadian from right axis.
Data sources: U.S. Census Bureau & Canada Mortgage and Housing Corp (CMHC).
Chart: ConstructConnect.
Canadian Housing Starts Full Steam Ahead, Without Toronto
Canadian housing starts are continuing full steam ahead. In February, it’s true they fell back on a month-to-month basis (-13.5%), but they stayed inordinately high, at 246,000 and +17.1% compared with February of last year.
Their ‘off’ performance m/m was only because January’s level was so exceptionally bullish, 284,000 units, a peak level dating back decades.
Unusually, though, the current strength in Canadian housing starts is coming without help from Toronto.
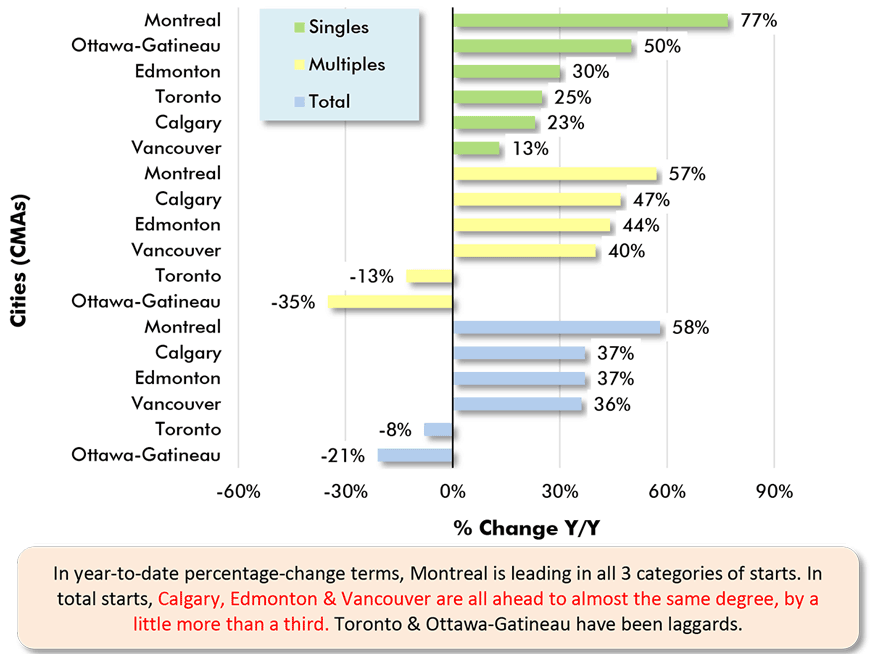
Toronto’s residential groundbreakings have been -8% in total and -13% in the multi-family segment (i.e., condo towers) for which the city has become famous.
Ottawa-Gatineau has also been off its game this year relative to last year. The nation’s capital is experiencing a -21% drop in total housing starts to date in 2021.
Picking up the slack have been Montreal (+58% ytd), Calgary and Edmonton (both at +37%) and Vancouver (+36%).
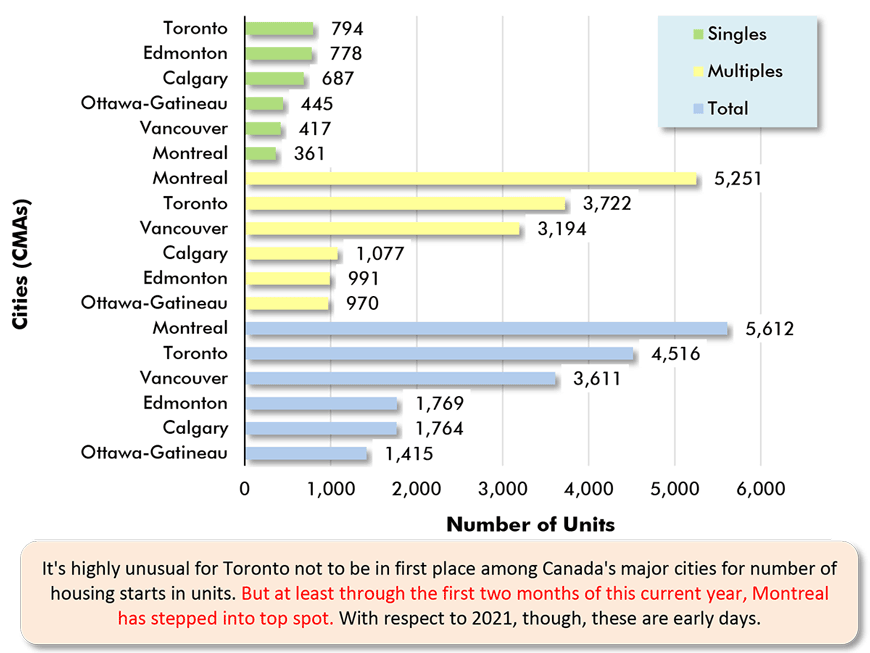
There are 35 census metropolitan areas (CMAs) in Canada. As for total starts in those 35 urban centers, however, the degree of dominance exerted by the nation’s six cities with populations in excess of a million each is rather startling. Toronto, Montreal and Vancouver combine to account for half of the total. Add in Calgary, Edmonton and Ottawa-Gatineau, and the share rises to two-thirds.
Whole World Taking Notice of Canadian House Prices
The whole world is taking notice of what’s happening with the pricing of Canadian housing. According to the Canadian Real Estate Association (CREA), resale home prices nationally are +25.0% y/y.
The number of explanations for why pricing in the Canadian housing market appears to be so untethered from almost all other economic indicators (and it’s been this way for a long time) is lengthy, interesting and only so-so helpful.
Let me offer a possible alternative story. The two primary investment vehicles for individuals are the stock market and real estate. In the U.S., the NASDAQ index has risen by 800% since 2009. In Canada, the ascent of the Toronto Stock market over the same time frame has been a measly +100%.
Canadians, conservative by nature, have pumped money into housing as a supposedly sure bet to realize better capital appreciation than they are likely to see elsewhere.
Graph 8: Canada Monthly Housing Starts
Seasonally Adjusted at Annual Rates (SAAR)
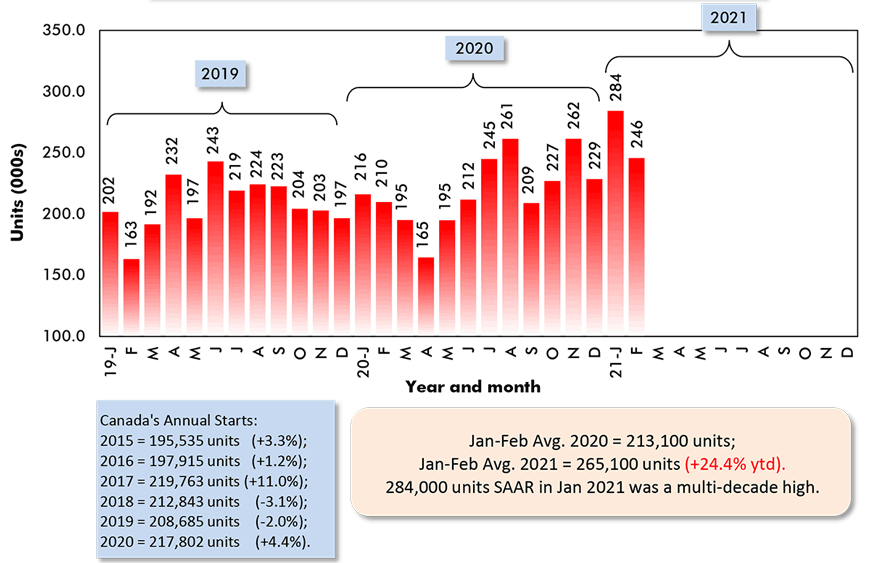
Data source: Canada Mortgage and Housing Corporation (CMHC).
Chart: ConstructConnect.
Graph 9: Percent Change in Year-To-Date Housing Starts –
Ranking Of Canada’s Provinces
(Jan-Feb 2021 vs Jan-Feb 2020)
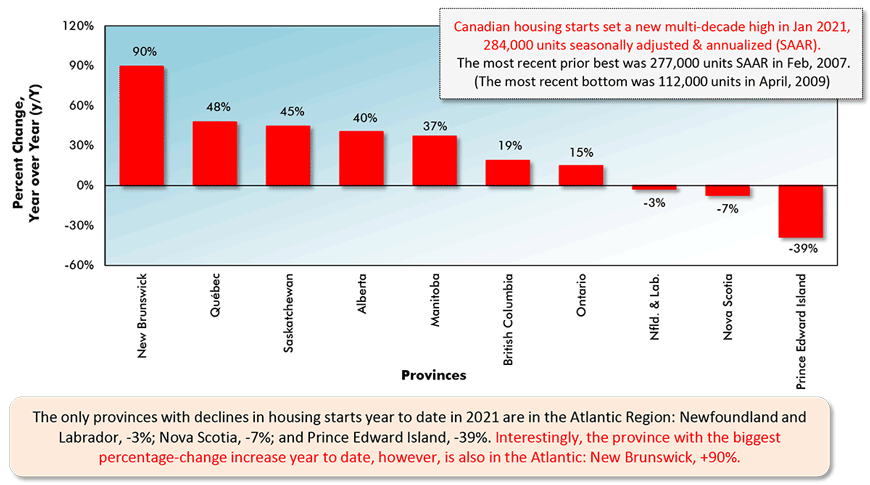
Data source: Canada Mortgage & Housing Corporation (CMHC) based on actuals rather than seasonally adjusted data.
Chart: ConstructConnect.
Graph 10: Percent Change in Year-To-Date Housing Starts –
Ranking Of Canada’s Major Cities
(Jan-Feb 2021 vs Jan-Feb 2020)
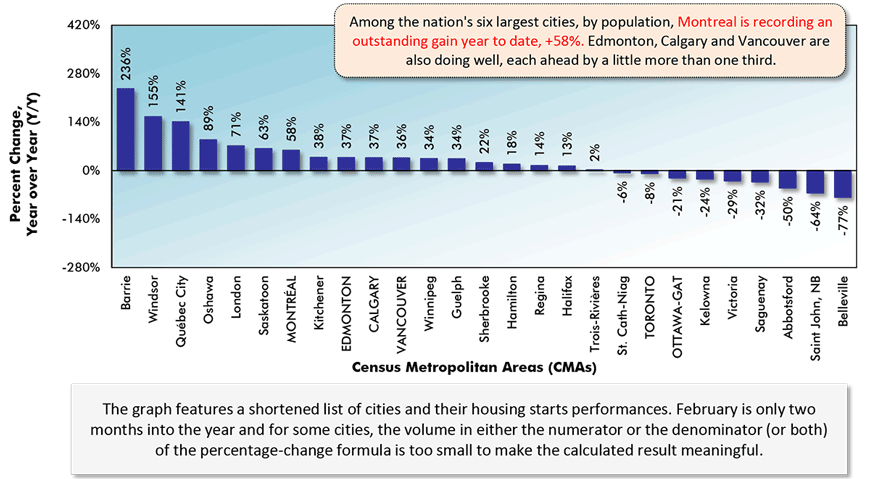
Canada’s Census Metropolitan Areas (CMAs) have core populations of 50,000 plus.
Canada’s 6 CMAs with populations in excess of 1 million are in capital letters.
Data source: Canada Mortgage & Housing Corporation (CMHC) based on actuals rather than seasonally adjusted data.
Chart: ConstructConnect.
Graph 11: Housing Starts in Canada’s 6 Most Populous Cities
January to February 2021 Actuals
Data source: Canada Mortgage & Housing Corporation (CMHC).
Chart: ConstructConnect.
Graph 12: Housing Starts in Canada’s 6 Most Populous Cities
Jan-Feb 2021 vs Jan-Feb 2020
Data source: Canada Mortgage & Housing Corporation (CMHC).
Chart: ConstructConnect.
Please click on the following link to download the PDF version of this article:
Economy at a Glance Vol. 17, Issues 52, 53 and 54 – Housing Starts Catch Breath in U.S., Go Full Steam Ahead in Canada – PDF
Alex Carrick is Chief Economist for ConstructConnect. He has delivered presentations throughout North America on the U.S., Canadian and world construction outlooks. Mr. Carrick has been with the company since 1985. Links to his numerous articles are featured on Twitter @ConstructConnx, which has 50,000 followers.


Recent Comments
comments for this post are closed