Due to its complexity, much of the subject matter concerning the economy requires detailed editorial commentary, often supported by relevant tables and graphs.
At the same time, though, there are many topics (e.g., relating to demographics, housing starts, etc.) that cry out for compelling ‘shorthand’ visualizations.
Whichever path is followed, the point of the journey, almost always, is to reach a bottom line or two.
To provide additional value, ConstructConnect is now pleased to offer an ongoing series of 1,000-word charts.
These will help readers sort out the ‘big picture’ more clearly.
This 1,000-word chart looks at the Census Bureau’s latest put-in-place construction spending numbers, as of February 2021.
Census Bureau’s Latest Put-in-Place Construction Spending Numbers – February 2021
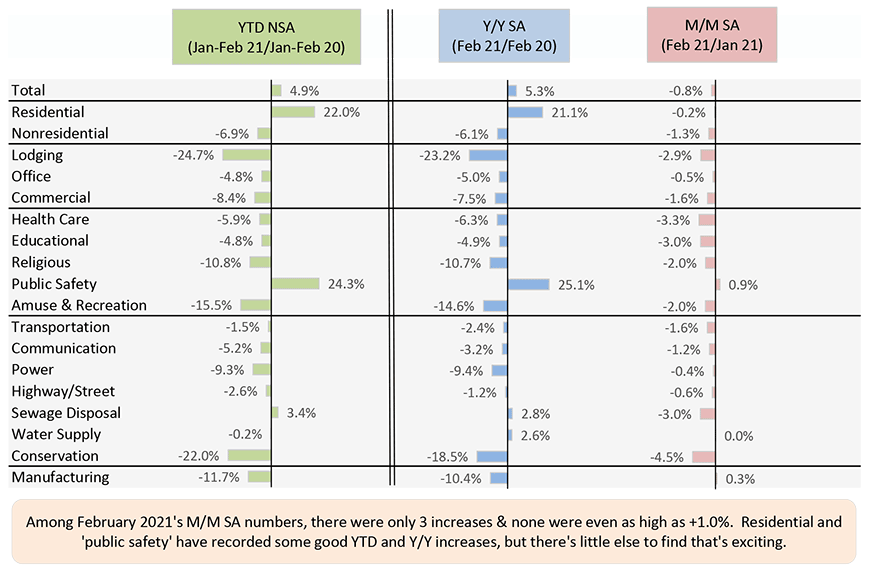
NSA is not seasonally adjusted / SA is seasonally adjusted.
Data source: Census Bureau.
Chart: ConstructConnect.
Chart: ConstructConnect.


Recent Comments