
ConstructConnect-OE’s GDP Projections on the Mark
Government statistical agencies in both the U.S. and Canada have recently been putting the finishing touches to their estimates of gross domestic product (GDP) growth (or, rather, lack thereof) last year.

The most recent calculation of the U.S. GDP contraction in full year 2020 versus full year 2019 places it at -3.5%. During the quarters of last year, Q2 and Q3 displayed the wildest swings, -31.4% q/q annualized, followed by +33.4% also q/q annualized. The fourth quarter closed out the year with a gain of +4.3%, q/q annualized.
‘Annualized’ means taking the quarter-to-quarter change and projecting it out (or, in other words, assuming it holds true) over a full 12-month period. There’s a compounding aspect, but it generally yields a result not much different from multiplying by four.
By the way, the GDP results referred to in this article are based on ‘real’ or ‘constant’ dollars that factor out inflation from ‘current’ dollars.
For Canada, 2020’s GDP results were even more dismal than in the U.S., -5.4% for the full year compared with full year 2019. On a quarterly basis, Q1’s -7.5% (annualized) deteriorated to -38.5% (also annualized) in Q2. But the bounce back in Q3 was prodigious, +40.6%. And Q4’s GDP increase was a sterling +9.6%.
ConstructConnect’s Spring 2021 Forecast Report, published in January of this year, and worked on jointly with Oxford Economics, a world leader in econometric modeling, included 2020/2019 GDP estimates for the U.S. and Canada of -3.5% and -5.5% respectively. It appears those projections were remarkably accurate.
For 2021/2020, our latest numbers on GDP change are +4.2% for the U.S. and +4.0% for Canada. For 2022/2021, the speed in GDP pickup will swing in Canada’s favor, +4.0% to America’s +3.4%. It should be mentioned, though, that +3.0% or more for GDP in any year is praiseworthy.
And how is such strong growth to be achieved? We now turn to the next set of graphs on savings rates.
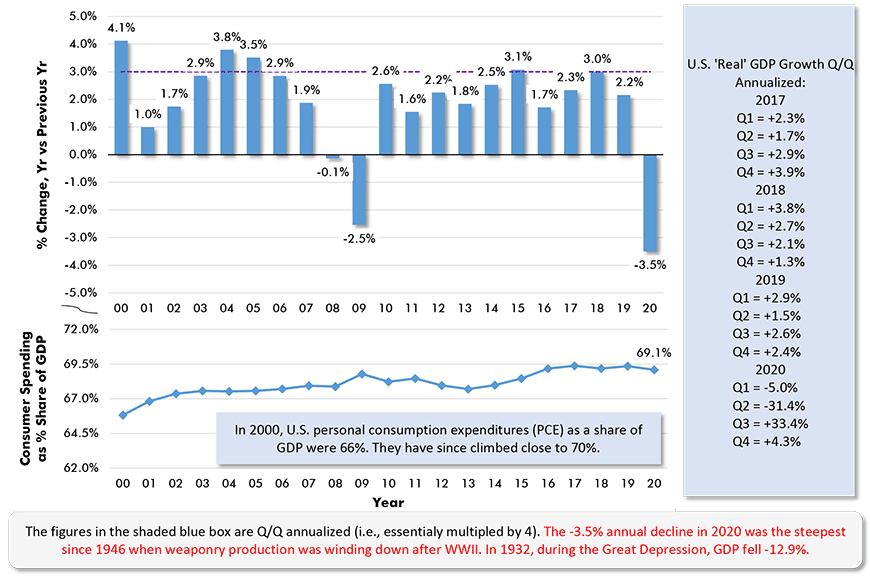
Chart: ConstructConnect.
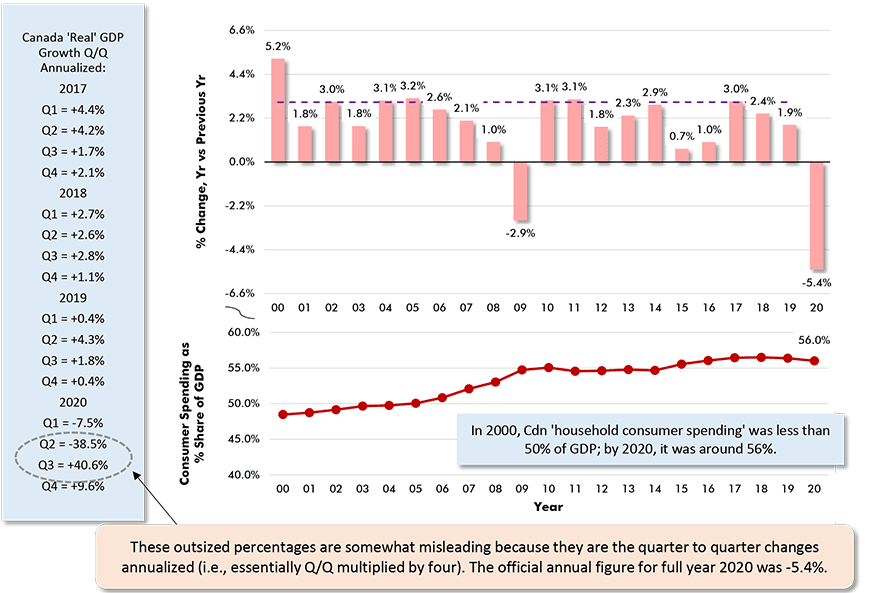
Chart: ConstructConnect.
Savings to Allow Surrender to an Indulgence or Two
To their credit (and for the moment, at least, setting aside concerns about the longer-term consequences of huge public sector debt expansions), Washington and Ottawa have been responsive to the plights of the millions of individuals thrown out of work by the coronavirus crisis. Income support measures and unemployment insurance top-ups have been plentiful.
Total earnings levels nationally have been saved from the devastation that was first feared.
For those workers who have hung on to their employment through the hard times, in some instances there have been nice pay raises to compensate for extra efforts made and more hazardous work conditions encountered.
Additionally, there have not been the same opportunities to spend as freely as in the past. Various waves of lockdowns have cut into the ‘normal’ pleasures of eating out, attending live sporting or concert events, vacationing on some far-off balmier shore and so on.
Consequently, there have been surges in the ‘savings rates’ of the U.S. and Canada and other countries as well, as illustrated in Charts 3 and 4.
With the logistics of vaccine deliveries becoming increasingly efficient, and coverage rippling outwards faster, we’re on the cusp of breaking free from COVID-19’s headlock.
When the breech occurs, the initial partying may be somewhat muted ̶ few of us are going to forget the hazards of the past year overnight ̶ but the means will be available to surrender to an indulgence or two.
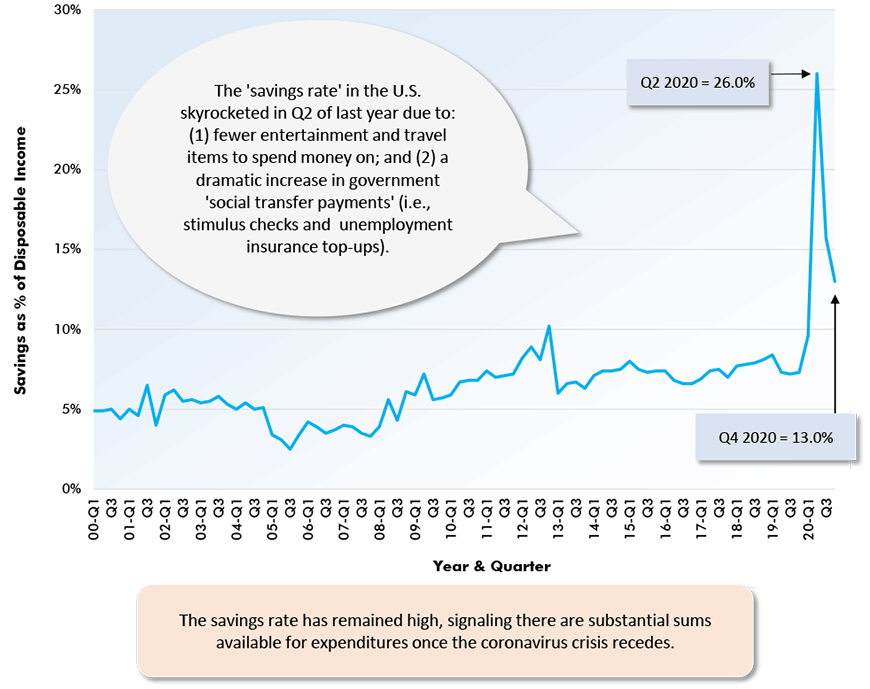
Chart: ConstructConnect.
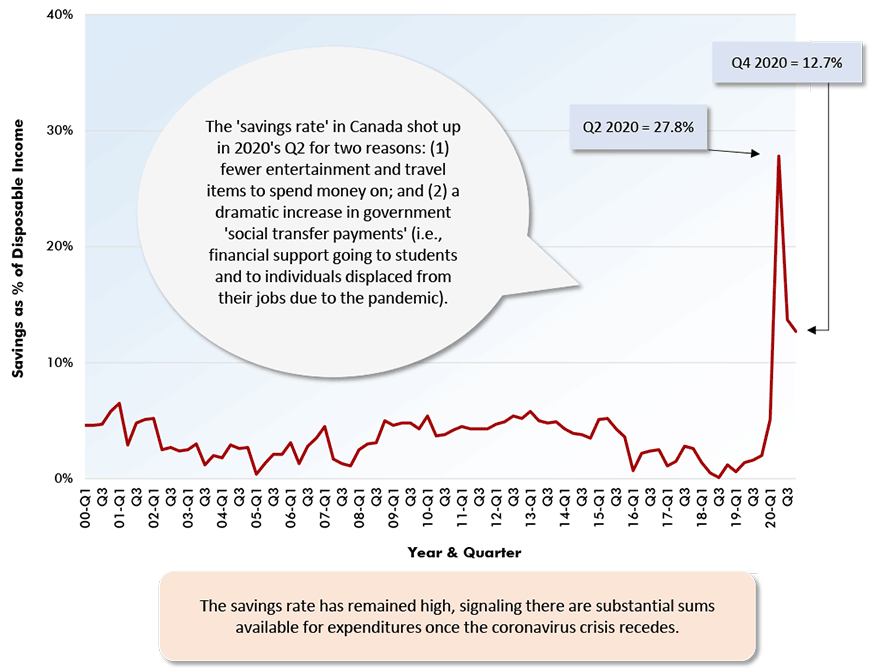
Chart: ConstructConnect.
Please click on the following link to download the PDF version of this article:
Economy at a Glance Vol. 17, Issues 55 and 56 – 4 Graphs that Capture U.S. and Canadian GDP Growth – PDF
Alex Carrick is Chief Economist for ConstructConnect. He has delivered presentations throughout North America on the U.S., Canadian and world construction outlooks. Mr. Carrick has been with the company since 1985. Links to his numerous articles are featured on Twitter @ConstructConnx, which has 50,000 followers.


Recent Comments