
A Number to Embrace with Enthusiasm
April’s Employment Situation report, released today by the Bureau of Labor Statistics (BLS), records an increase in total U.S. employment of +266,000 jobs month to month. While plus a quarter of a million net new jobs seems, on first blush, to be an impressive figure, Graph 1 makes clear that it registers as only a minor blip in the context of the employment swings we’ve been seeing over the past 14 months.

Furthermore, due to a slight uptick in the participation rate, from 61.5% in March to 61.7% in April, the seasonally adjusted (SA) unemployment rate in the latest month deteriorated to 6.1% from 6.0% in the prior month.
But there is one number on the jobs front to be embraced with enthusiasm. The ‘leisure and hospitality’ sector has been bearing the brunt of the economic downturn initiated by the coronavirus infection outbreak last year. Finally, a turning point appears to have been reached.
Coincident with the aggressive vaccine rollout and timed to greet warmer and healthier summer weather, bars and restaurants have dramatically changed tack. In April, staffing in the sector shot ahead by +331,000 jobs. The year-over-year increase in ‘leisure and hospitality’ employment was +69.1%.
Such an outsized percentage-change figure highlights an effect we’ll be seeing for months to come. Because of the big drop in jobs in March-April of 2020, comparisons of the current year with last year will benefit from a low base (i.e., low denominator) in the math calculation.
Seeing large percentage gains in employment will be a confidence booster. For example, total U.S. employment in April was +10.9% y/y. In services, the y/y jobs jump was +14.0%; in manufacturing, +7.6%; and in construction, +14.0%.
Graph 1: U.S.: Month-to-month Total Jobs Creation
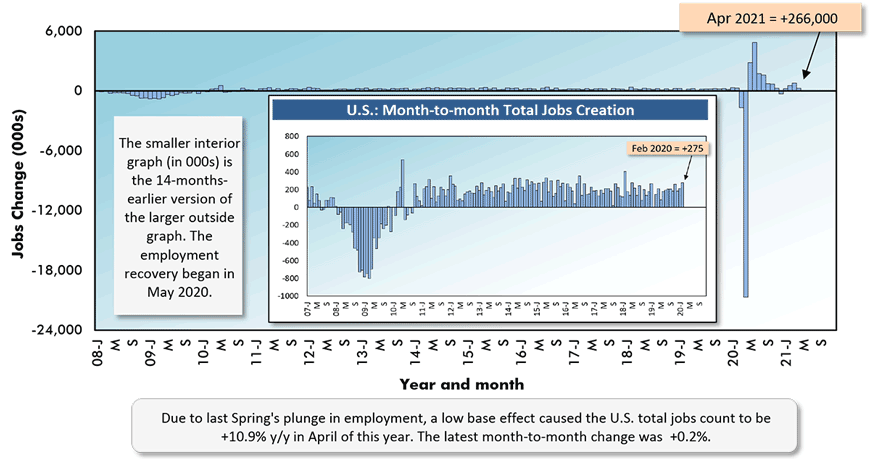
Chart: ConstructConnect.
Construction Jobs Flat, but Pay Soars
In the individual month of April, construction employment stayed flat. Graph 2 sets out employment change in construction by types of structure and general versus sub-trade contractors. The only significant movement in jobs in April was the shedding of 12,000 positions by sub-trade firms engaged in nonresidential construction activity.
The not seasonally adjusted (NSA) unemployment rate in construction in April, however, improved to 7.7% from March’s 8.6% and it was less than half April 2020’s 16.6%.
And the somewhat tighter labor market for construction workers has been accompanied by a reversal in year-over-year compensation rates realized versus ‘all jobs’. Previously, construction workers were trailing; now they’ve moved out front.
The ‘all jobs’ wage hikes calculated by the BLS for the latest month were +0.3% hourly and +2.7% weekly. Construction workers did considerably better at +3.8% hourly and +7.1% weekly.
Leaving out supervisory personnel, the ‘all jobs’ y/y earnings climbs in April were +1.2% hourly and +3.9% weekly. Construction workers (excluding bosses) saw their pay checks rise by +5.3% hourly and +9.4% weekly.
Graph 2: Change in Level of U.S. Construction Employment, Month to Month (M/M) −
Total & by Categories – April 2021
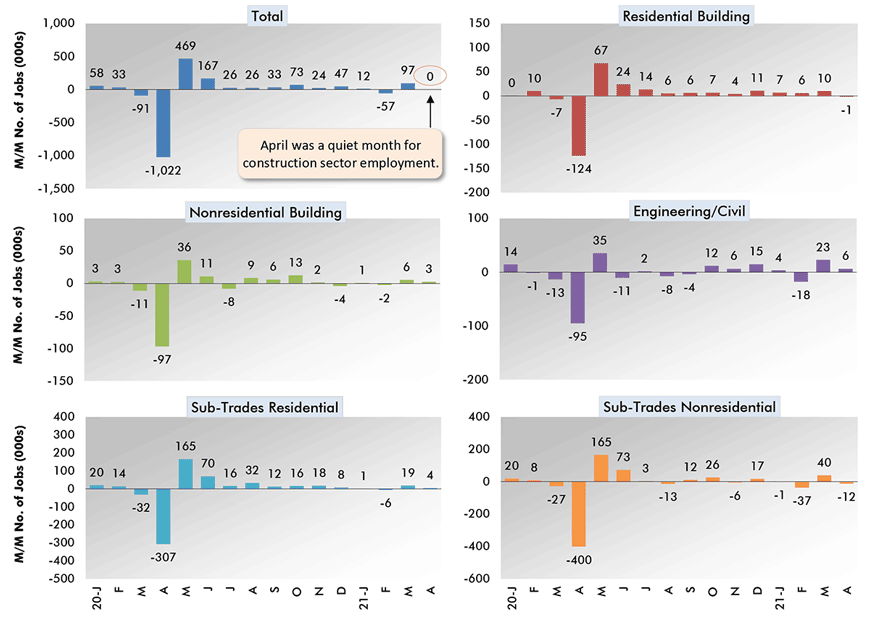
Chart: ConstructConnect.
Not Much Improvement in the Jobs Claw-Back Ratio
April’s +266,000 increase in total employment did little to raise the jobs recovery ratio (a.k.a., the jobs claw-back ratio). Between February and April of last year, 22.4 million American jobs vanished. From April 2020 to the present, 14.1 million positions have been restored or newly created. But that lifts total employment less than two-thirds (63.3%) of the way out of its deep hole.
Table 1 sets out jobs claw-back ratios for the economy as a whole and for individual sectors.
Construction, which has been mainly judged essential throughout the pandemic and has been allowed by legislators to proceed with few interruptions, has one of the better jobs-recovery ratios, 82.4%.
Manufacturing, another non-services sector in the economy, has managed only a 62.8% claw-back ration. Manufacturing’s current unemployment rate, though, is a low 5.8% NSA. By the way, the non-government sector with the lowest unemployment rate is ‘financial services’, 2.7%.
Speaking of government, while the public sector experienced a relatively small drop in jobs from February to April of last year (-4.4%), its total employment count has fallen a little further since then.
Table 1: Monitoring the U.S. Employment Recovery – April 2021
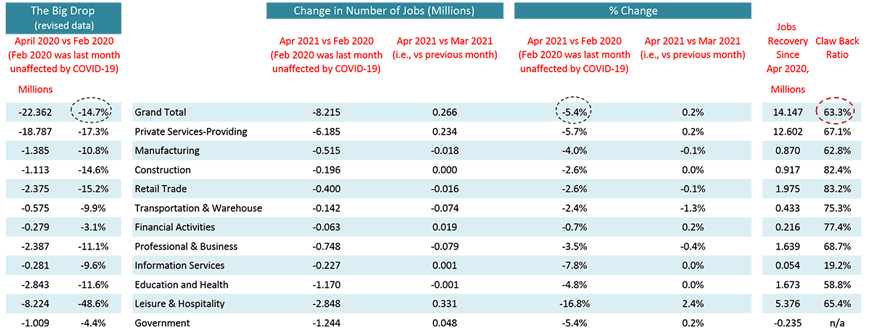
Chart: ConstructConnect.
Please click on the following link to download the PDF version of this article:
Economy at a Glance Vol. 17, Issue 69 – +266,000 for Total U.S. Jobs Not So Great; +331,000 for Leisure & Hospitality Jobs Rates Cheers – PDF
Alex Carrick is Chief Economist for ConstructConnect. He has delivered presentations throughout North America on the U.S., Canadian and world construction outlooks. Mr. Carrick has been with the company since 1985. Links to his numerous articles are featured on Twitter @ConstructConnx, which has 50,000 followers.


Recent Comments