
According to a monthly survey carried out for the Conference Board and The Business Council, CEO confidence is currently the highest it has ever been, or at least dating back to when attempts to measure it began in 1976. But expectations of exceptional growth prospects are being tempered by limitations arising from: (a) shutdowns necessitated by critical parts shortages; (b) rapidly climbing commodity and other input price increases; (c) difficulty in recruiting qualified workers to fill manpower requirements; and (d) bottlenecks in transportation delivery systems.

The business community has been expressing an understanding that two ways to resolve its critical problems are through higher wages and more capital spending. The additional investment may initially be in the means to continue riding the wave of technological advancement that has accelerated during the past year-and-a-quarter’s health crisis. In many instances, however, demands for new equipment and more backroom support services will lead to bigger ‘footprints’, which is just another way of saying construction.
Consumers, while more than normally optimistic, are not feeling quite as enthusiastically exuberant as CEOs. Their ardor is being held back by vanishing government income support measures and inflation that’s marching upwards once again, led by the price of gasoline.
Against the foregoing backdrop, the following are other ‘nuggets’ to be gleaned from the most recent public and private sector data releases.
(1) The U.S. merchandise trade deficit (i.e., the shortfall in ‘goods’ trade as opposed to the surplus in ‘services’ trade), which has been ballooning of late, diminished a tiny bit in April. It still exceeded minus a trillion dollars, but at -$1.040 trillion annualized, it was lower than March’s -$1.115 trillion. Such a large negative position, accompanied by ‘net’ currency flowing out of the country in the Balance of Payments’ ‘current account’, puts pressure on interest rates to attract money back into the U.S. through the counter-balancing ‘capital account’. Or there’s another solution, a depreciation in the value of the U.S. dollar.
(2) The Canadian dollar will now purchase 82 cents U.S. Expressed as the inverted relationship, one dollar U.S. can now buy 122 cents Canadian. A year ago, a dollar Canadian could only acquire 74 cents U.S. Or, from the flip side, a dollar U.S. could purchase 135 cents Canadian. Has the ‘loonie’ gone up in value or has the ‘greenback’ dipped? Maybe there’s a little more of the former occurring than the latter. Canada’s resource sector strength is being recognized and appreciated more than in a decade or so. Graph 1 shows how the price of oil is firmly on the comeback trail.
Graph 1: Daily Spot Price of West Texas Intermediate (WTI) Oil, Terminal in Cushing, Oklahoma
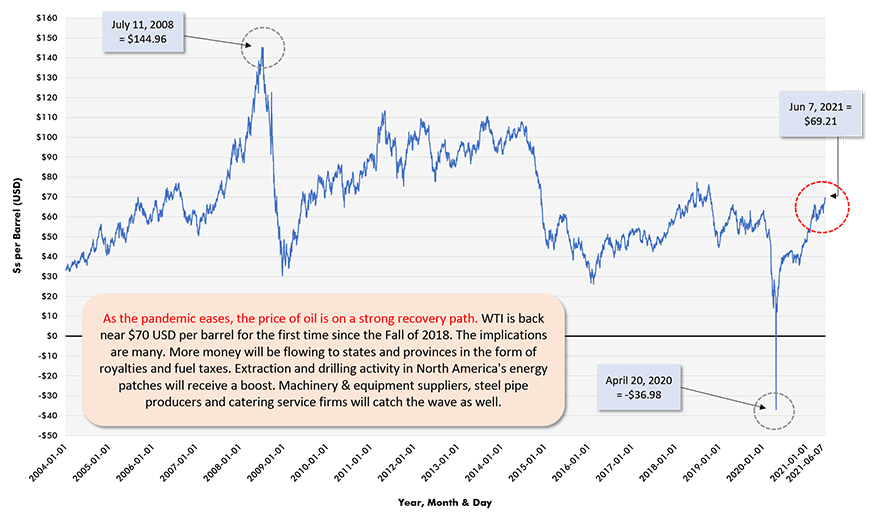
Chart: ConstructConnect.
(3) Reports are flashing across newswires about some current easing in construction material costs. Unfortunately, the latest ‘official’ results from the Producer Price Index (PPI) series, calculated and published by the Bureau of Labor Statistics (BLS), are not up-to-the-second timely or current. Rather, they are for a month ago. May’s PPI input cost results were as follows: softwood lumber, +154.3% year over year and +20.6% month to month; plywood, +98.4% y/y and +14.0% m/m; particleboard and fiberboard, +121.5% y/y and +11.4% m/m; iron and steel scrap, +76.6% y/y and +5.0% m/m; hot rolled steel bars, plates and structural shapes, +29.0% y/y and +0.7% m/m; aluminum mill shapes, +28.6% y/y and +2.7% m/m; copper wire and cable, +38.8% y/y and +6.8% m/m; and asphalt, +62.3%, but -13.8% m/m.
(4) To assess relative levels of construction activity in major urban centers, the consultancy firm Rider, Levett, Bucknall publishes a ‘crane count’ quarterly. The U.S. cities with the most cranes dominating their skylines in Q1 2021 were Washington, D.C., 45; Seattle, 43; Los Angeles, 41; and Denver, 22. Boston, Chicago and New York were well back in the pack with 13, 12 and 10 cranes respectively. But now for something astonishing. Let’s take a small step north of the border. Toronto’s crane count in this year’s first quarter was 208, more than four times greater than the U.S. city leader.
(5) Toronto’s elevated crane count ties to the strength in high-rise residential construction that has long been prevalent in the city. Through May, Toronto is leading all Canadian cities in year-to-date number of housing starts expressed in units. TO’s 15,083 units are surpassing Montreal’s 13,997 and Vancouver’s 11,503. For all three cities, multis vastly exceed singles, accounting for 80% to 90% of the total. On a percentage change basis, Toronto’s +4% for ‘total’ and -1% for ‘multis’ are no match for Montreal’s +77% for both ‘total’ and ‘multis’ and Vancouver’s +48% for ‘total’ and +55% for ‘multis’. In Alberta, and no doubt helped by the recovery in oil prices as set out in Graph 1, Calgary (home to the headquarters of many oil and gas companies) is outperforming Edmonton (the provincial capital). Calgary’s ytd housing starts are 5,702 units and +62% ytd; Edmonton’s, 4,800 units and +9%.
(6) It’s hard to wrap one’s head around the degree of explosive growth in Canada’s housing starts BOOM so far this year. The monthly average seasonally adjusted and annualized (SAAR) number of total Canadian housing starts year to date in 2021 has been 291,000 units. Through May of last year, the comparable figure was 196,000 units. The increase has been +48%.
(7) I thought it would be fun to end with a comparison of how the share prices of the major coronavirus vaccine suppliers have been performing. Year over year, the share price of Pfizer Inc. (PFE) is +27.1%; Johnson & Johnson (JNJ), +17.1%; and Astra Zeneca (AZN), +14.0%. But the winner is Moderna Inc. (MRNA), +263.6%.
Please click on the following link to download the PDF version of this article:
Economy at a Glance Vol. 17, Issue 90 – 7 Mid-June Economic Nuggets – PDF
Alex Carrick is Chief Economist for ConstructConnect. He has delivered presentations throughout North America on the U.S., Canadian and world construction outlooks. Mr. Carrick has been with the company since 1985. Links to his numerous articles are featured on Twitter @ConstructConnx, which has 50,000 followers.


Recent Comments
comments for this post are closed