The most accessible single-source resource on construction material price movements is the Producer Price Index (PPI) data set from the Bureau of Labor Statistics (BLS). The PPI series monitors prices charged by producers as they exit through factory gates.

One drawback of a government statistical series, however, is that it will inevitably lag what is occurring in the real world, due to a time delay in collecting and tabulating results. For example, the latest PPI figures are for May. Therefore, they don’t factor in some of the decreases in final demand (e.g., some possible moderation in housing start activity) and increases in supply (e.g., more sawmill production of lumber) that may, according to ‘word of mouth’, be taking place.
Nevertheless, the PPI numbers are the best that’s available and the remainder of this article showcases them in tables and charts.
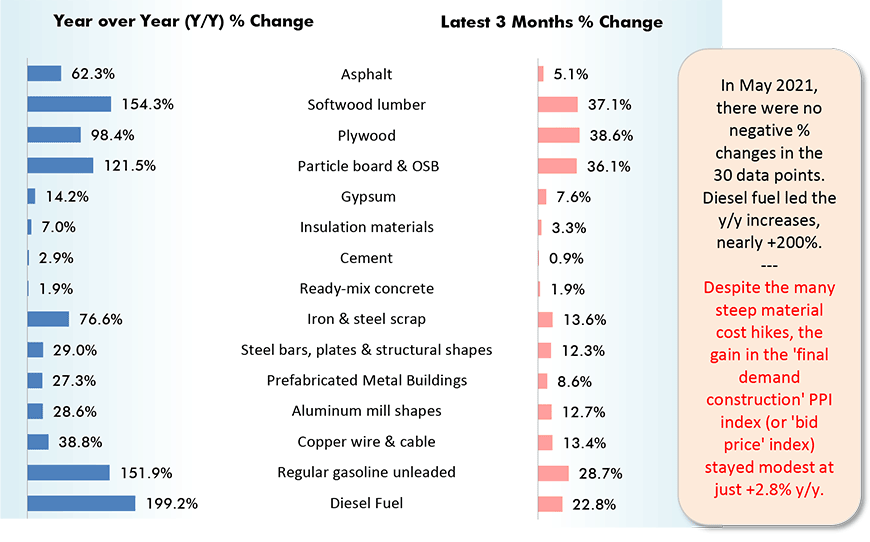
For 15 of the most important building materials or construction-related inputs, Table 1 highlights year-over-year and latest-three-months price changes.
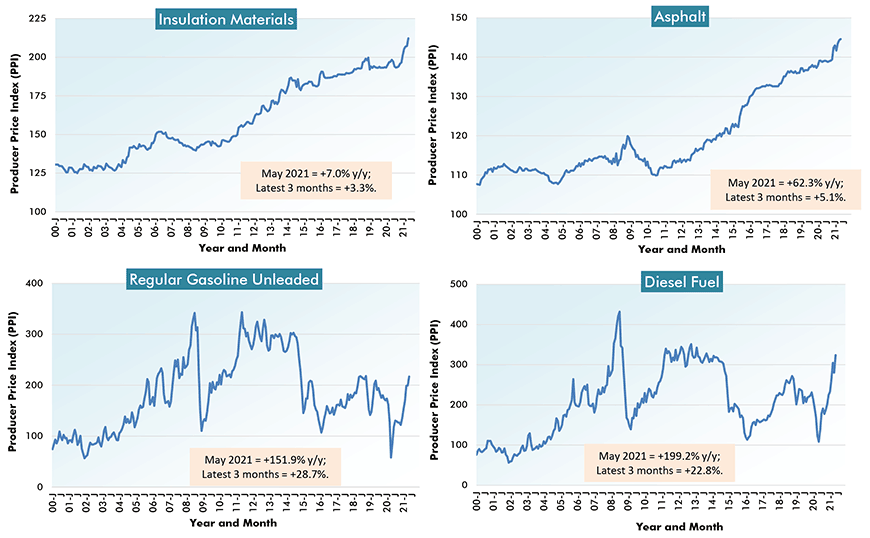
More than doubling in price over the past year have been softwood lumber, +154.3%; particle board and OSB, +121.5%; regular gasoline, +151.9%; and diesel fuel, +199.2%.
With cost lifts lying between +50% and +99% are plywood, +98.4%; iron and steel scrap +76.6%; and asphalt, +62.3%.
Asphalt also has the distinction, however, of being one of only two items that experienced a price drop month to month in May, -13.8%. Coal, as a base material going into steel production, was the other, -0.3% m/m.
‘Rocket Launch’ Cost Take-Offs
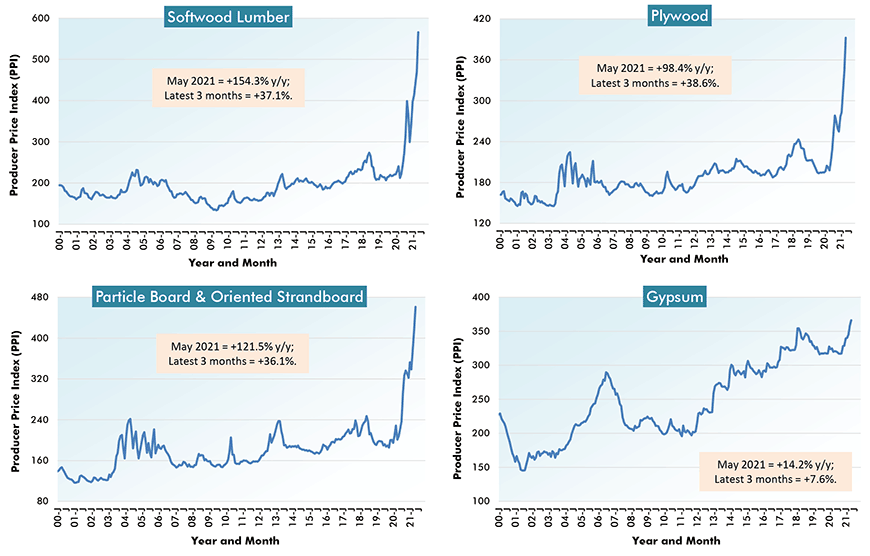
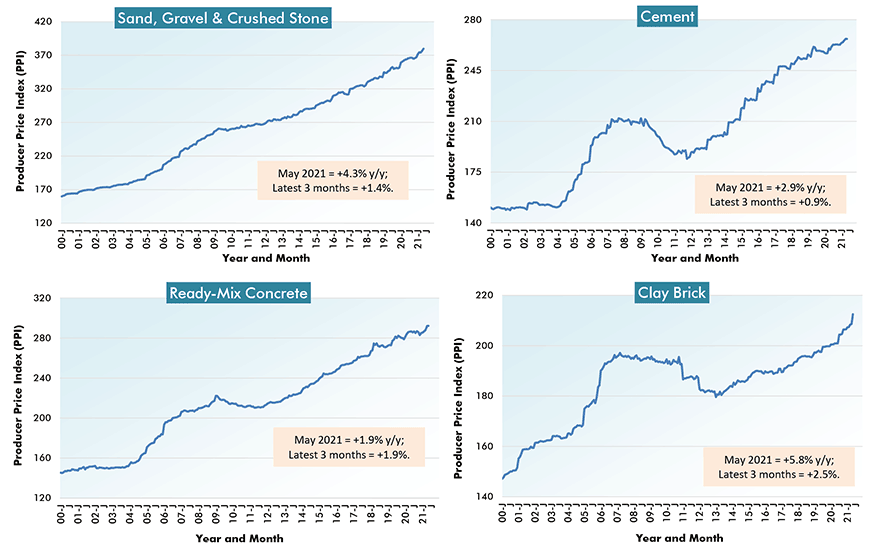
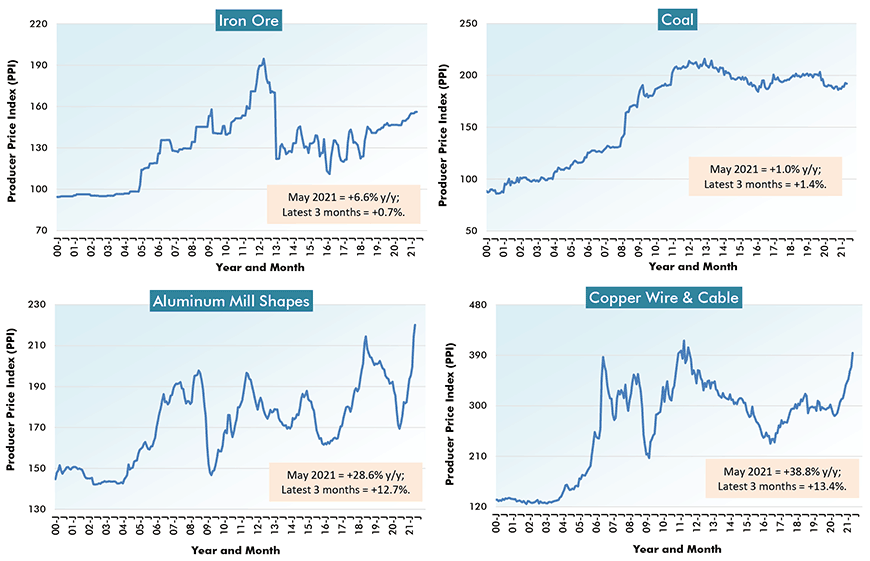
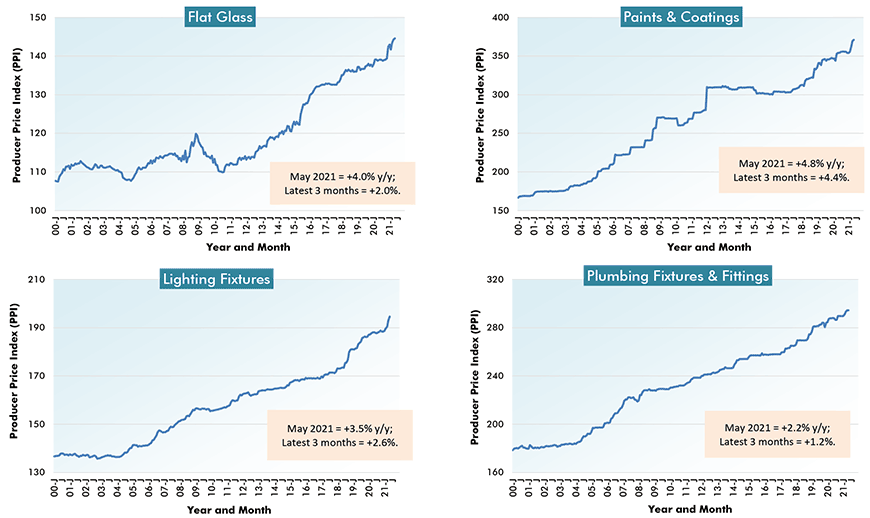
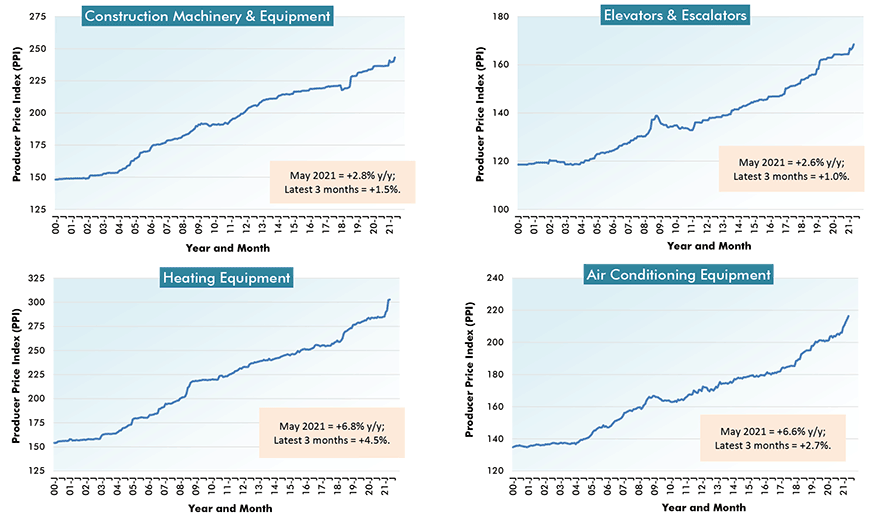
Below Table 1 are seven cluster charts of four graphs each. These almost double the number of building materials and construction-related inputs being studied to 28. The 28 graphs in the seven cluster charts show the histories of the PPI numbers from the turn of the century (January 2000) to the present.
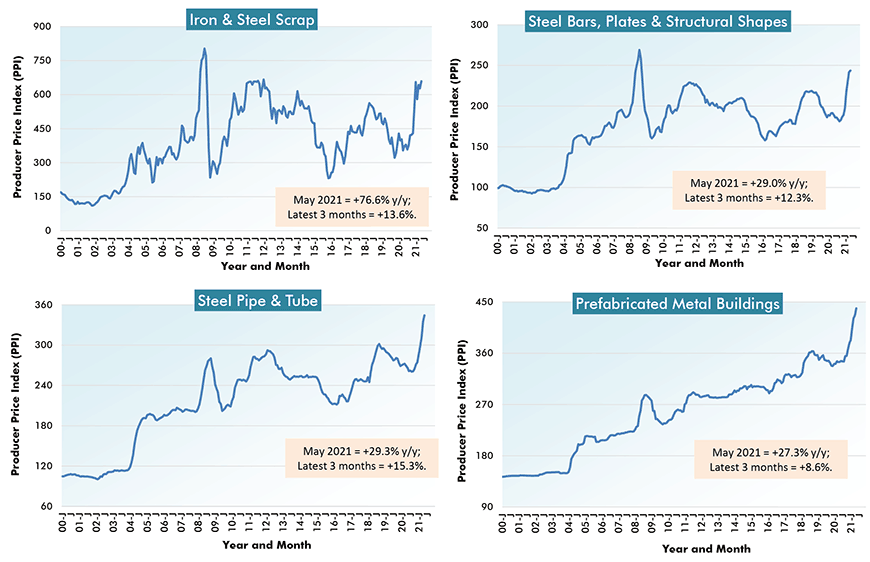
Many of the series (e.g., in the cement/concrete field and in equipment) trend higher gradually and steadily, establishing new peaks along the way. Some others (e.g., among forestry products) take far more varied paths, with wide amplitudes up and down.
Among the material inputs with significant market swings in their histories, besides forestry and steel-related products, notice from Cluster Chart 4 the recent steep slopes for aluminum mill shapes (+28.6% y/y) and copper wire and cable (+38.8%).
Finally, it bears stating that from Cluster Chart 1, the ‘rocket-launch’ take-offs in forestry product prices since mid-2020 have been in a league of their own.
From Producer Price Index (PPI) Series – May 2021
Charts: ConstructConnect.
U.S. Construction Material Costs (1) – From Producer Price Index (PPI) Series
Charts: ConstructConnect.
U.S. Construction Material Costs (2) – From Producer Price Index (PPI) Series
Charts: ConstructConnect.
U.S. Construction Material Costs (3) – From Producer Price Index (PPI) Series
Charts: ConstructConnect.
U.S. Construction Material Costs (4) – From Producer Price Index (PPI) Series
Charts: ConstructConnect.
U.S. Construction Material Costs (5) – From Producer Price Index (PPI) Series
Charts: ConstructConnect.
U.S. Construction Material Costs (6) – From Producer Price Index (PPI) Series
Charts: ConstructConnect.
U.S. Construction Material Costs (7) – From Producer Price Index (PPI) Series
Charts: ConstructConnect.
% Change in the May 2021 Index from:
| 3 Years | 1 Year | 6 months | 3 months | 1 month | |||||
| Ago | Ago | Ago | Ago | Ago | |||||
| Final Demand/Service/Commodity/Energy/Input: | |||||||||
| Final Demand Construction | 11.0% | 2.8% | 2.6% | 2.1% | 0.6% | ||||
| New warehouse building construction | 10.4% | 3.2% | 3.2% | 3.2% | 0.8% | ||||
| New school building construction | 10.8% | 1.3% | 1.4% | 1.0% | 0.1% | ||||
| New office building construction | 12.4% | 4.4% | 4.1% | 3.0% | 1.0% | ||||
| New industrial building construction | 11.9% | 1.7% | 1.4% | 0.9% | 0.1% | ||||
| New health care building construction | 11.2% | 3.1% | 3.3% | 3.5% | 0.7% | ||||
| Architectural & engineering services | 5.5% | 3.1% | 2.1% | 0.5% | 0.3% | ||||
| Construction machinery & equipment | 10.9% | 2.8% | 2.7% | 1.5% | 1.3% | ||||
| Asphalt | 7.8% | 62.3% | 44.1% | 5.1% | -13.8% | ||||
| Plastic construction products | 19.7% | 17.5% | 12.4% | 9.7% | 2.8% | ||||
| Softwood lumber | 113.1% | 154.3% | 89.0% | 37.1% | 20.6% | ||||
| Hardwood lumber | 17.7% | 36.4% | 27.4% | 17.2% | 3.9% | ||||
| Millwork | 23.2% | 19.2% | 12.0% | 8.5% | 4.8% | ||||
| Plywood | 63.6% | 98.4% | 51.4% | 38.6% | 14.0% | ||||
| Particle board & oriented strandboard (OSB) | 94.7% | 121.5% | 39.6% | 36.1% | 11.4% | ||||
| Gypsum | 7.6% | 14.2% | 11.6% | 7.6% | 2.1% | ||||
| Insulation materials | 10.0% | 7.0% | 8.4% | 3.3% | 2.4% | ||||
| Construction sand, gravel & crushed stone | 13.8% | 4.3% | 3.7% | 1.4% | 0.8% | ||||
| Cement | 5.7% | 2.9% | 1.5% | 0.9% | 0.0% | ||||
| Ready-mix concrete | 6.4% | 1.9% | 3.3% | 1.9% | 0.0% | ||||
| Precast concrete products | 16.6% | 7.7% | 6.3% | 3.8% | 2.0% | ||||
| Prestressed concrete products | 8.3% | 2.0% | 3.7% | 3.0% | 1.1% | ||||
| Brick (clay) | 8.5% | 5.8% | 3.0% | 2.5% | 1.9% | ||||
| Coal | -4.8% | 1.0% | 3.2% | 1.4% | -0.3% | ||||
| Iron ore | 11.4% | 6.6% | 3.0% | 0.7% | 0.1% | ||||
| Iron & steel scrap | 18.9% | 76.6% | 53.4% | 13.6% | 5.0% | ||||
| Steel bars, plates & structural shapes | 18.9% | 29.0% | 30.5% | 12.3% | 0.7% | ||||
| Steel pipe & tube | 24.5% | 29.3% | 26.8% | 15.3% | 2.7% | ||||
| Fabricated structural metal products | 19.7% | 18.3% | 17.9% | 11.4% | 4.9% | ||||
| Prefabricated Metal Buildings | 24.5% | 27.3% | 19.5% | 8.6% | 2.9% | ||||
| Aluminum mill shapes | 4.3% | 28.6% | 20.7% | 12.7% | 2.7% | ||||
| Flat glass | 6.2% | 4.0% | 3.7% | 2.0% | 0.2% | ||||
| Paints, architectural coatings | 15.8% | 4.8% | 4.3% | 4.4% | 0.4% | ||||
| Lighting fixtures | 12.2% | 3.5% | 3.3% | 2.6% | 0.8% | ||||
| Plumbing fixtures & fittings | 9.2% | 2.2% | 1.7% | 1.2% | 0.0% | ||||
| Elevators & escalators | 9.0% | 2.6% | 2.5% | 1.0% | 0.8% | ||||
| Heating equipment | 15.4% | 6.8% | 6.5% | 4.5% | 0.1% | ||||
| Air conditioning equipment | 12.3% | 6.6% | 5.0% | 2.7% | 0.9% | ||||
| Copper wire & cable | 27.9% | 38.8% | 22.1% | 13.4% | 6.8% | ||||
| Regular gasoline unleaded | 0.4% | 151.9% | 78.0% | 28.7% | 8.8% | ||||
| Diesel Fuel | 29.0% | 199.2% | 61.1% | 22.8% | 15.6% | ||||
| Inputs to new construction | 20.9% | 24.0% | 15.8% | 9.2% | 4.3% | ||||
| Inputs to new residential construction | 23.0% | 25.4% | 16.4% | 9.9% | 4.5% | ||||
| Inputs to new non-res construction | 18.8% | 22.2% | 15.1% | 8.5% | 4.1% | ||||
| Inputs to commercial construction | 18.0% | 20.5% | 14.1% | 8.2% | 3.9% | ||||
| Inputs to healthcare structures | 19.0% | 21.0% | 14.2% | 8.3% | 3.8% | ||||
| Inputs to industrial structures | 18.5% | 18.1% | 12.3% | 6.6% | 2.9% | ||||
| Inputs to highways & streets | 14.6% | 20.9% | 14.4% | 8.0% | 4.3% | ||||
| Inputs to power & communication structures | 17.9% | 23.2% | 16.0% | 9.2% | 4.4% | ||||
| Inputs to educational & vocational structures | 20.6% | 21.9% | 14.7% | 8.7% | 3.9% | ||||
| Construction materials (PPI ‘Special Index’) | 28.1% | 30.0% | 24.2% | 15.1% | 4.6% |
The ‘service’, ‘commodity’ and ‘energy’ indices (in the middle section of the table) are based on ‘factory-gate’ sales prices.
The ‘input’ indices (at bottom) reflect costs faced by contractors. They exclude capital investment (i.e., machinery & equipment), labor & imports.
The ‘input’ indices are built up from the ‘service’ (design, legal, transport & warehousing, etc.) ‘commodity’ and ‘energy’ indices.
Table: ConstructConnect.
Please click on the following link to download the PDF version of this article:
Economy at a Glance Vol. 17, Issues 91 and 92 – Latest PPI Results Show Construction Material Cost Increases Still Alarming – PDF
Alex Carrick is Chief Economist for ConstructConnect. He has delivered presentations throughout North America on the U.S., Canadian and world construction outlooks. Mr. Carrick has been with the company since 1985. Links to his numerous articles are featured on Twitter @ConstructConnx, which has 50,000 followers.


Recent Comments