
This article consists of seven cluster charts of four graphs each, showing monthly employment levels over the past 20-plus years in 28 sub-sectors of the U.S. economy.

In every sub-sector, there were pandemic-related downturns in jobs counts in the Spring of last year. Nevertheless, it’s easy to see where jobs growth is on a long-term upward path, not to be deterred by a temporary setback.
On the flip side, there are industries where jobs prospects are clearly flagging.
The types of jobs covered are based in: resources; manufacturing; logistics and environmental; desk work (i.e., office-based); institutional (schools and hospitals) and real estate; accommodation, hospitality and entertainment; and ‘new wave’ (security services, couriers, pharma and software publishing).
There are text boxes accompanying each cluster which set out the highlights from the four workplaces featured. But there are some further observations to be made.
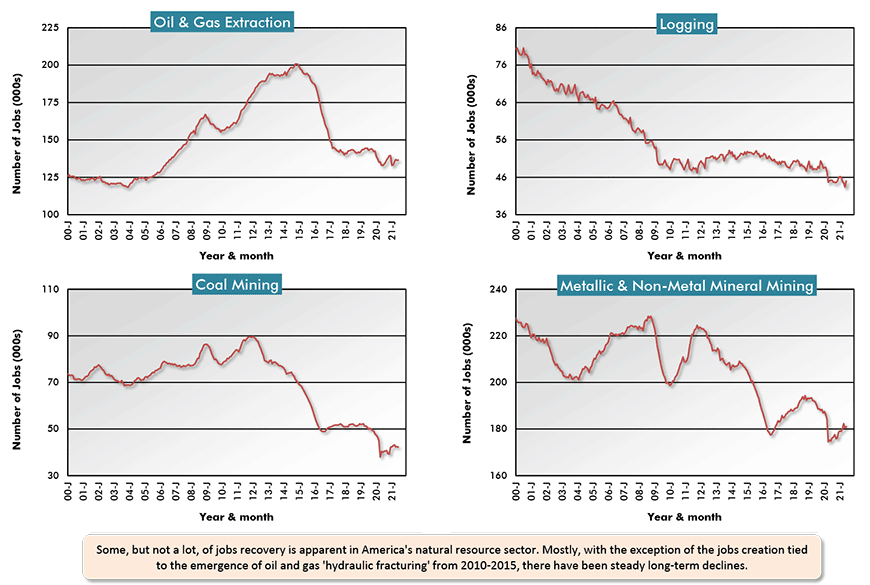
In the ‘Resources’ cluster, none of the four sub-sectors is showing a trend towards long-term jobs growth. Rather, the opposite appears to be the case.
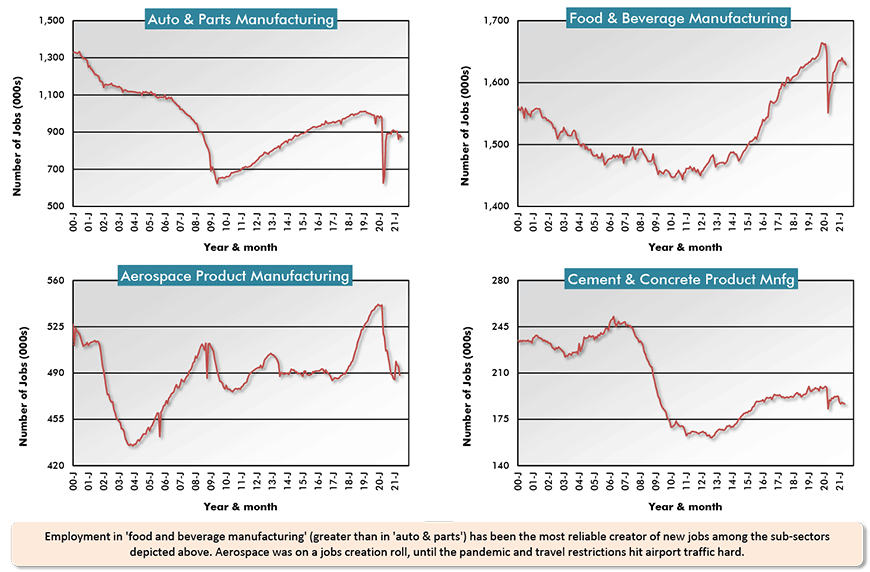
In the ‘Manufacturing’ cluster, it’s interesting that food and beverage employment is reaching new heights while autos and parts employment, while apparently on an upswing (ignoring the pandemic dip), remains below levels achieved 20 years ago. Furthermore, the full-on push for electrification of cars, which is accelerating, is likely to employ more robotics than human hands.
In aerospace, the most exciting field of jobs expansion will likely come from the private sector race to the moon, Mars and beyond. But hopes for being hired will be tied to specific skill sets. ‘Yes, I am a rocket scientist’ is the answer that will win you big rewards in the jobs market of the mid-to-latter 2020s.
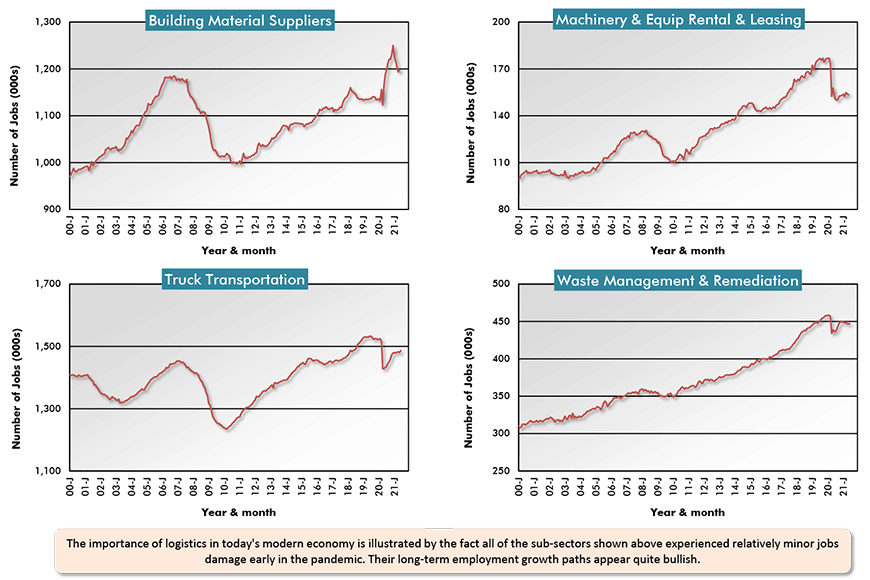
Within the ‘Logistics & Environmental’ cluster, the jobs count trends are rising, but freight haulers must be aware of a new era of driverless and autonomous vehicles on the horizon.
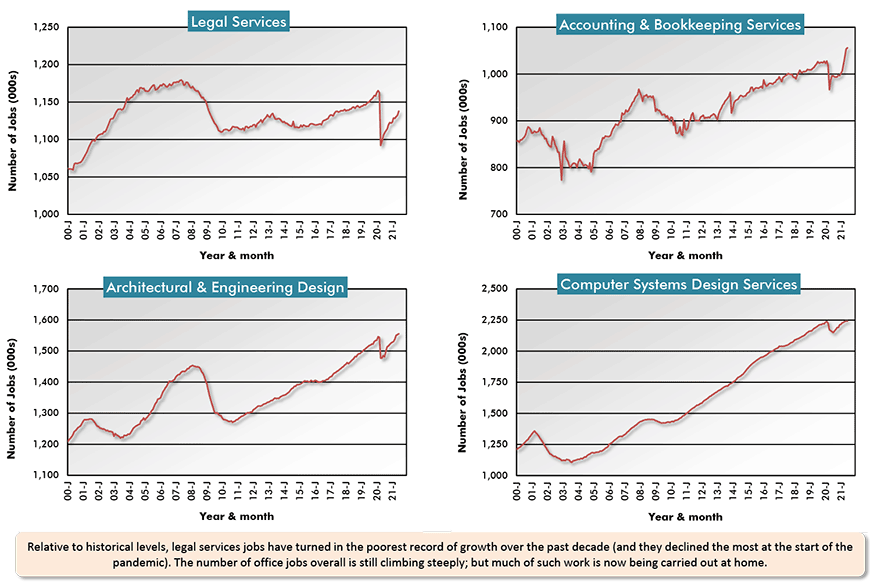
Office-oriented employment, except for legal services where so many functions have been ‘packaged’ for do-it-yourself ease on the Internet (e.g., the writing of ‘wills’), keeps increasing, particularly in the area of computer systems design services. Still to be sorted out, though, is the ‘from home’ versus ‘commute to an office building’ mix.
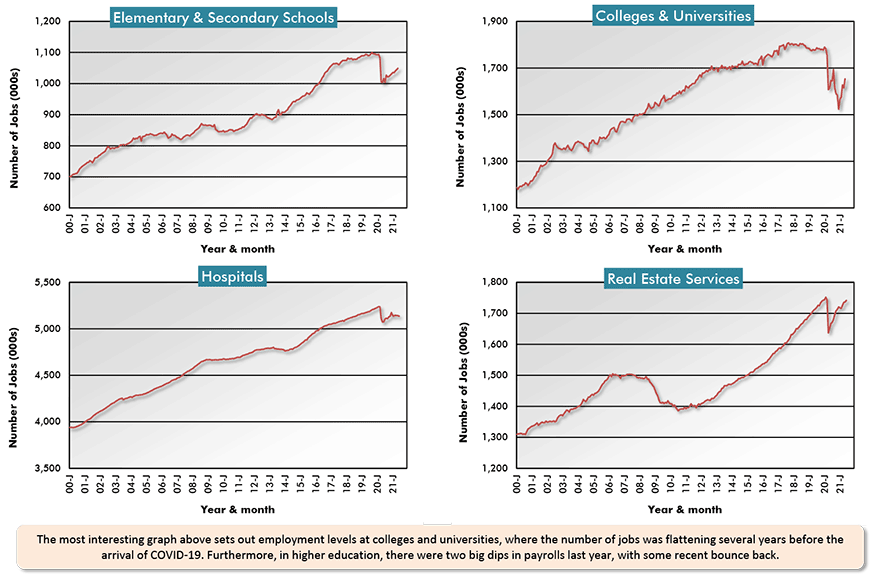
In institutional employment, jobs with colleges and universities appear to be in jeopardy. They were flattening out before the health crisis. Web-based course instruction has become more commonplace.
And the curve for jobs in elementary and secondary school employment was losing some of its incline prior to COVID-19. Births have been on a dramatically declining tack. Plus, the arrival of foreign families with young children has been scaled back.
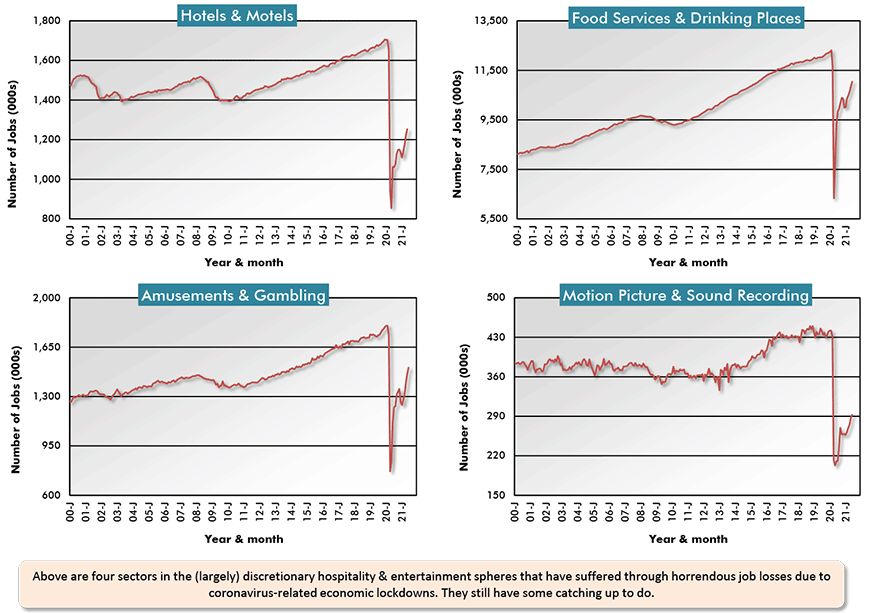
I have no doubt that employment with hotels/motels, bars and restaurants and casinos will come storming back once everyone feels totally comfortable about engaging socially, in person, once again. But some changes that were already underway have become more firmly entrenched. Restauranteurs have learned more about the curb-side pickup and home-delivery-of-meals business than they once would have ever imagined.
As for motion picture and sound recording jobs, they’re bound to soar with nearly all of us having exhausted what’s been available for streaming during the duration of the stay-at-home days and looking for, nay actually begging for, something new to watch or listen to.
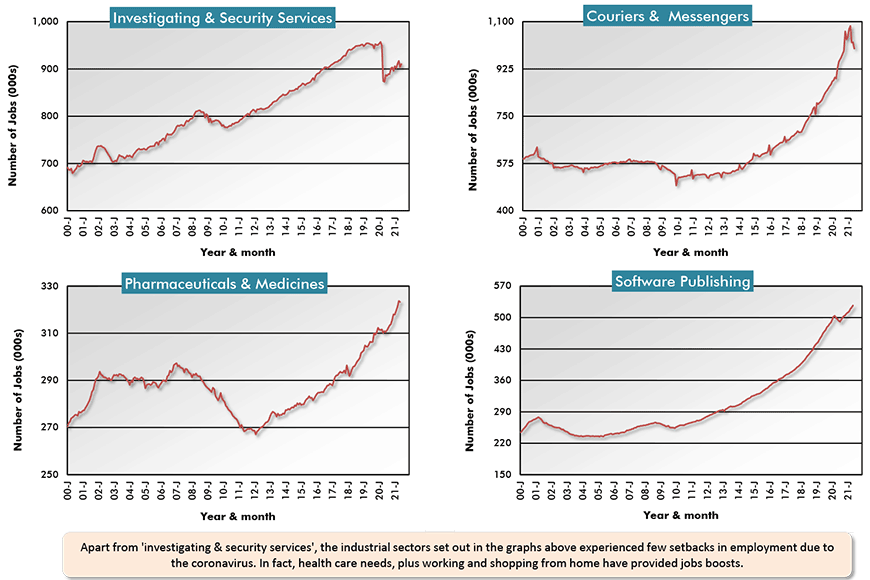
Finally, as for the four jobs categories shown in the Cluster 7 graphs, they are, by definition, the ‘new wave’ sources of good jobs creation – in security services; in pharmaceuticals development and sales; with courier services; and in software publishing.
Charts: ConstructConnect.
Charts: ConstructConnect.
Charts: ConstructConnect.
Charts: ConstructConnect.
Charts: ConstructConnect.
Charts: ConstructConnect.
Charts: ConstructConnect.
Please click on the following link to download the PDF version of this article:
Economy at a Glance Vol. 17, Issues 103 and 104 – Exiting the Pandemic, Where the Jobs Aret – PDF
Alex Carrick is Chief Economist for ConstructConnect. He has delivered presentations throughout North America on the U.S., Canadian and world construction outlooks. Mr. Carrick has been with the company since 1985. Links to his numerous articles are featured on Twitter @ConstructConnx, which has 50,000 followers.


Recent Comments