
There are two major questions overhanging the economies of the U.S. and Canada. (1) Will a re-emergence of coronavirus infections, mainly among the unvaccinated and tied to the Delta variant of the disease, force a slowdown in what was proving to be exceptional gross domestic product (GDP) growth? And (2), the subject of this article, will rapid price increases compel the Federal Reserve and the Bank of Canada to move more aggressively on interest rates?

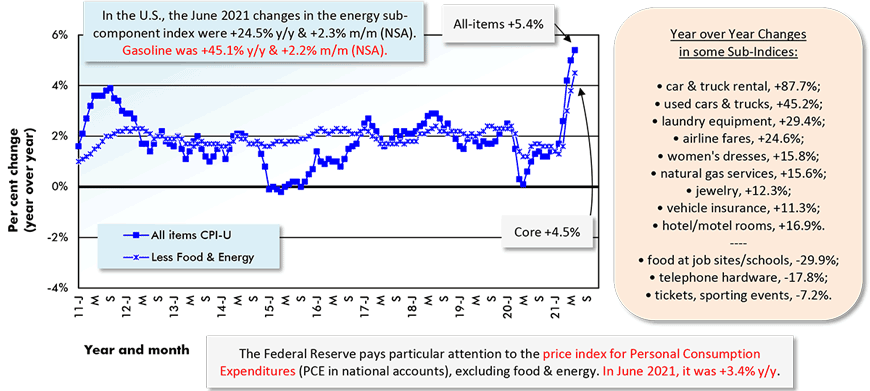
In June, the All-items Consumer Price Index (CPI-U) in the U.S. moved up to +5.4% year over year from +5.0% in May. What’s known as ‘headline’ inflation in America is now increasing at its fastest rate in more than a decade. The ‘core’ rate of inflation, which omits volatile energy and food components, has increased to +4.5% y/y from the previous period’s +3.8%.
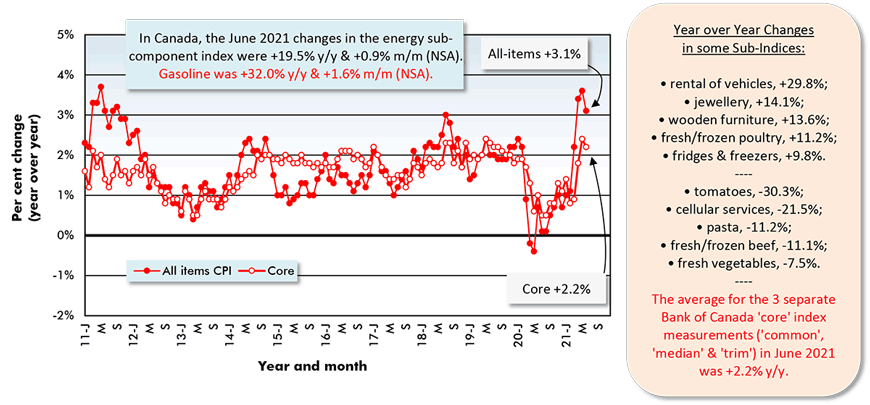
In Canada, headline inflation downshifted to +3.1% y/y in June from +3.6% y/y in May and, leaving out food and energy, it eased to +2.2% y/y from +2.4% y/y.
The problem in assessing what the Fed and the BoC might do with interest rates, however, is that they focus on different measures of inflation than the rest of us. The Fed closely monitors prices tied to Personal Consumption Expenditures (PCE) in the National Accounts, and that measure is currently restrained at only +3.4% y/y for May. (The reporting period for the PCE measure always trails the CPI by a month.)
The BoC looks at three measures of inflation it has labeled ‘common’, ‘median’ and ‘trim’. At +1.7% y/y for ‘common’, +2.4%y/y for ‘median’ and +2.6% y/y for ‘trim’, they are currently (June 2021) averaging a hardly worrisome +2.2% y/y. A fuller explanation of the BoC’s preferred inflation measures can be found in a footnote at the end of this article*.
The Fed and BoC aren’t expressing any great concern about inflation, adopting the stance that present upticks in prices will prove temporary. A year ago, when consumers were in the early stages of lockdown, prices for many items ̶ i.e., men’s and women’s clothing, airline tickets, hotel and motel room rates, even gasoline ̶ nosedived. Now, naturally enough, with economic activity moving closer to full swing, those same items are moving up in price again and a ‘low base effect’ in the year-over-year percentage change calculation is exaggerating the climb.
The Joe and Jill Average Take on Inflation
But the ‘low base effect’ is far from being the whole story. There are some severe material and labor shortages.
Car makers are unable to maintain previous target production levels because their sources of computer chips are unable to fulfill contracted orders. One consequence has been a surge in used car and truck prices, +45.2% y/y in the U.S. In Canada, the cost of renting passenger vehicles is +29.8% y/y.
Restaurants that are re-opening are cordoning off sections of their dining space because they can’t find the staff to wait on all their tables (and this is even after adding more ‘social distancing’ room between patrons.) Also, recent harder-to-obtain, and therefore expensive, entrée items (beginning with some specialty seafoods) are being left off menus.
And everybody (you, me and Joe and Jill average) knows that anything contributing to an easier lifestyle while we’ve all been staying indoors more, at home, during the pandemic has gone up in price. ‘Laundry equipment’ as a sub-item of the U.S. CPI-U is +29.4% y/y. ‘Refrigerators and freezers’ as a sub-item of Canada’s CPI are +9.8% y/y. ‘Furniture’ in the U.S. is +10.8% y/y. ‘Wooden furniture’ in Canada is +13.6% y/y and ‘upholstered furniture’, +10.3% y/y.
On the Wages Lookout
When the inflation question will become super-interesting is in about six to nine months from now, in late 2021 and early 2022. By then, most of the material supply shortage issues will have been worked out. But there’s the matter of wage increases remaining to be addressed.
Overcoming the shortages of workers to fill key positions will require promotional hiring and re-education efforts carried out over extended time frames; also, when possible, investments in automation that will take capital expenditures. Topping up staffing in the short term will almost certainly mean more financial rewards and benefits being offered to prospective employees. And that may well keep the inflationary fires burning.
Previous Month & Current Month (May & June 2021)
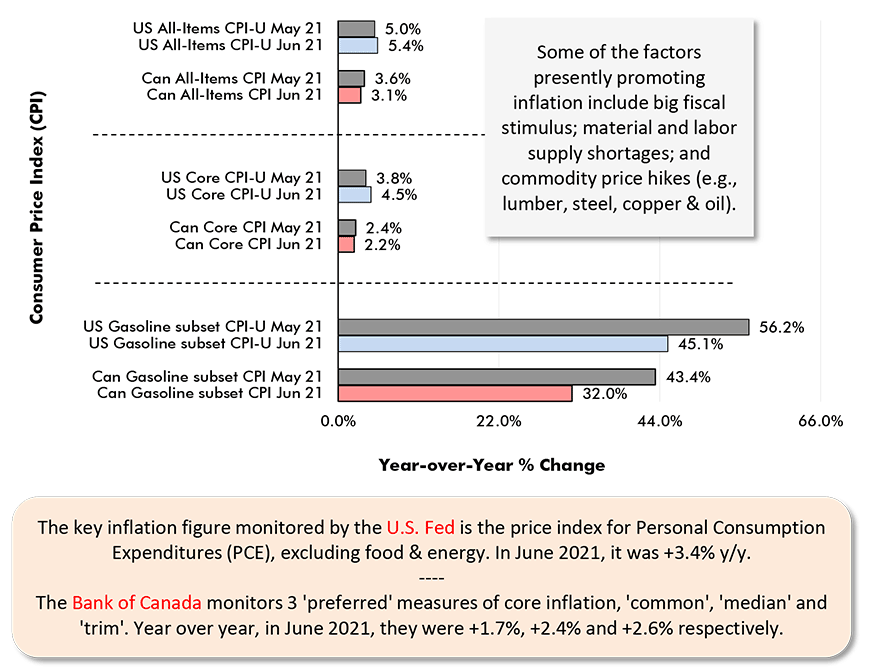
Chart: ConstructConnect.
(Not Seasonally Adjusted)
The U.S. figure (CPI-U) is the All Items Consumer Price Index for All Urban Consumers.
*Core inflation is CPI-U less its often most volatile sub-components, food and energy.
Chart: ConstructConnect.
(Not Seasonally Adjusted)
The Canada figure (CPI) is the All Items Consumer Price Index.
*Core inflation is CPI-U less its often most volatile sub-components, food and energy.
Chart: ConstructConnect.
(CPI & CPI-U Not Seasonally Adjusted)
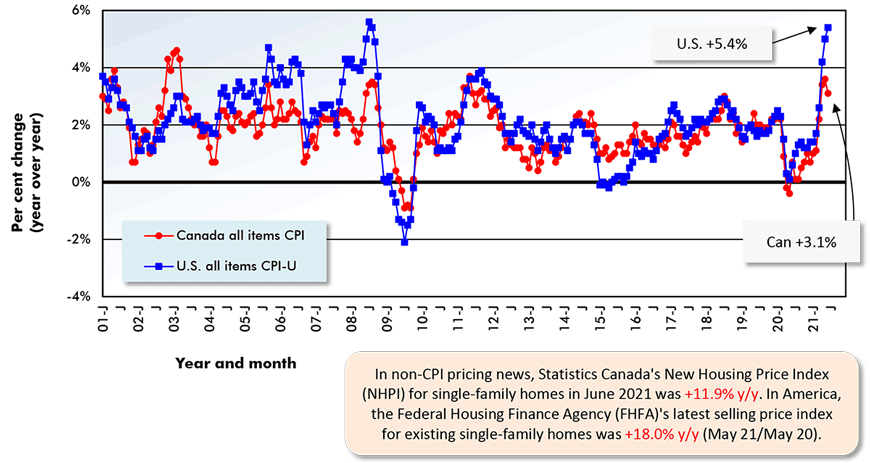
Chart: ConstructConnect.
(CPI Core & CPI-U Less Food and Energy Not Seasonally Adjusted)
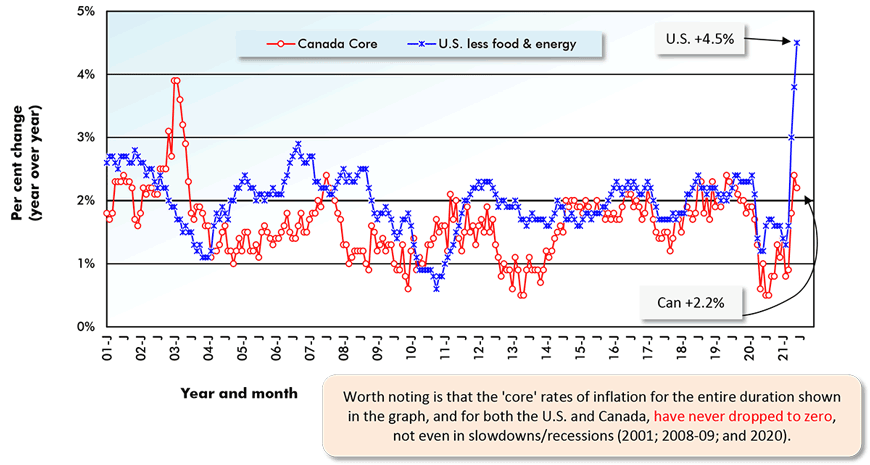
*Core is all-items inflation less its often most volatile sub-components, food and energy.
Chart: ConstructConnect.
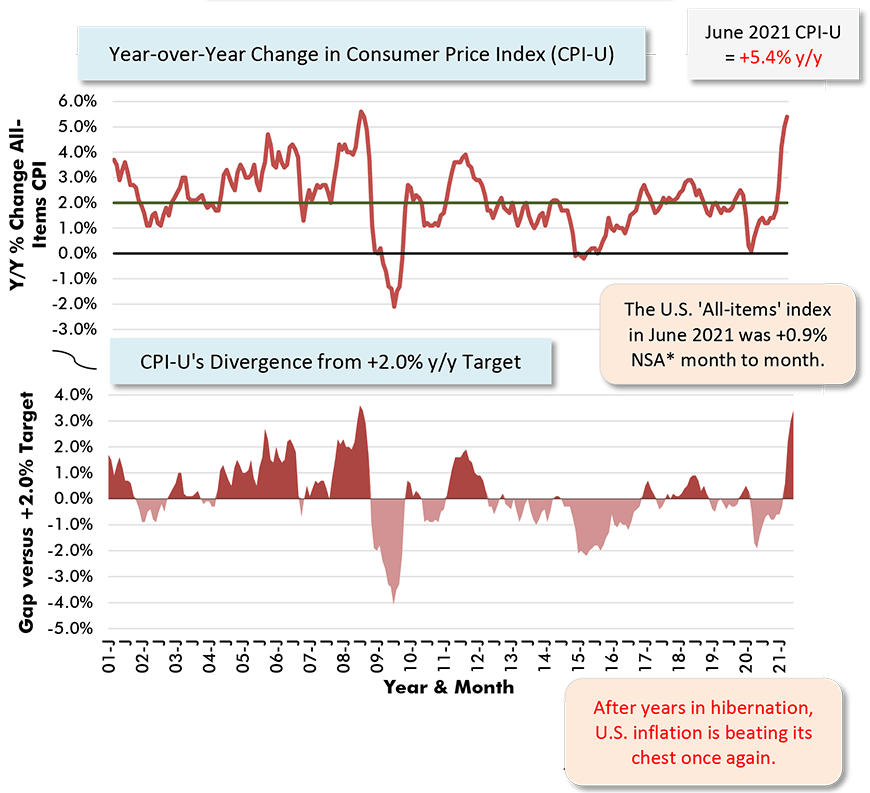
CPI-U is for ‘All Urban Consumers, U.S. City Average’. A desirable rate of inflation is around +2.0% y/y.
Latest data points are for June, 2021. *NSA in the m/m change is ‘not seasonally adjusted’.
Chart: ConstructConnect.
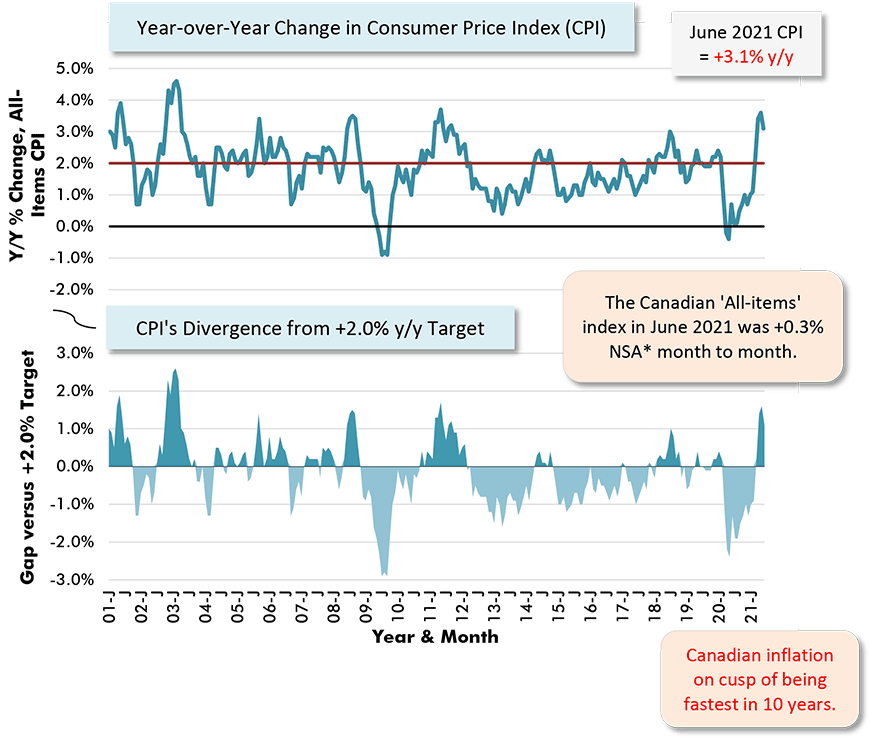
For a variety of reasons, there is a desirable rate of inflation and it’s around +2.0% y/y.
Latest data points are for June 2021. (*NSA in the m/m change is ‘not seasonally adjusted’.)
Chart: ConstructConnect.
Please click on the following link to download the PDF version of this article:
Economy at a Glance Vol. 17, Issues 115 and 116 – Multiple Layers to the Inflation Watch Story – PDF
Alex Carrick is Chief Economist for ConstructConnect. He has delivered presentations throughout North America on the U.S., Canadian and world construction outlooks. Mr. Carrick has been with the company since 1985. Links to his numerous articles are featured on Twitter @ConstructConnx, which has 50,000 followers.


Recent Comments