
The U.S. ‘real’ (i.e., after factoring out inflation) gross domestic product (GDP) decline in full year 2020 was -3.4% compared with full year 2019. 2021, however, is shaping up to be much better. Q1 2021 growth, quarter to quarter annualized, was +6.3% and Q2, +6.5%.
 Text Graphic")
Oxford Economics, which partners with ConstructConnect, in calculating our construction ‘starts’ and ‘put-in-place capital spending’ forecasts, is projecting that U.S. ‘real’ GDP growth will speed ahead by +7.0% year over year in 2021 before the throttle is eased back to a still rapid +4.3% y/y in 2022.
The long-term average U.S. GDP growth rate (and Canada’s as well, which we’ll come to in a moment) has been in a range of +2.0% to +2.5%. The reason this is being expressed as a range is because it depends on whether one includes slowdown/recession-year results (for 2001, 2009 and 2020) in the calculation of the average.
In Canada, where the provinces have been more stringent than U.S. states in mandating COVID-related lockdown measures over the past 16 months, GDP’s drop in 2020 at -5.3% y/y was notably worse than America’s.
Also, while Canada’s Q1 2021 climb was +5.6% quarter to quarter annualized, there are doubts as to whether Q2 will yield much of a positive result. Canadian ‘GDP by industry’ change in the first three months of this year was +0.7% for January; +0.4%, February; and +1.3%, March. In the first two months of the second quarter, however, the ‘GDP by industry’ change has been -0.5% for April and -0.3% for May, with June results not yet published.
Statistics Canada won’t be releasing the Q2 2021 GDP percent-change figure until August 31st.
By the way, the reader will notice from Graphs 1 and 2 that 2021/2020 GDP growth of +7.0% for the U.S. and +6.8% for Canada, if they are realized, will handily beat all other years going back to at least 2000, the beginning of this century.
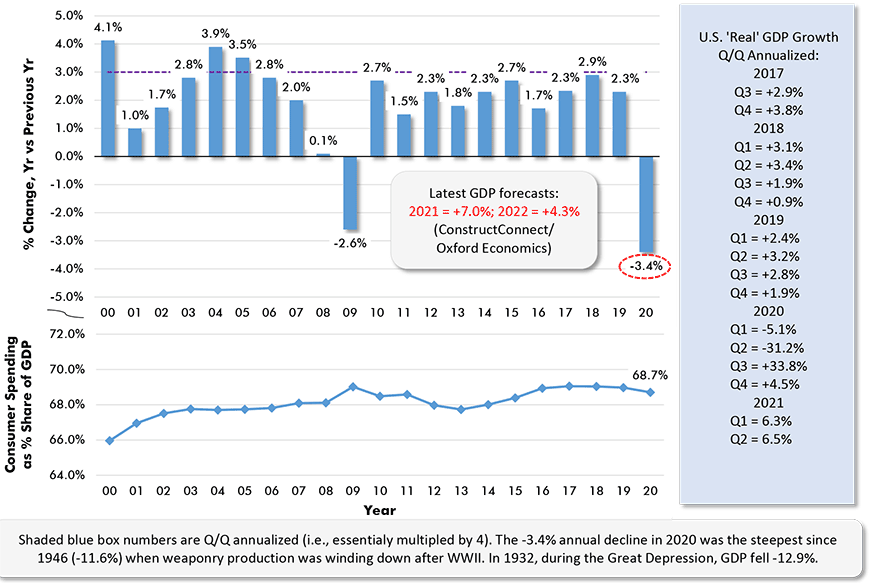
Chart: ConstructConnect.
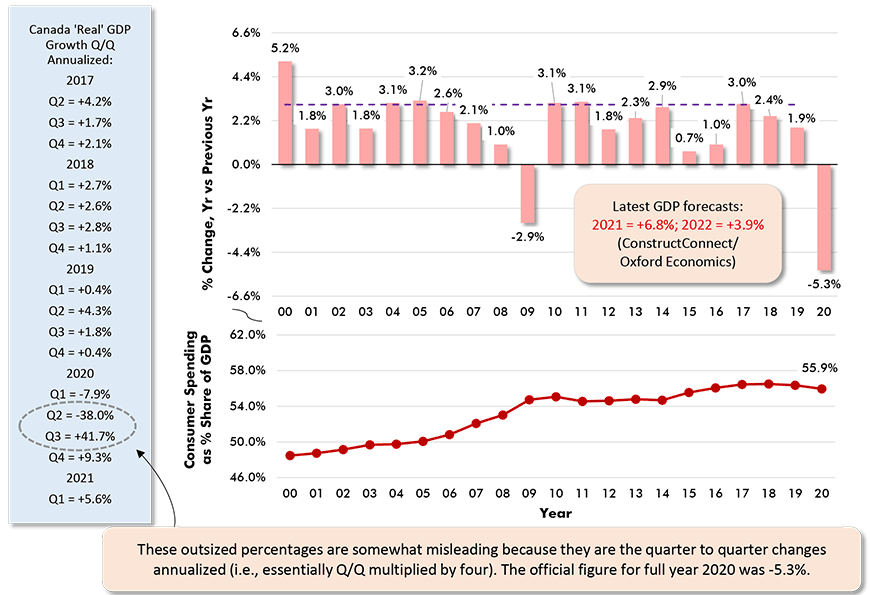
Chart: ConstructConnect.
Retail and Services Spending
In the U.S., consumer spending usually comprises about 70% of GDP; in Canada, 55%. In Canada, the percentage is lower because foreign trade plays a larger role in total economic activity than in America.
In both instances, though, consumer spending accounts for more than half of national output. Therefore, if consumer spending is robust, the economy is likely to be steaming ahead.
In turn, consumer spending is directed a little less than half towards ‘retail’ and a little more than half towards ‘services’. The latter includes travel, hotel/motel stays, dining out and ‘happy hour’ at your local pub.
Elements of both retail and services took severe body blows last year, especially in the first half, but the latter spent more time prostrate on the canvas than the former.
How are they doing now? Well, I’m happy to report, and backed up by the rest of the graphs in this article, much improved!
From Graph 3, total U.S. retail sales have not only recovered from their deep dive in the Spring of 2020, but they are presently well above the trend line that could be extended out from the gradual steady growth period running from 2009 through 2019.
From Graph 4, Canadian total retail sales have similarly bounced back. As a level, though, they are now about what one would expect based on their slow ascending pattern during the decade prior to the pandemic’s onslaught. They haven’t embarked on a whole new upwards trajectory as in the U.S. (It seems likely the U.S. surge, as illustrated in Graph 3, will ultimately prove to be temporary.)
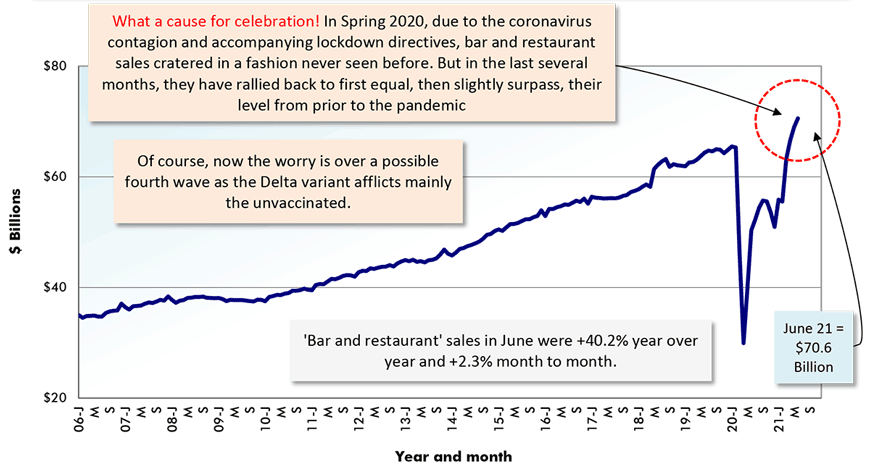
According to Graph 5, sales by ‘food services and drinking places’ (otherwise known as bars and restaurants) in the U.S. have returned all the way home after wandering far off the beaten path.
The comparable statistics for Canada, however, as shown in Graph 6, are not quite as rosy. There’s been a significant pickup in bar and restaurant sales north of the border since the nosedive in early 2020, but there’s still a distance to go to achieve full recovery.
But the Canadian chart is interesting for another feature. It shows three clear dips corresponding with the three most devastating outbreaks, or ‘waves’, of coronavirus infections, with the latest one still exerting a negative grip.
Widespread vaccination coverage in the U.S. and Canada, with more than half the population in both countries having received at least one ‘shot’, has greatly increased confidence that 2021 will see extraordinarily vigorous GDP growth.
But there’s still that nagging worry that new variants of the disease, finding a ‘playground’ among the remaining pockets of the unvaccinated, may somewhat derail otherwise optimistic expectations.
The rest of the graphs in this article, with accompanying explanatory text boxes, delve into the some of the finer detail about the retail spending sides of the U.S. and Canadian economies.
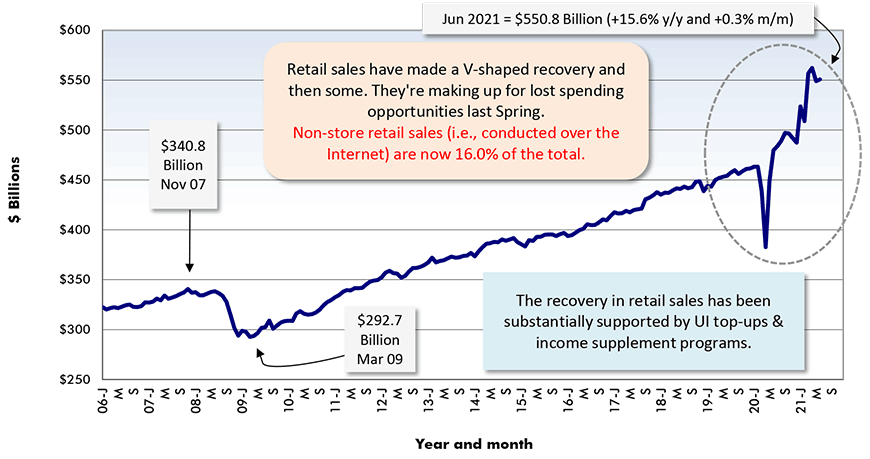
Latest data point is June, 2021.
Chart: ConstructConnect.
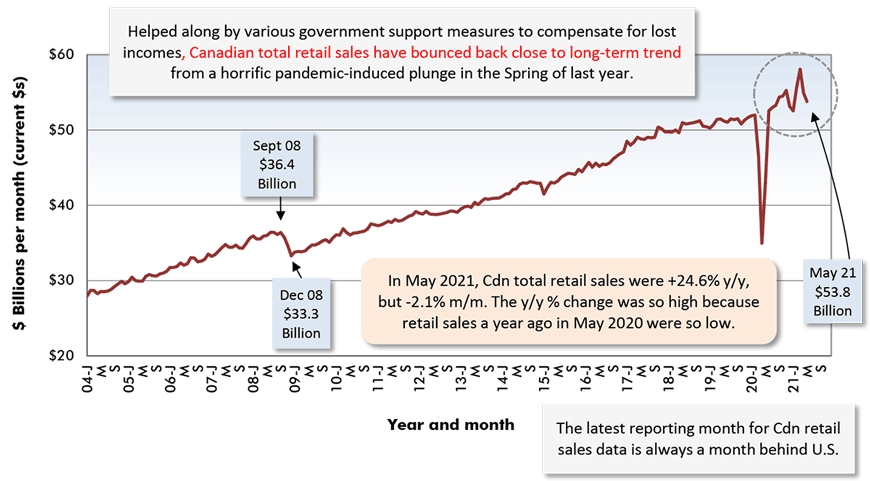
Chart: ConstructConnect.
Adjusted for seasonal variation, holiday and trading day differences, but not for price changes.
Chart: ConstructConnect.
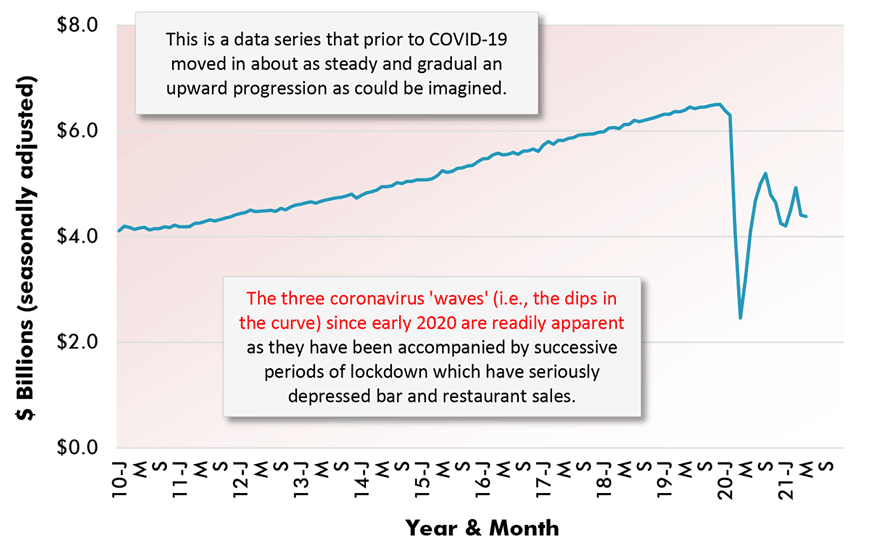
Chart: ConstructConnect.
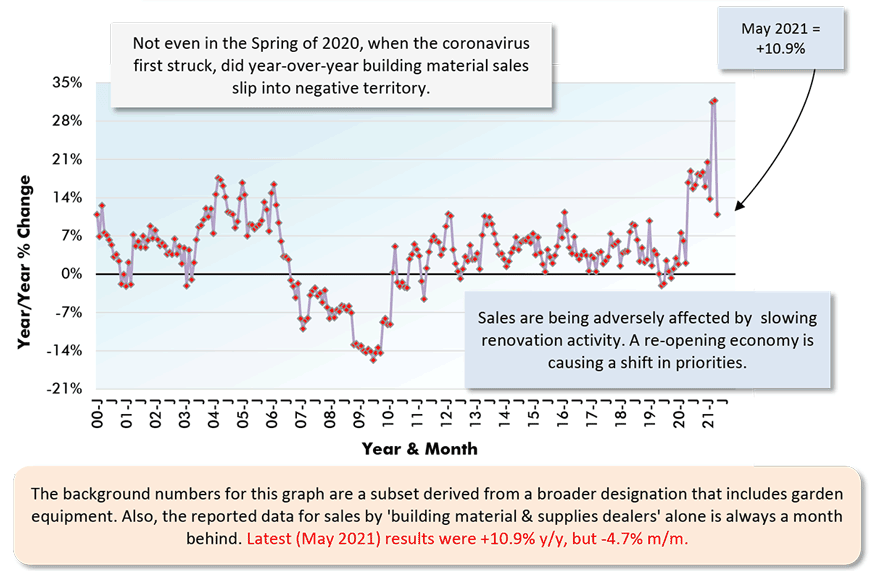
Chart: ConstructConnect.
Based on ‘current’ (i.e., not adjusted for inflation) dollars. Latest data points are for May, 2021.
Adjustments are for seasonal variation, holiday and trading day differences, but not for price changes.
Chart: ConstructConnect.
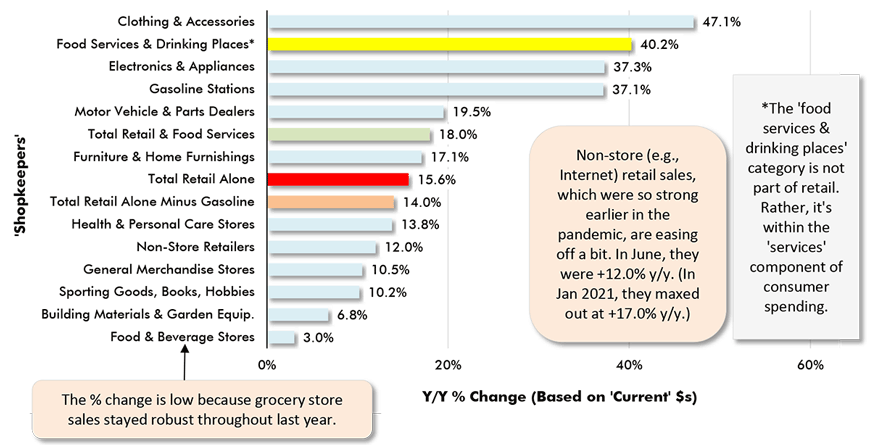
Chart: ConstructConnect.
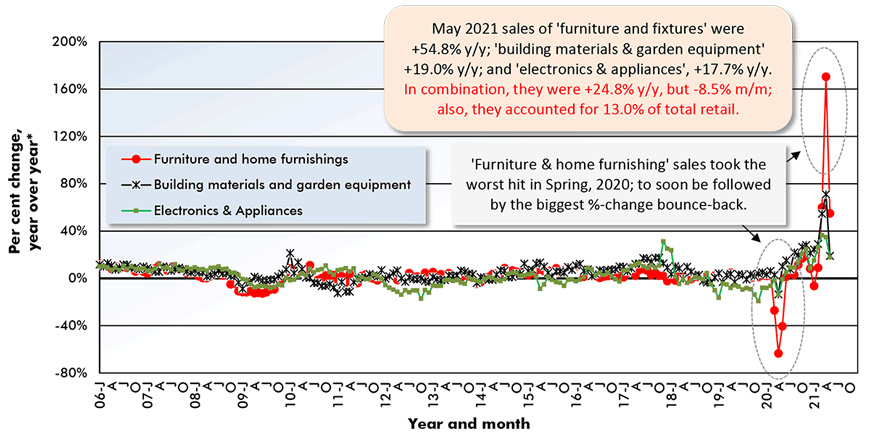
*"Year over year" is each month versus the same month of the previous year.
‘Based on ‘current’ (i.e., no accouting for inflation) dollar and seasonally adjusted data.
Chart: ConstructConnect.
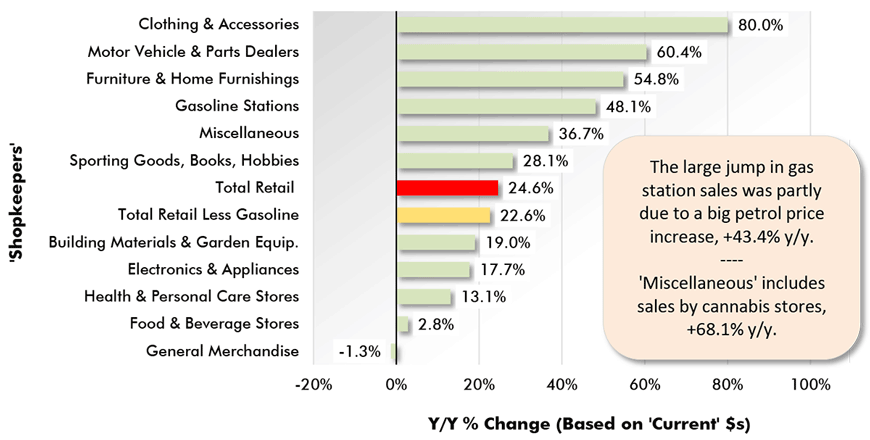
Chart: ConstructConnect.
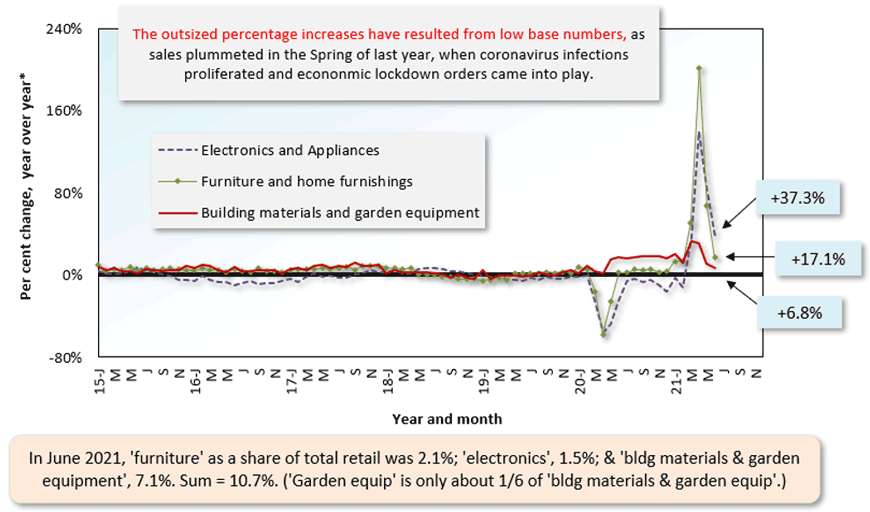
May 2021 Year-over-Year (Y/Y) & Shares
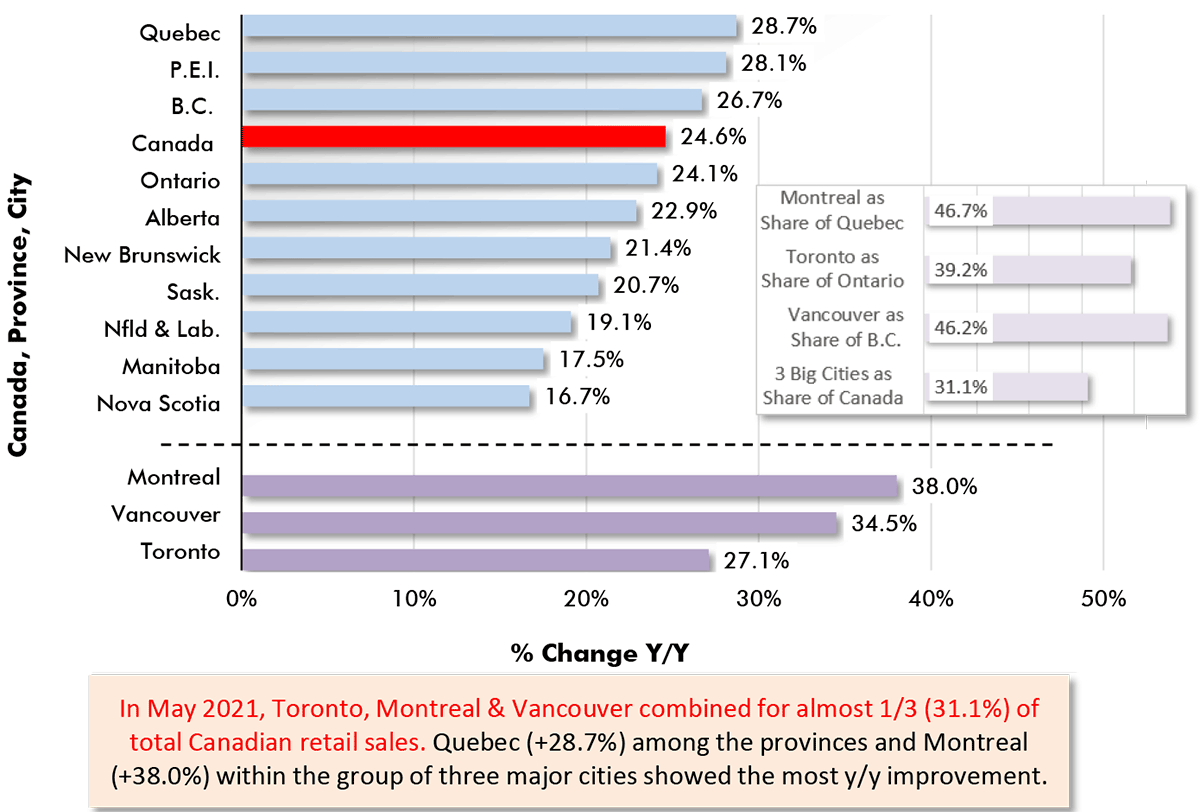
Chart: ConstructConnect.
Based on Data Adjusted for Seasonal, Holiday & Trading Day Differences
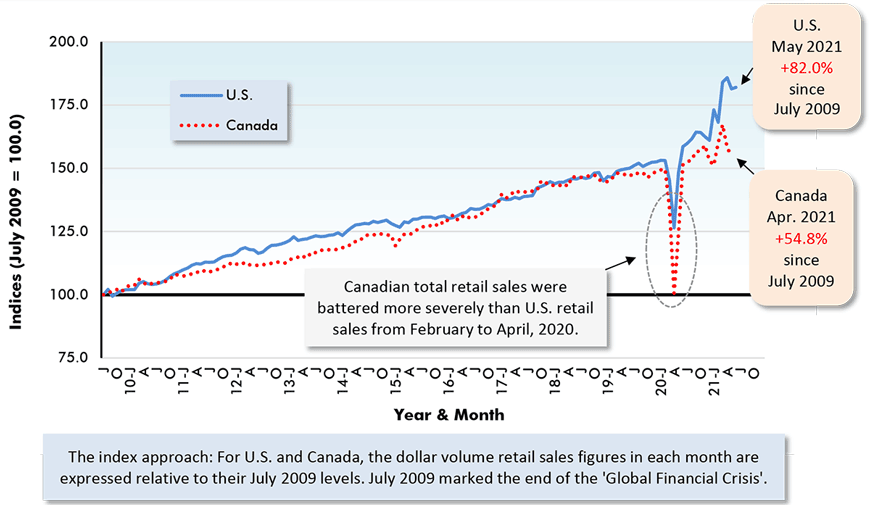
Chart: ConstructConnect.
Please click on the following link to download the PDF version of this article:
Economy at a Glance Vol. 17, Issues 118 and 119 – 2021 U.S. & Canadian GDP Growth to be Outstanding Provided No Next Wave(s) – PDF
Alex Carrick is Chief Economist for ConstructConnect. He has delivered presentations throughout North America on the U.S., Canadian and world construction outlooks. Mr. Carrick has been with the company since 1985. Links to his numerous articles are featured on Twitter @ConstructConnx, which has 50,000 followers.


Recent Comments