Two-Thirds of U.S. Jobs Gain from Two Sectors
July was an excellent month for jobs creation in the United States. According to the Bureau of Labor Statistics (BLS), total employment in America last month rose by +943,000 positions.
Furthermore, the prior month’s gain has been revised considerably higher. June’s increase was originally reported as +850,000 jobs. It is now appearing in the Employment Situation Report as +938,000. That’s a bonus of +83,000 jobs.
Therefore, net jobs in June and July were each just a little shy of +950,000. The jobs recovery ratio (a.k.a., the ‘claw-back’ ratio), which refers to the proportion of February to April 2020’s huge drop in staffing (when the coronavirus flare-up first paralyzed economic activity), has improved to 75%, or three-quarters.
The seasonally adjusted (SA) unemployment rate has tightened to 5.4%. In the prior month, it was 5.9% and a year ago, 10.2%. The not seasonally adjusted (NSA) unemployment rate now sits at 5.7%, down from 6.1% in June and much better than the 10.5% recorded in July 2020.
Something important to note, though, is that the jobs jump in July wasn’t particularly widespread. It came mainly in just two sectors, ‘leisure and hospitality’ and ‘government’. Net employment in the former rose by +380,000, and in the latter, by +240,000. Their combined increase of +620,000 was about two-thirds of the +943,000 climb in total employment.
In ‘leisure and hospitality’, hotel and motel employers took on +74,000 new hires and bar and restaurant owners welcomed back +253,000 helpers.
The ‘government’ increase in employment was all at the local level and tied to recruitment in the educational field.
The construction sector participated sparingly in the latest month’s hiring spree. July’s number of onsite workers rose by only +11,000. Construction’s NSA unemployment rate is now 6.1% compared with 8.9% at the same time last year.
The manufacturing sector’s NSA unemployment rate has dropped to 4.2% versus 8.6% twelve months ago. Manufacturers added +27,000 workers to their payrolls in July.
As an interesting aside, the U rate in ‘leisure and hospitality’ now stands at 9.0%. It was a horrendous 25.0% in July 2020.
Graph 1: U.S.: Month-to-month Total Jobs Creation
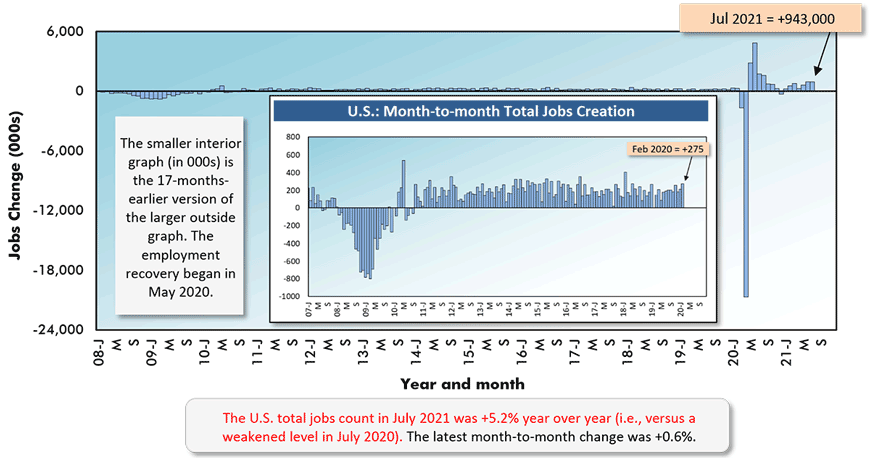
Chart: ConstructConnect.
Table 1: Monitoring the U.S. Employment Recovery – July 2021
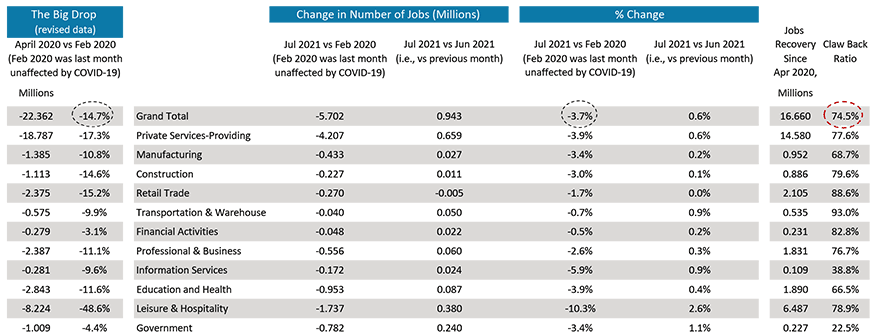
Chart: ConstructConnect.
Graph 2: U.S. Employment July 2021 – % Change Y/Y
Based on Seasonally Adjusted (SA) Data
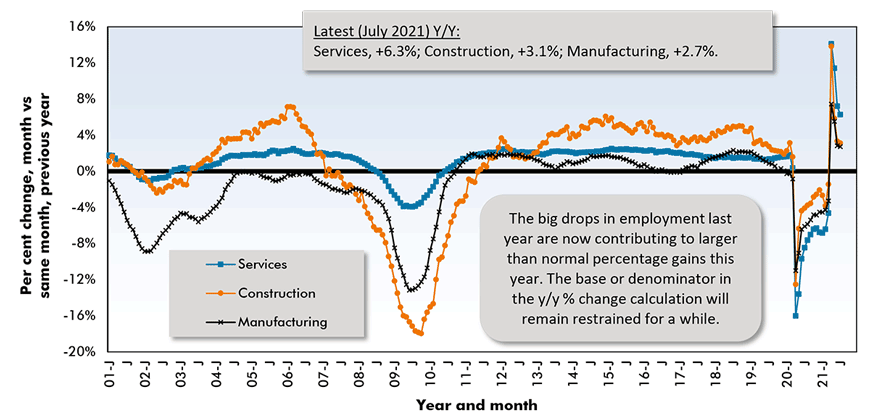
Chart: ConstructConnect.
Wages Warrant a Wary Eye on Inflation
If you’re someone who’s keeping a wary eye on inflation, know that the latest year-over-year increases in compensation have been more spirited than was the case pre-pandemic. For all jobs, July’s increase was +4.0% hourly and +4.6% weekly. Construction workers as a subset of ‘all jobs’ received +3.7% both hourly and weekly.
For ‘all jobs’ but leaving out bosses and concentrating only on production workers, the y/y paycheck gains in July were +4.7% hourly and +5.3% weekly. Those are hefty hikes. For construction workers, omitting supervisors, the advances were +4.4% hourly and +4.7% weekly.
Canada Switches to Full-time Job Gains
Canada’s total employment in July rose by +94,000 jobs and, in a radical departure from June’s pattern, almost all the increase (+83,000) was in full-time as opposed to part-time work.
Canada’s jobs claw-back ratio, versus Spring 2020’s loss, has reached a commendable 92%.
The SA unemployment rate in Canada moved down from 7.8% in June to 7.5% in July. In July 2020, it had been 10.9%.
Besides the ‘headline’ U rate, Statistics Canada publishes what it has labelled an R3 U rate. R3 is calculated using the same stricter methodology concerning who is really, truly looking for work as is adopted by the BLS. R3 NSA U in July was 6.2%, not much different from the 5.7% figure for the U.S.
Again, though, the construction sector was a bystander amidst the jobs creation fervor. In fact, the number of onsite jobs north of the border in the latest month contracted by -4,000.
Canadian manufacturing added +9,000 jobs in July, but it was ‘accommodation and food services’ with the biggest bulge, +35,000 jobs.
Provincially, Quebec, Manitoba and British Columbia stand out for having low unemployment rates presently: 6.1%, 6.1% and 6.6% respectively.
B.C. and Ontario have achieved the largest year-over-year percentage increases in employment, +7.9% and +7.1% respectively. The Canada-wide y/y jobs change has been +6.1%. (In the U.S., total employment is +5.2% y/y.)
Graph 3: Canada: Month-to-month Total Employment Change
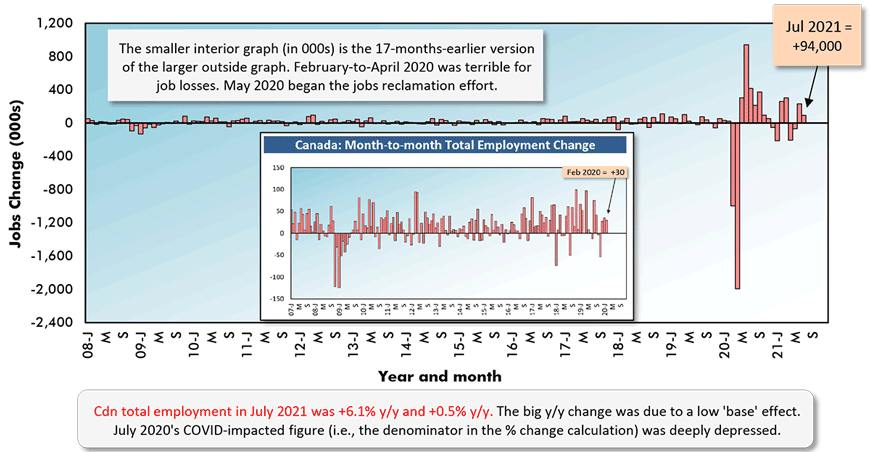
Chart: ConstructConnect.
Table 2: Monitoring the Canadian Employment Recovery ‒ July 2021
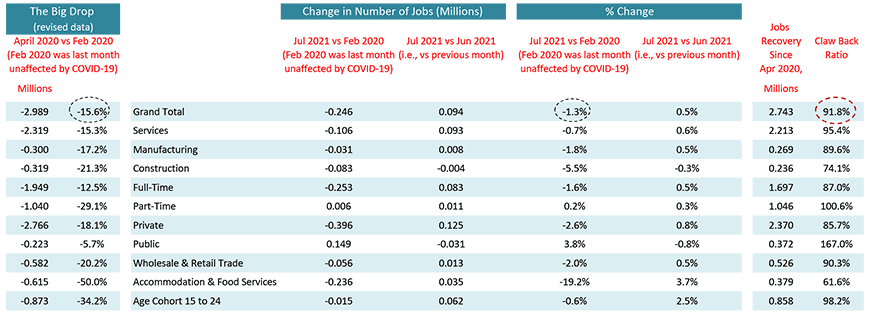
Table: ConstructConnect.
Table 3: Canada’s Provincial Labour Markets – July 2021
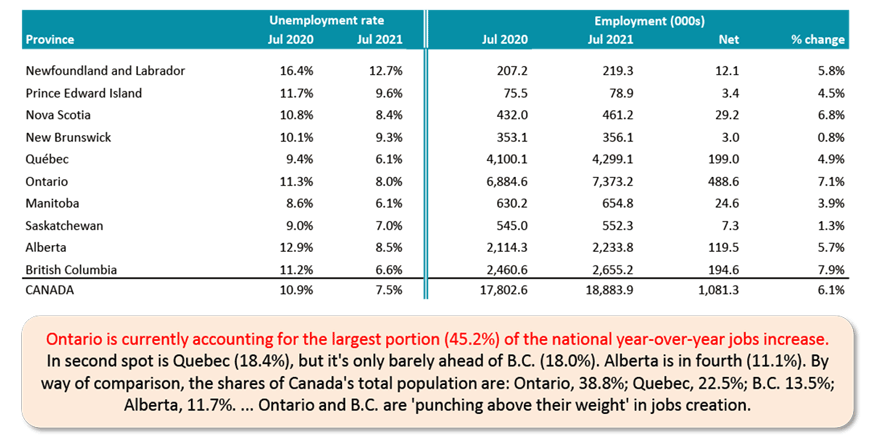
Table: ConstructConnect.
Graph 4: Canada’s Provincial Labour Markets – July 2021
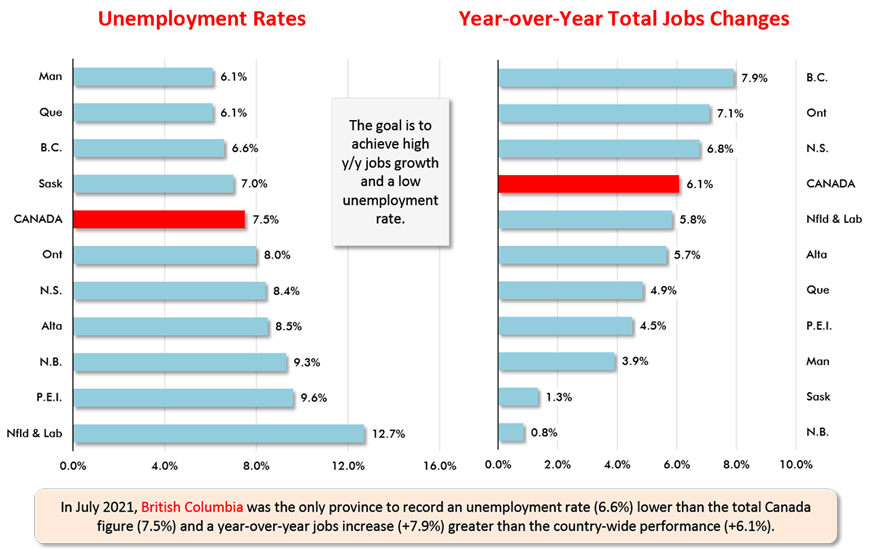
Chart: ConstructConnect.
Please click on the following link to download the PDF version of this article:
Economy at a Glance Vol. 17, Issue 117 – In July, No Slackening in U.S. or Canadian Jobs Recovery Pace – PDF
Alex Carrick is Chief Economist for ConstructConnect. He has delivered presentations throughout North America on the U.S., Canadian and world construction outlooks. Mr. Carrick has been with the company since 1985. Links to his numerous articles are featured on Twitter @ConstructConnx, which has 50,000 followers.




Recent Comments