
Top of mind for economic analysts these days is the question of how rapidly prices (or costs, from a different perspective) are moving, and in what direction. The construction sector, mainly on the residential side, has been plagued much of this year by extraordinarily large climbs in prices for forestry products. July’s Producer Price Index (PPI) results from the Bureau of Labor Statistics (BLS) show an abatement in this problem. Softwood lumber’s July PPI was -29.0% month to month and -16.3% over the latest three months. Nevertheless, it was ahead by a mighty +45.0% year over year; but in May, it had been +154% y/y.

For some other key material inputs, though, a letup in price/cost advance remains elusive. The ‘hot rolled steel bars, plates and structural shapes’ PPI is +6.0% m/m, +10.5% over the latest three months, and +43.7% y/y. The ‘aluminum sheet and strip’ PPI is +2.3% m/m, +7.8% over the latest three months, and +41.2% y/y.
Without further ado, therefore, let’s delve into some other pricing/costing issues, plus discuss other key statistical information appearing in recent public and private sector data releases.
(1) While there were some mild pullbacks in the year-over-year U.S. inflation numbers in July, the figures stayed inordinately high. The ‘core’ subset of the ‘all items’ Consumer Price Index (CPI) eased a little to +4.3% y/y from +4.5% y/y in June. The ‘energy’ sub-index retreated to +23.8% from +24.5%. Gasoline downshifted to +41.7% from +45.1%. Nevertheless, the ‘all items’ index in July stayed the same as in the prior month at +5.4% y/y. The Federal Reserve’s target for ‘all items’ inflation, under normal circumstances, is +2.0%. A theme that is likely to keep repeating in the months ahead is that normal cyclical recovery patterns won’t necessarily apply when exiting a pandemic.
(2) One standout indication of abnormal price activity can be found in the motor vehicle marketplace. The ‘used car and truck’ sub-index of the CPI in July was up an incredible +41.7% y/y. The cost of new vehicles was more restrained, +6.4% y/y. But the availability of new vehicles is being tested. Several of the major carmakers have been forced to alter production schedules and cancel shifts due to supply shortages of key components. The most serious shortfall is in the computer chips used to monitor and guide systems in today’s road warrior machines.
(3) Canada’s inflation numbers have heated up as well, but not to quite the same extent as in the U.S. The Canadian all-items CPI in July was +3.7% y/y, accelerating a little versus June’s +3.1%. ‘All items less food and energy’ was +2.8%, speeding up from +2.2% the month prior. ‘Energy’ in July stayed almost the same as in June, +19.7% y/y compared with +19.5%. And while gasoline showed a big jump in July, +30.9% y/y, it was a slight step back from June’s +32.0% y/y. The Bank of Canada, when assessing inflation with an eye towards interest rate policy (i.e., too much inflation and it’s time to ‘tighten the screws’), puts its faith in three specially calculated indices labelled ‘common’, ‘median’ and ‘trim’. The average price gain for those three indices in July was +2.5% y/y, modestly ahead versus June’s +2.2%.
(4) Table 1 at the end of this report sets out some of the most interesting labor market comparisons between the U.S. and Canada. In both countries, the total number of jobs in the construction sector is up to almost the same degree year over year, +3.1% in America versus +3.4% north of the border. The not seasonally adjusted (NSA) unemployment rates are also close, 5.7% in the U.S. and 6.2% in Canada. (The Canadian NSA U rate has been adjusted to align with the stricter measurement stance adopted by the Bureau of Labor Statistics.)
(5) The most notable side-by-side statistics in Table 1, though, are the jobs recovery results (i.e., versus the enormous losses from February to April of last year, when the coronavirus first ‘rode into town’, inspiring lockdowns nearly everywhere.) Like the tortoise in the race with the hare, Canada’s jobs claw-back ratio of 91.8% is closer to the finish line (i.e., 100% or full recovery) than is the U.S., at 74.5%.
(6) Fourth-wave coronavirus cases, caused mainly by the Delta variant, are negatively impacting U.S. economic prospects. The consumer sentiment survey conducted by the University of Michigan recorded one of its largest ever month-to-month drops in August. The figure fell from 81.2 to 70.2, lower than at any time since December 2011.
(7) As of August 9th, Canada has re-opened the border to nonessential American visitors carrying proof that they have been properly and adequately vaccinated. This opens the door to an upsurge in tourism. The U.S. has not yet reciprocated with an easing of land border restrictions on Canadians wishing to travel south. Maybe it’s for the best. It will force Canadians to concentrate on their upcoming federal election, which PM Trudeau recently scheduled for September 20th.
(8) U.S. total retail sales in July were a disappointment, -1.5% month to month (but +13.3% y/y). Playing a significant role in leading them downwards were motor vehicle and parts dealer sales, -3.9% m/m. (Maybe that had something to do with the ‘chip’-related inventory shortage and the price hikes discussed earlier.) Other shopkeepers on a declining m/m revenue path in July included building material and garden equipment suppliers, -1.2% (although +7.5% y/y), and non-store retailers, -3.1% (i.e., sales made through Internet platforms). Food services and drinking place sales in July were +1.7% m/m and, most impressively, +38.4% y/y.
(9) As with many other current statistics, U.S. latest housing starts were okay in July, but they weren’t quite as gung-ho as a little while earlier. In July, they were 1.534 million units seasonally adjusted and annualized (SAAR), off a bit from 1.650 million in June. They were also slightly below the monthly average for the first half of the year, 1.6 million units. Regionally, the biggest setbacks occurred in the Northeast (from 144,000 units SAAR to 73,000) and the South (from 433,000 to 384,000).
(10) Canadian housing starts in July also moderated, to 272,176 units SAAR from 281,200 in June and a first-half average just under 300,000. The percent changes in year-to-date (Jan-Jul 2021/Jan-Jul 2020) housing starts in Canada’s three biggest cities, by population, have been led by Vancouver, +47%, followed by Montreal, +39%, with Toronto making only minor headway, +1%. In the nation’s three other cities with populations exceeding a million people each, year-to-date residential groundbreakings have been +77% in Calgary, +15% in Edmonton and +20% in Ottawa-Gatineau.
Table 1: U.S. and Canadian Jobs Markets – July 2021
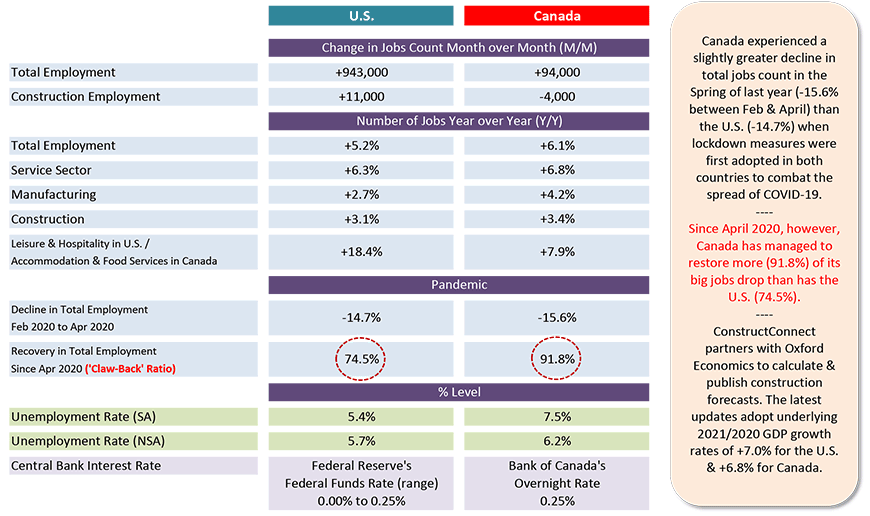
U.S. labor data is from a ‘payroll survey’ / Canadian labour data is from a ‘household survey’.
Canadian NSA unemployment rate ‘R3’ is adjusted to U.S. concepts (i.e., it adopts U.S. equivalent methodology).
Table: ConstructConnect.
Please click on the following link to download the PDF version of this article:
Economy at a Glance Vol. 17, Issue 122 – Ten Mid-August Economic Nuggets – PDF
Alex Carrick is Chief Economist for ConstructConnect. He has delivered presentations throughout North America on the U.S., Canadian and world construction outlooks. Mr. Carrick has been with the company since 1985. Links to his numerous articles are featured on Twitter @ConstructConnx, which has 50,000 followers.


Recent Comments
comments for this post are closed