
The seven (potentially) standalone graphs in this article show how inflation, according to the traditional Consumer Price Index (CPI) means of measurement, has been heating up in both the U.S. and Canada.
 Graphs Graphic")
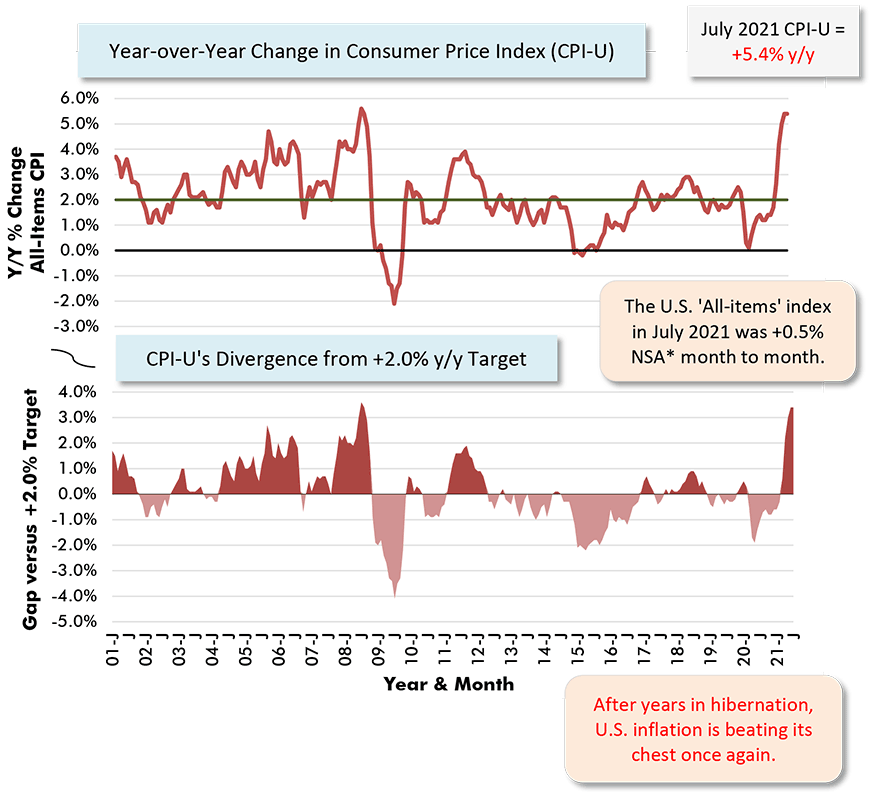
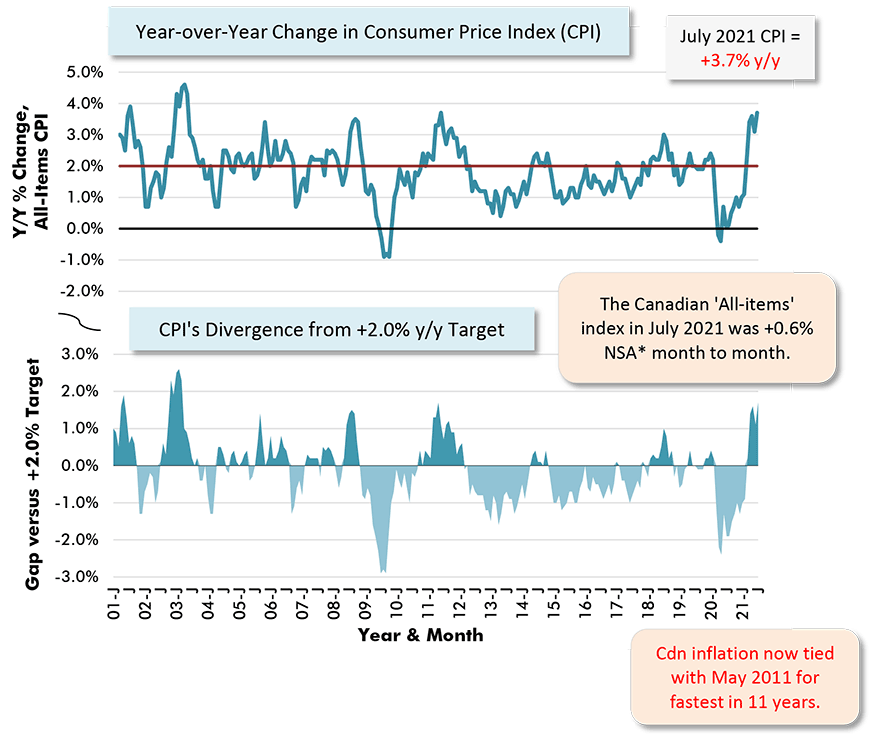
The U.S. is seeing a little more rapid price movement than is Canada. America’s CPI-U (inflation for all urban dwellers) was +5.4% year over year in July versus Canada’s comparable figure of +3.7% y/y. For both nations, though, the rate of upwards price movement is currently the fastest in a decade-plus.
Central banks usually adopt a +2.0% y/y general price increase as their target. They’re accepting a more rapid pace as a perceived necessary side effect for the economy to escape the clutches of the pandemic. Eventually, however, they’ll wish to restore that +2.0% goal.
The key question is whether returning to such a modest rate of inflation will be easy to achieve (i.e., counting on present price climbs being due to temporary shortages that will even out over time) or will require a hard tough slog (i.e., a slowing of the economy through unwelcome and perhaps severe interest rate hikes).
For the economy at large, having never experienced anything quite like the last 16 months, there are no roadmaps with definitive signposts along the way.
(Not Seasonally Adjusted)
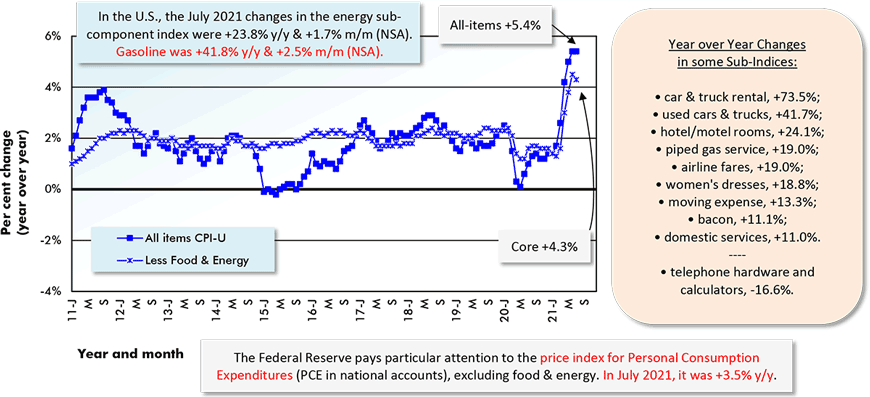
The U.S. figure (CPI-U) is the All Items Consumer Price Index for All Urban Consumers.
*Core inflation is CPI-U less its often most volatile sub-components, food and energy.
Chart: ConstructConnect.
(Not Seasonally Adjusted)
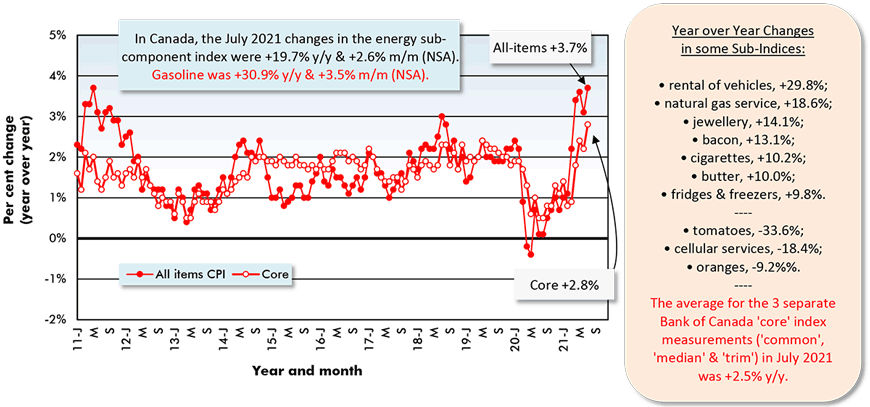
The Canada figure (CPI) is the All Items Consumer Price Index.
*Core inflation is CPI-U less its often most volatile sub-components, food and energy.
Chart: ConstructConnect.
(CPI & CPI-U Not Seasonally Adjusted)
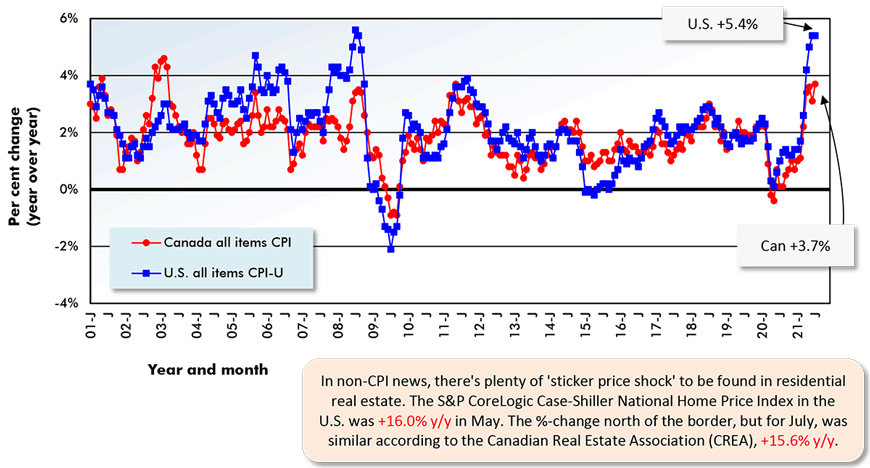
Based on not seasonally adjusted (aka NSA) index values.
Chart: ConstructConnect.
(CPI Core & CPI-U Less Food and Energy Not Seasonally Adjusted)
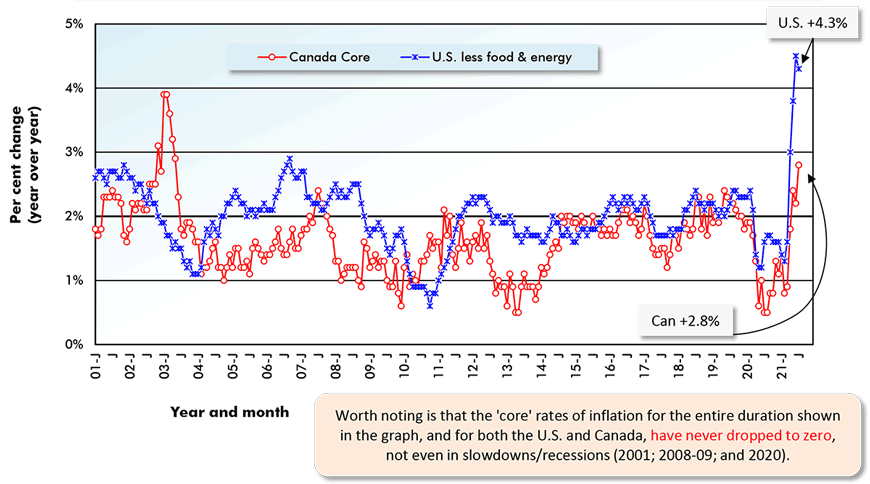
*Core is all-items inflation less its often most volatile sub-components, food and energy.
Chart: ConstructConnect.
Previous Month & Current Month (June & July 2021)
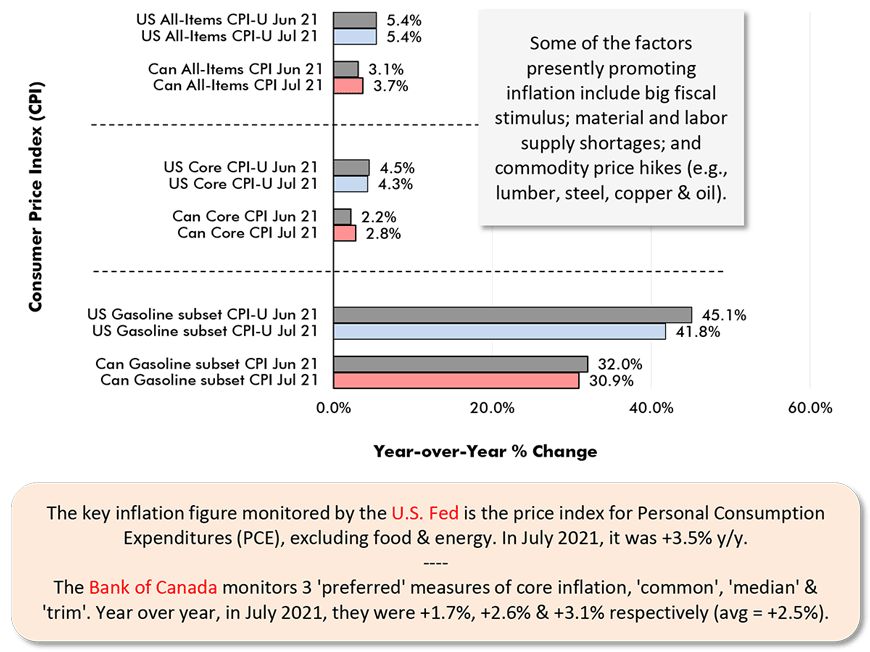
Chart: ConstructConnect.
CPI-U is for ‘All Urban Consumers, U.S. City Average’. A desirable rate of inflation is around +2.0% y/y.
Latest data points are for July, 2021. *NSA in the m/m change is ‘not seasonally adjusted’.
Chart: ConstructConnect.
For a variety of reasons, there is a desirable rate of inflation and it’s around +2.0% y/y.
Latest data points are for July 2021. (*NSA in the m/m change is ‘not seasonally adjusted’.)
Chart: ConstructConnect.
Alex Carrick is Chief Economist for ConstructConnect. He has delivered presentations throughout North America on the U.S., Canadian and world construction outlooks. Mr. Carrick has been with the company since 1985. Links to his numerous articles are featured on Twitter @ConstructConnx, which has 50,000 followers.


Recent Comments