
The 14 graphs in this article set out how housing starts have been performing so far this year (i.e., through July) in the U.S. and Canada, nationally and by regions, states/provinces and cities. There are also looks at the single-family homebuilding market versus the multi-unit segment.

The graphs, with accompanying text boxes, are meant to stand on their own, each with a story to tell. Many of the key takeaway points, however, are set out in the ‘bullets’ below.
The key observations concerning the U.S. homebuilding marketplace are as follows.
- U.S. nation-wide total housing starts have been ahead by one-fifth (+20.4%) as a monthly average of seasonally adjusted and annualized (SAAR) ‘dwelling unit’ figures year to date versus the same January-to-July time frame of 2020 (Graph 1).
- Groundbreakings on single-family starts (+27.0% ytd) have been considerably better than for multi-unit properties (+6.7%) (Graph 2 and 5).
- Total starts recovered nicely after a steep drop early in the pandemic, but their climb appears to have hit a ceiling around 1.6 million units (monthly annualized), where they’ve been hovering since the end of last year (Graph 3).
- Residential ‘permits’ (accepted as a leading indicator for groundbreakings) are still running a little faster (higher) than ‘starts’, but the gap has narrowed (Graph 4).
- On a year-to-date percentage-change basis, the Northeast and West Regions have recorded stronger increases in starts (+25.5% and +25.0% respectively) than the Midwest and South (+19.2% and +17.8% respectively) (Graph 5).
- On a month-to-month basis in July, however, only the South Region recorded an increase (+2.1%). The Midwest retreated by -6.9%; the West by -11.3%; and the Northeast by a dismal -49.3%. The Northeast in July 2021 also showed exceptionally badly compared with July 2020, -44.7% (Graph 6).
- Three of the four major cities in Texas continue to be dominant among all U.S. cities in a ranking of the level (in units) of year-to-date starts. Dallas-Ft Worth is number one; Houston, number two; and Austin, in fourth position (Graph 7).
- Philadelphia leads America’s 36 most populous cities in terms of year-to-date percentage change in housing permits/starts (Graph 8).
Studying the Canadian charts reveals the following:
- Canadian housing starts, as an average of monthly seasonally adjusted and annualized (SAAR) ‘dwelling unit’ figures are currently ahead by two-fifths (+41.2%) compared with January-July 2020 (Graph 10).
- The extraordinary buoyancy of Canadian starts is being achieved without help from the usual mainstay of the nation’s housing sector growth, Toronto (only +1% year to date). Several cities on the outskirts of Toronto, however, have been recording big percentage increases in starts: Oshawa, +198% ytd; Guelph, +130%; Barrie, +91%; Kitchener, +63%; and a little further afield, London, +114% (Graph 12).
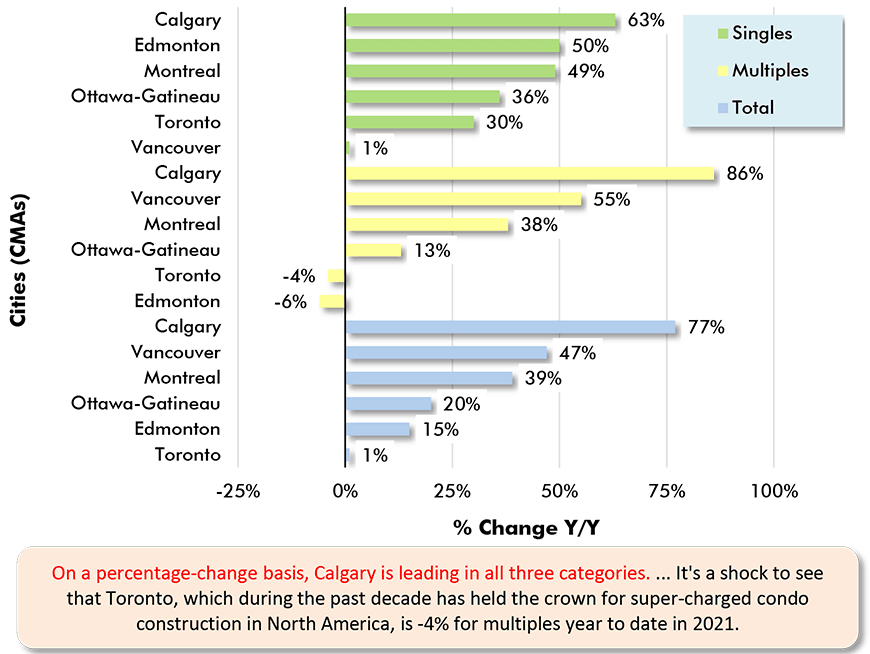
- Calgary is leading Canada’s six most populous cities in percentage-change of year-to-date starts according to all three designations, singles (+63%), multiples (+86%) and total (+77%). Vancouver (+47%) and Montreal (+39%), though, have also wrung up sizable percentage gains in total starts (Graph 14).
- British Columbia is the province hitting most above its weight in starts, with an increase of +19.1% year to date compared with a population share (of Canada’s total resident count) that is considerably lower, at 13.5% (bottom text box in Graph 12).
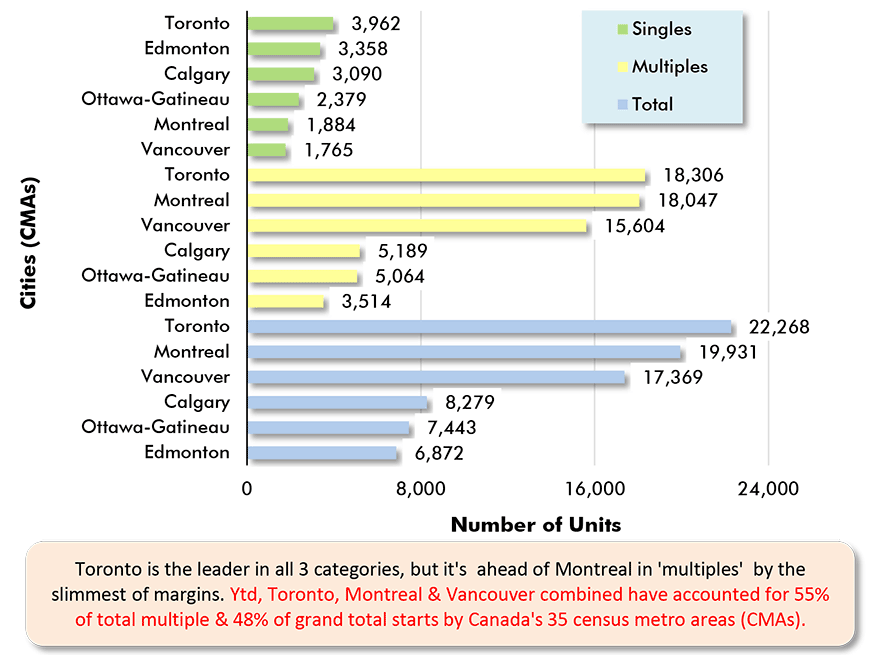
- If, perchance, one is thinking that Toronto’s role in the Canadian housing scene has faded into irrelevance, there’s one final statistic that jolts us back to reality. Toronto is still leading all Canadian cities in level of housing starts year to date (22,268 units), with a not exceptional, but still comfortable, lead over Montreal (19,900 units) (Graph 13).
Graph 1: U.S. Total Monthly Housing Starts
Seasonally Adjusted at Annual Rates (SAAR)
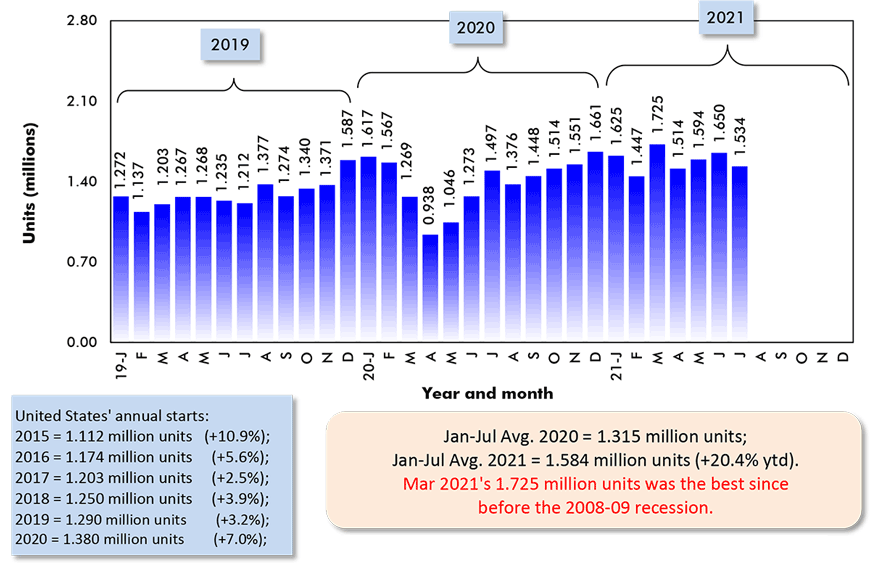
The last data points are for July 2021.
Data source: U.S. Census Bureau (Department of Commerce).
Chart: ConstructConnect.
Graph 2: U.S. Single-Family & Multi-Family Monthly Housing Starts
Seasonally Adjusted at Annual Rates (SAAR)
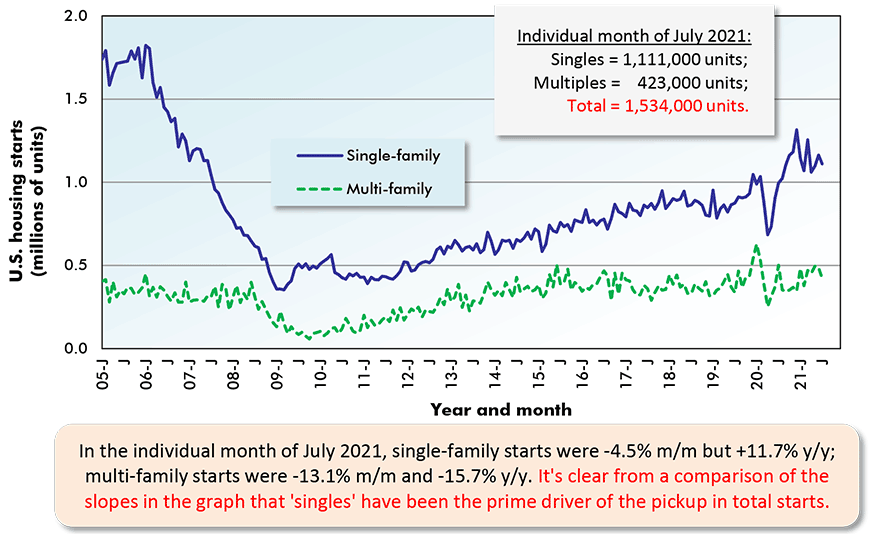
The last data points are for July 2021.
Data source: U.S. Census Bureau (Department of Commerce).
Chart: ConstructConnect.
Graph 3: U.S. Total Monthly Housing Starts
Seasonally Adjusted at Annual Rates (SAAR)
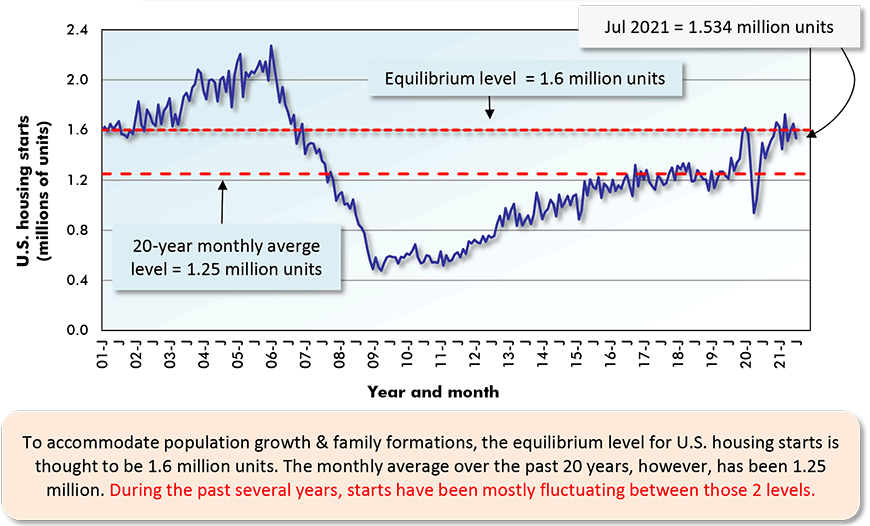
The last data point is for July 2021.
Data source: U.S. Census Bureau (Department of Commerce).
Chart: ConstructConnect.
Graph 4: U.S. Monthly Residential Building Permits
Seasonally Adjusted at Annual Rates (SAAR)
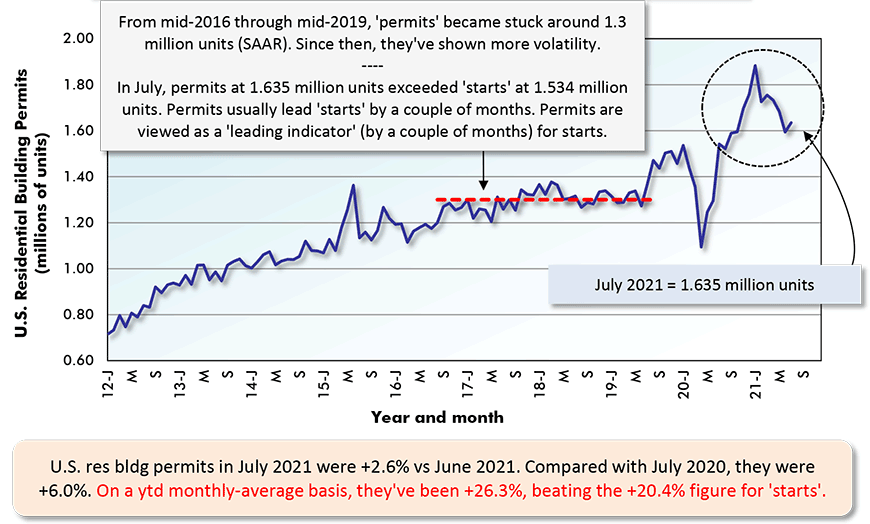
The last data point is for July 2021.
Data source: U.S. Census Bureau (Department of Commerce).
Chart: ConstructConnect.
Graph 5: U.S. Housing Starts
Jan-Jul 2021 vs Jan-Jul 2020 % Changes
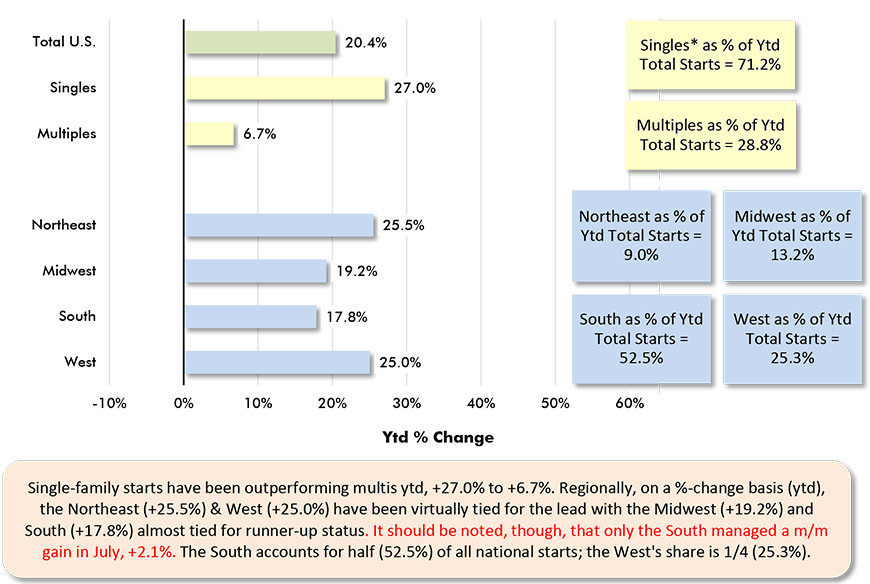
Based on averages of monthly seasonally adjusted and annualized (SAAR) unit starts.
* ‘Singles’ includes townhouse complexes, except when multiple units have common heating & air conditioning.
Data source: U.S. Census Bureau.
Chart: ConstructConnect.
Graph 6: U.S. Regional Housing Starts (SAAR) – July 2021
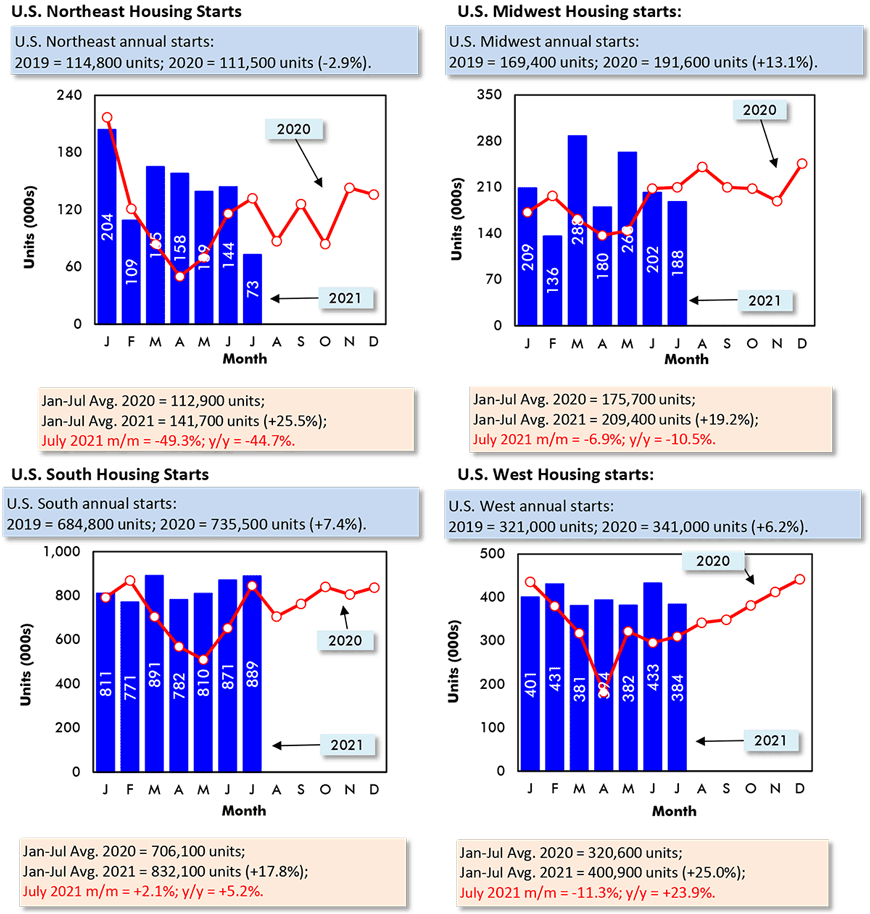
Data source: U.S. Census Bureau (Department of Commerce).
Chart: ConstructConnect.
Graph 7: Year to Date Residential Permits Issued (Units) in the 36 Most Populous U.S. Metro Statistical Areas (MSAs)
(Jan-Jul 2021)
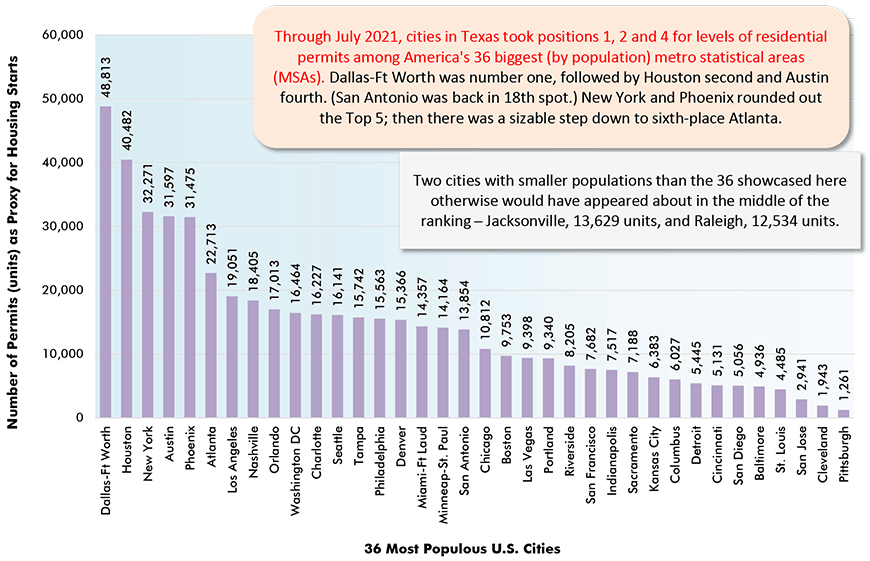
At the city level, the number of residential building permits issued serves as a proxy for housing starts.
Data source: U.S. Census Bureau.
Chart: ConstructConnect.
Graph 8: Percent Change in Year-to-Date Housing Permits Issued (Units) in the 36 Most Populous U.S. Metro Statistical Areas (MSAs)
(Jan-Jul 2021 vs Jan-Jul 2020)
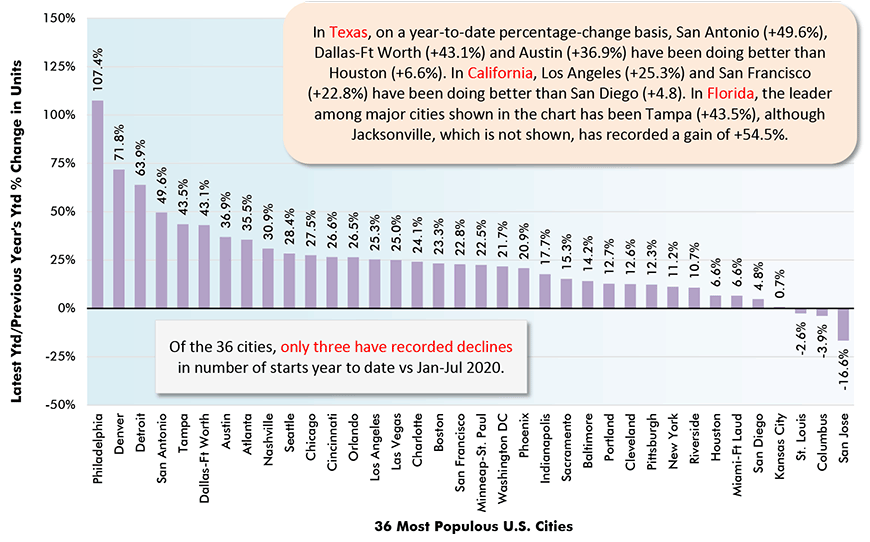
At the city level, the number of residential building permits issued serves as a proxy for housing starts.
Data source: U.S. Census Bureau.
Chart: ConstructConnect.
Graph 9: U.S. and Canada Monthly Housing Starts
Seasonally Adjusted at Annual Rates (SAAR)
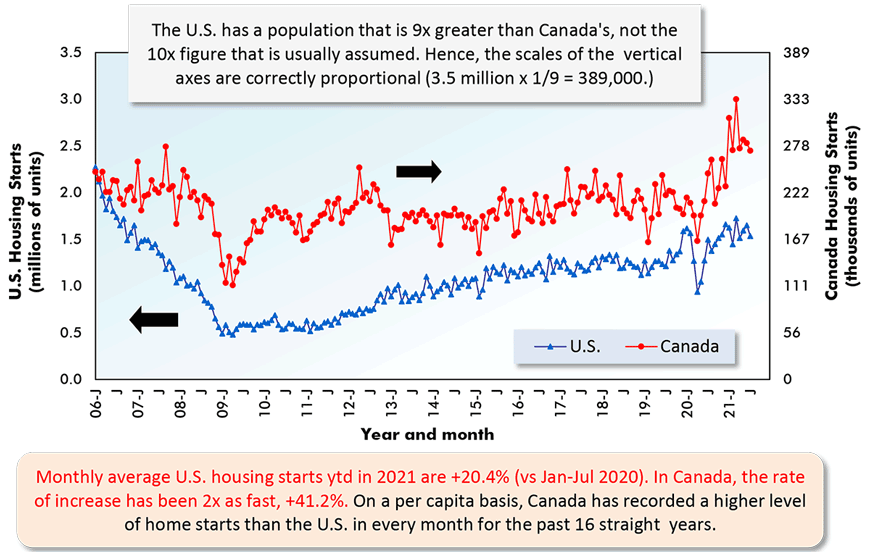
The last data points are for July 2021.
ARROWS: U.S. numbers to be read from left axis; Canadian from right axis.
Data sources: U.S. Census Bureau & Canada Mortgage and Housing Corp (CMHC).
Chart: ConstructConnect.
Graph 10: Canada Monthly Housing Starts
Seasonally Adjusted at Annual Rates (SAAR)
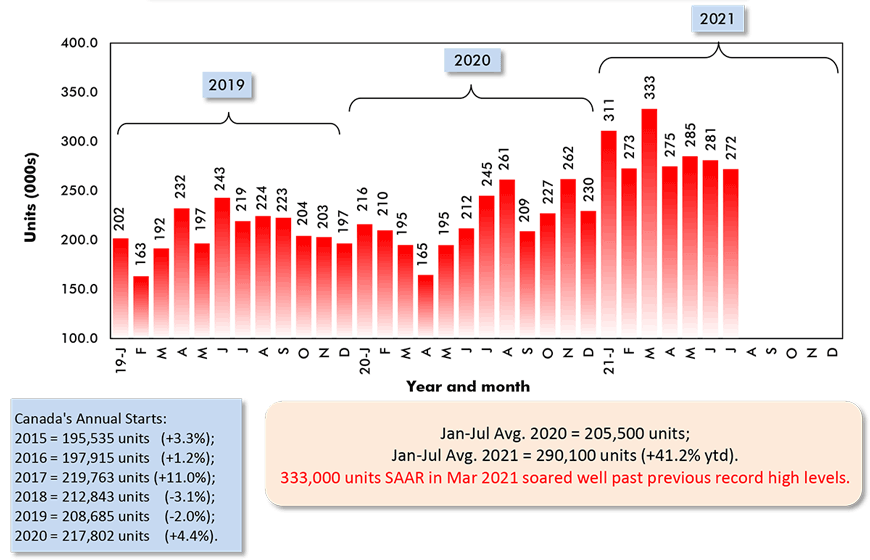
Data source: Canada Mortgage and Housing Corporation (CMHC).
Chart: ConstructConnect.
Graph 11: Percent Change in Year-To-Date Housing Starts –
Ranking Of Canada’s Provinces
(Jan-Jul 2021 vs Jan-Jul 2020)
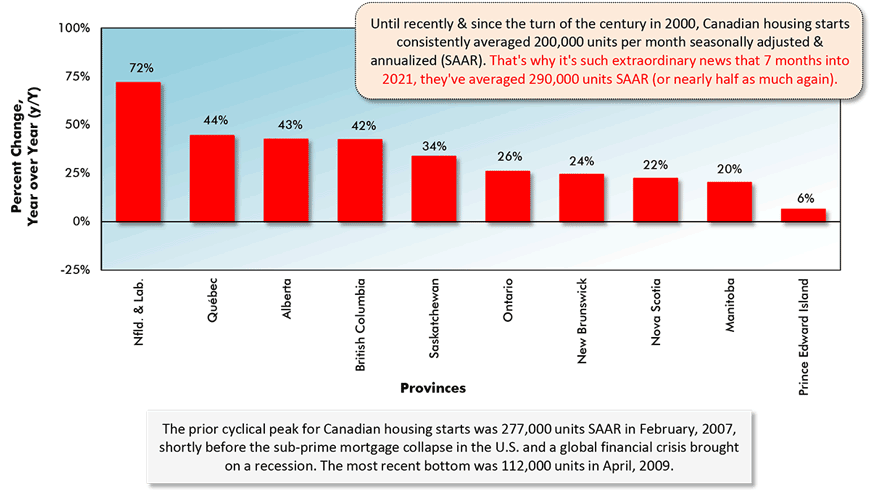
Data source: Canada Mortgage & Housing Corporation (CMHC) based on actuals rather than seasonally adjusted data.
Chart: ConstructConnect.
Graph 12: Percent Change in Year-To-Date Housing Starts –
Ranking Of Canada’s Major Cities
(Jan-Jul 2021 vs Jan-Jul 2020)
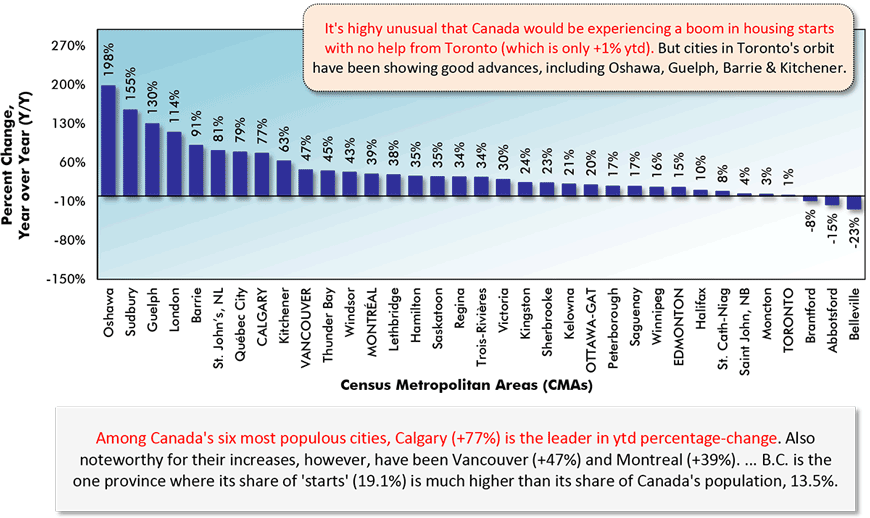
Canada’s Census Metropolitan Areas (CMAs) have core populations of 50,000 plus.
Canada’s 6 CMAs with populations in excess of 1 million are in capital letters.
Data source: Canada Mortgage & Housing Corporation (CMHC) based on actuals rather than seasonally adjusted data.
Chart: ConstructConnect.
Graph 13: Housing Starts in Canada’s 6 Most Populous Cities
January to July 2021 Actuals
Data source: Canada Mortgage & Housing Corporation (CMHC).
Chart: ConstructConnect.
Graph 14: Housing Starts in Canada’s 6 Most Populous Cities
Jan-Jul 2021 vs Jan-Jul 2020
Data source: Canada Mortgage & Housing Corporation (CMHC).
Chart: ConstructConnect.
Alex Carrick is Chief Economist for ConstructConnect. He has delivered presentations throughout North America on the U.S., Canadian and world construction outlooks. Mr. Carrick has been with the company since 1985. Links to his numerous articles are featured on Twitter @ConstructConnx, which has 50,000 followers.
Please click on the following link to download the PDF version of this article:
Economy at a Glance Vol. 17, Issues 123, 124, 125 and 126 – U.S. Home Building Up by One-fifth; Canadian Up by Two-fifths – PDF


Recent Comments