
It would be comforting to think the post-pandemic economic recovery will proceed along the same path as other post-recession recoveries. No doubt there will be some similarities; but there will also be major differences.

No one is quite sure about the extent to which personal preferences have been changed by the health crisis of the past year and a half. Extended periods of staying at home by much of the work force have altered outlooks on the work-play lifestyle balance. Shopping online has been accelerated. Commutes to the office have been greatly reduced, to the delight of many. Some of the thrill attached to hopping on a plane for travel has been sanded off.
From a construction standpoint, what will this mean for shopping mall, office tower, rapid transit and airport groundbreakings? Owners will be re-thinking some capital spending plans.
Also, as the economy moves forward, the public administration side of the decision-making process will be steering affairs towards the achievement of two complementary goals, full-on ‘electrification’ (as a means to heat and cool homes, power motor vehicles and so on) and ‘de-carbonization’. Also, tied to those two goals, but augmented by a host of other factors, there’s a third underlying trend to be aware of, an apparent long-term increasing cost framework. There will be more on this subject in a moment.
With the foregoing as background, there are the following NUGGETS to be gleaned from the latest private and public sector data releases.
(1) Everyone is shocked by the excessive inflation rate these days. They shouldn’t be. There are quite a number of influences pushing prices higher. Nor is this likely to be the short-term phenomenon that central bankers are hoping for. Wages, hourly and weekly, have shifted up from a historical norm between +2.0% and +2.5% year over year to +4.5% to +5.5% presently. Commodity prices, after lying dormant for a dozen years, are finally moving upwards once again, and commodities are the building blocks of everything on the ‘goods’ side of the economy. Governments, through their income support measures in the pandemic, have rung up enormous debt that’s going to translate to higher taxes at some point. Also, eventually, interest rates will be rising.
(2) Also, while it may not be popular to say so, the two goals of ‘electrification’ and ‘de-carbonization’ mentioned above will be expensive. Homeowners will be upgrading their power systems to accommodate solar panels, more electric appliances and the re-charging of their new, and still pricey, electric vehicles. Cement, steel and aluminum producers are all budgeting substantial capital spending to make their processes cleaner. Money spent on such ‘green’ initiatives, as worthy as they may be, nevertheless divert sums away from the capacity expansions that would increase output and alleviate costly supply shortages.
(3) August’s year-over-year change in the U.S. ‘all items’ Consumer Price Index (CPI) was +5.3%, shaving only a little off the +5.4% figure recorded in both July and June. The ‘all items’ rate is also often referred to as the ‘headline’ rate of inflation and it has been above +5.0% y/y for the past four months. August’s ‘core’ inflation rate, which omits volatile food and energy items, was +4.0%, down a bit from +4.3% in July and +4.5% in June. Some inflation, of around +2.0% y/y, is generally perceived as a good thing. Too much inflation, though, if sustained, (and +5.0% y/y is too much inflation) will lead to problems. Individuals on fixed incomes will be the first to feel the negative effects.
(4) U.S. energy prices in August were +25.0% y/y. Regular unleaded gasoline was +42.7% y/y. The CPI sub-index for used cars and trucks was +31.9% y/y. The sub-index for piped utility natural gas service was +21.1%. Natural gas has been one of those commodities referred to earlier as increasing in price. U.S. natural gas now goes for about $5.00 USD per million British Thermal Units. For a long time, it was less than $3.00. But here’s something important to know. In many of the countries in Europe, the MMBTU price of natural gas, much of it supplied by Russia, has been exceeding $20.00 USD. That’s four times more expensive than in the U.S. and Canada. Concerns about the financial viability of proposed liquefied natural gas (LNG) projects in North America are being washed away. There is abundant potential revenue generation from exports.
(5) In August, Canada’s CPI inflation rate increased to +4.1% y/y. It had been +3.7% in July. The +4.1% figure is the fastest y/y rate of advance since the +4.3% jump recorded more than 18 years ago, in March 2003. Canada’s energy CPI sub-index in the latest month was +20.7% and its gasoline sub-index, +32.5% y/y.
(6) For the reporting period ending two weeks ago on September 4, 2021, the U.S. initial jobless claims number, at 312,000, came tantalizingly close to dropping below the 300,000 level that denotes when the labor market switches from being just okay to much improved. For the latest reporting week, however, the one ending on September 11th, initial jobless claims disappointed by shooting back up to 332,000. With COVID refusing to pack up and leave town, that seems to be the way it goes. Some weeks you win; some weeks, you backtrack.
(7) The dollar volume of U.S. retail sales in August was +13.1% year over year. Sales by gasoline stations were +35.7% y/y (remember the big increase of more than +40% in the price of petrol that was set out in point (4) above). ‘Motor vehicle and parts dealer’ sales were +10.7% y/y. The y/y receipts of ‘building material and garden equipment’ suppliers were +6.3%. (The ‘garden equipment’ portion of that combined category is about one-sixth.) Separate from retail sales but important as a component of consumer expenditures in the national accounts (i.e., gross domestic product statistics) are ‘food services and drinking place’ sales and in August, they were +31.9% y/y.
(8) Canada’s seasonally adjusted and annualized (SAAR) housing starts in August were 260,000 units. In any other month prior to this year, that would have been a shockingly high number. Among the eight months of 2021, however, it is the lowest number. (March was best at 333,000 units SAAR.) Canada is undergoing a housing starts boom. The monthly average for this year is still nearly 50% above the long-term monthly average running all the way from 2000 to 2020.
(9) In Canada’s six most populous cities, August’s year-to-date housing starts were +73% in Calgary; +34% in both Montreal and Vancouver; +20% in Edmonton; +5% in Ottawa-Gatineau; and -4% in Toronto. It’s very unusual for Toronto to be absent from the new homebuilding party.
(10) As a final observation, there’s a descriptive word with a nice ring to it that we’re going to be hearing a lot more of in connection with the infrastructure topic. That word is ‘resilient’ and it’s meaningful in terms of the wildfire and coastal storm damage being inflected by climate change. Future expenditures on infrastructure must incorporate tech advances (e.g., more heat resistant roadway paving), site locations (power lines buried underground) and other ‘tricks’ to minimize the downtime when disaster strikes. Talk of building ‘resilient infrastructure’ will be all the rage.
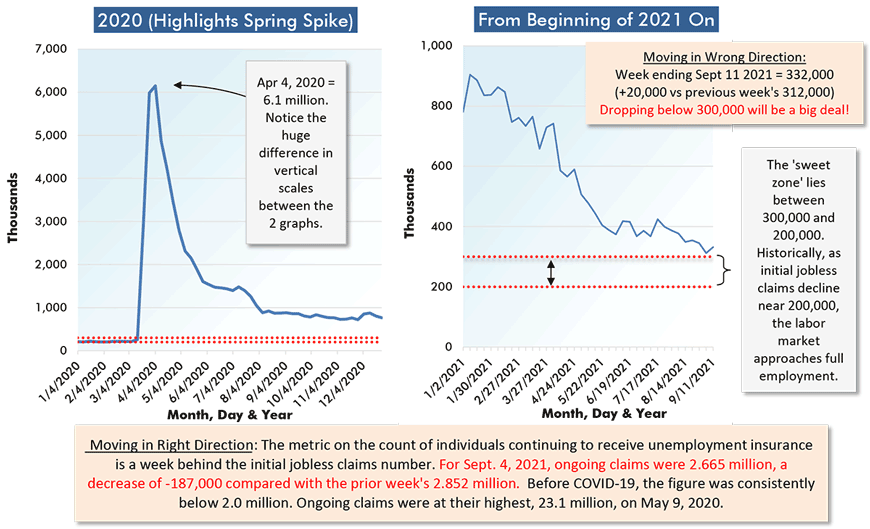
Chart: ConstructConnect.
Alex Carrick is Chief Economist for ConstructConnect. He has delivered presentations throughout North America on the U.S., Canadian and world construction outlooks. Mr. Carrick has been with the company since 1985. Links to his numerous articles are featured on Twitter @ConstructConnx, which has 50,000 followers.
Please click on the following link to download the PDF version of this article:
Economy at a Glance Vol. 17, Issue 137 – 10 Mid-September Economic Nuggets – Three Key Developing Trends – PDF


Recent Comments