
Canada’s foreign trade picture brightened considerably in June. The nation’s merchandise trade balance recorded its biggest surplus since before the 2008-2009 recession. Furthermore, there have now been four surpluses in the past six months. During the decade prior to this year, Canada’s monthly goods trade balance spent a lot of time below the zero x-axis (Graph 1). (‘Merchandise’ trade is a fancier way of saying ‘goods’ as opposed to ‘services’ trade.)

Giving a huge helping hand to Canadian trade, at present, is the pickup in the world economy, which is giving a boost to commodities demand and prices. For the construction sector, there’s a crucial counterbalancing aspect to higher commodity prices. Commodities (or raw materials) are the crucial building blocks of all construction materials (e.g., copper in wiring; iron ore in structural and rebar steel). Therefore, rising resource prices will lift construction input costs.
But there’s another aspect to consider. Higher prices for their extraction output are an incentive for resource owners to undertake expansion expenditures, historically accounting for some of the largest construction projects anywhere.
What Really Makes Canada Tick
A goods trade surplus makes a direct positive contribution to a country’s gross domestic product. Exports minus imports (X-M) is a line item in GDP.
Graphs 2 through 13 highlight a key factor in what enables the Canadian economy to function successfully. This is a truth that is often overlooked or brushed aside these days, when the focus instead is on high-tech work or the ‘greening’ of the environment.
Graphs 2 through 13 show the history of exports minus imports in eleven resource product areas. There’s only one instance where Canada doesn’t have an advantage in exports compared with imports, refined petroleum products. Outgoing and incoming trade in gasoline and other fossil fuel derivatives (as opposed to crude oil and natural gas) is about even (Graph 4).
Also, Canada no longer has the outsized trade lead in natural gas that it once had, due to U.S. capacity expansions tied to new fields made possible by hydraulic fracturing.
But in all other cases, Canada is running a surplus, and the X-M discrepancy is particularly large for crude oil (Graph 2), iron ore (Graph 7), copper (Graph 8), potash (Graph 11), aluminum (Graph 12), and forestry products (Graph 13).
The recent price gains for these commodities have been documented previously by ConstructConnect in the article Little Letup in U.S. and Canadian Construction Material Cost Increases. But it bears repeating that continuing commodity price strength will contribute significantly to Canada’s GDP growth and will be a spur to investment (a.k.a., construction) out in the sometimes-not-so-accessible field.
Plus, there’s another big construction implication to consider. The need for infrastructure spending has become a hot topic these days. In all the discussion about where the emphasis should be placed, let’s not forget improvements to the rail carrier systems and the port cargo handling and border crossing facilities that expedite the outwards flow of Canada’s resource bounty.
Pipeline construction should also be mentioned, but that subject has become so contentious, only elected politicians, working with indigenous groups, and turning for guidance from the courts, will have a shot at sorting out the direction to be taken.
U.S. Foreign Trade in Steep Slide
Near the end of this article is Graph 14 showing the U.S. foreign trade position in goods and services combined. In June, there was a shortfall of -$910 billion USD, made up of -$1,118 billion in goods and +$208 billion in services. The ‘goods’ X-M gap has sailed well past minus a trillion dollars and in June was at an all-time negative record.
This is unlikely to be sustainable. There are three solutions, none of them palatable: (1) higher interest rates to bring in more foreign investment (upping the capital account to offset the current account in the Balance of Payments); (2) more import restrictions through tariff or equivalent measures; and (3) a decline in the value of the greenback.
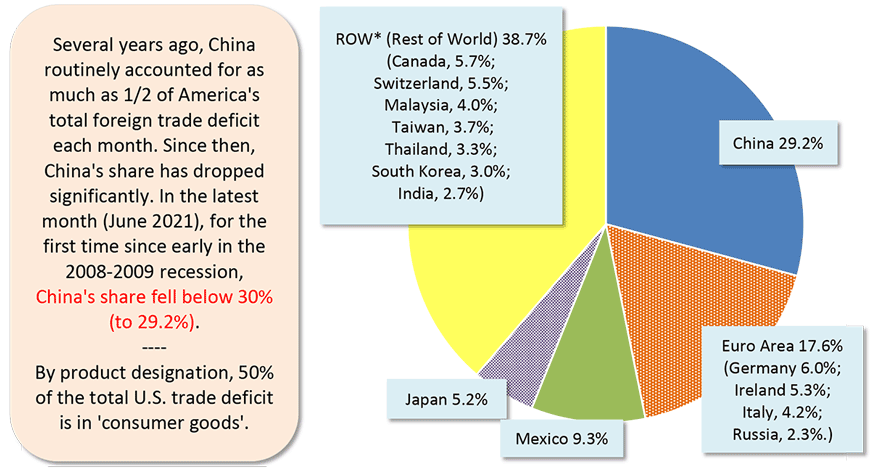
Interestingly, the share of America’s trade deficit originating with China has fallen significantly, from about 50% or half just a few years ago to a current proportion that has dropped under 30%. But some surprising other countries (e.g., Switzerland with a 5.5% share; Ireland, 5.3%) have stepped into the ‘void’.
Graph 1: Canada’s Foreign Trade: The Merchandise Trade Balance − June 2021
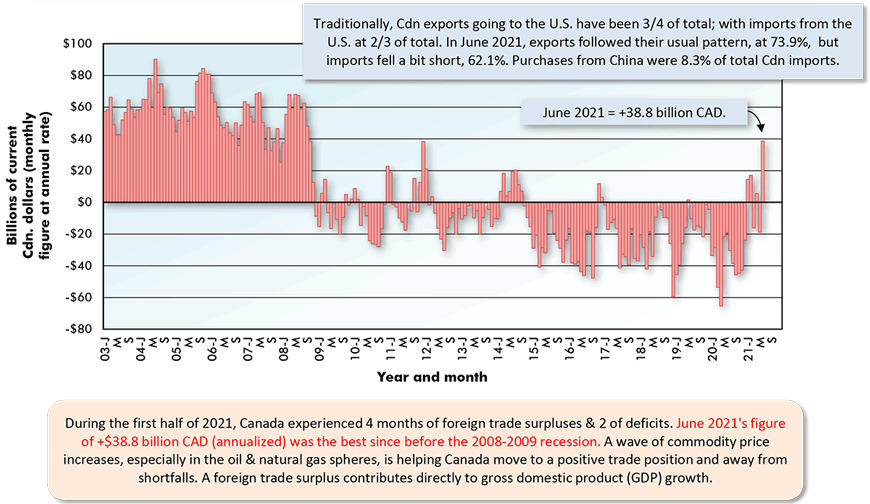
The last data point is for June 2021.
Based on seasonally adjusted monthly figures, projected at an annual rate.
Data source: Statistics Canada.
Chart: ConstructConnect.
Graph 2: Canada’s Foreign Trade in Crude Oil & Crude Bitumen
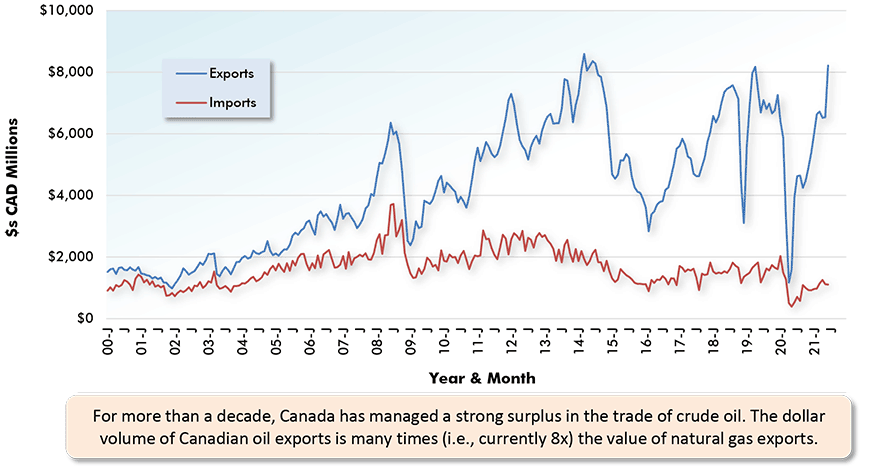
The latest data points are for June 2021.
Data source: Statistics Canada.
Chart: ConstructConnect.
Graph 3: Canada’s Foreign Trade in Natural Gas
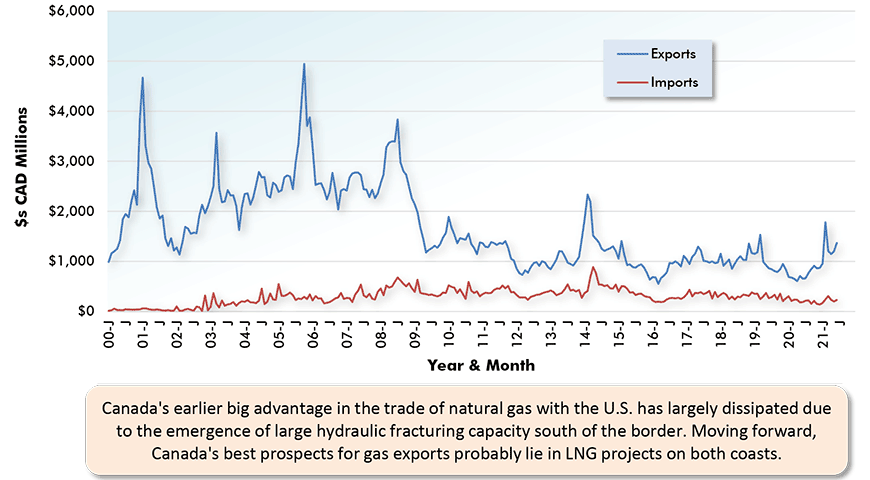
The latest data points are for June 2021.
Data source: Statistics Canada.
Chart: ConstructConnect.
Graph 4: Canada’s Foreign Trade in Refined Petroleum Product
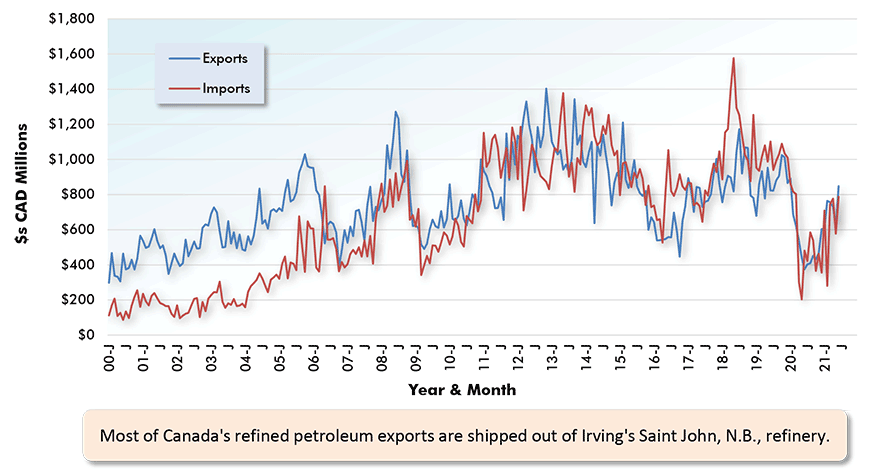
The latest data points are for June 2021.
Data source: Statistics Canada.
Chart: ConstructConnect.
Graph 5: Canada’s Foreign Trade in Electricity
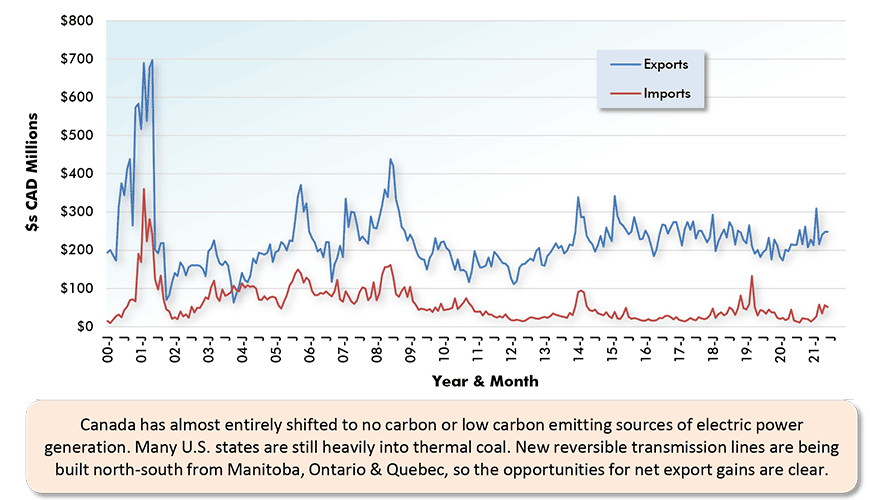
The latest data points are for June 2021.
Data source: Statistics Canada.
Chart: ConstructConnect.
Graph 6: Canada’s Foreign Trade in Coal
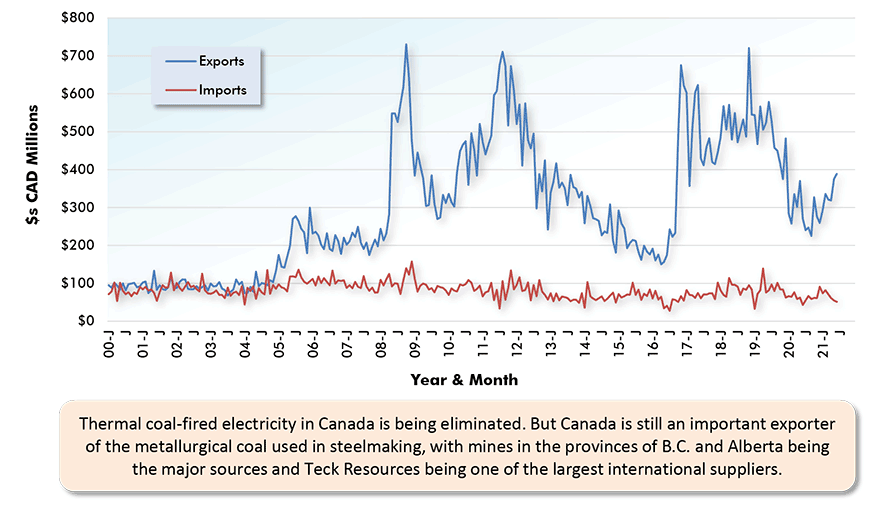
The latest data points are for June 2021.
Data source: Statistics Canada.
Chart: ConstructConnect.
Graph 7: Canada’s Foreign Trade in Iron Ore
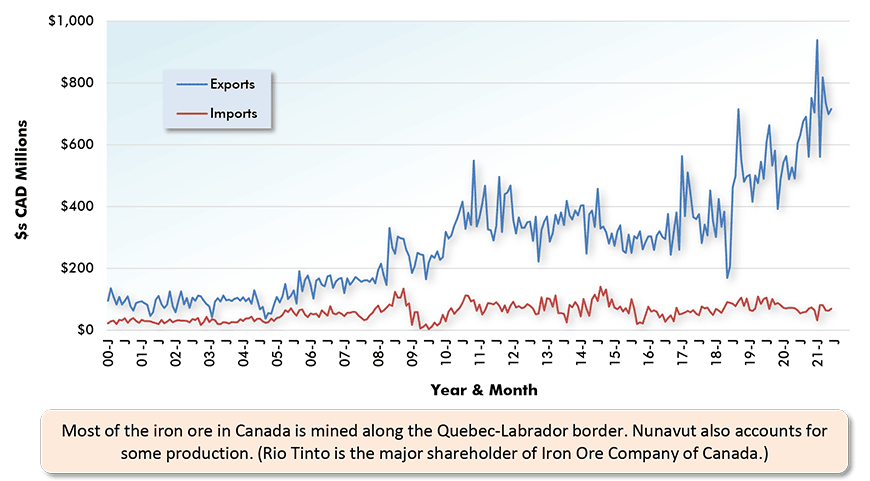
The latest data points are for June 2021.
Data source: Statistics Canada.
Chart: ConstructConnect.
Graph 8: Canada’s Foreign Trade in Copper
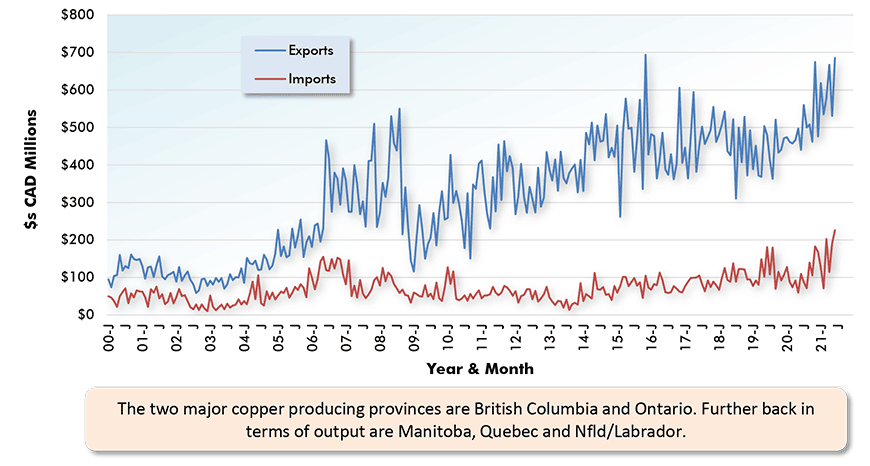
The latest data points are for June 2021.
Data source: Statistics Canada.
Chart: ConstructConnect.
Graph 9: Canada’s Foreign Trade in Nickel
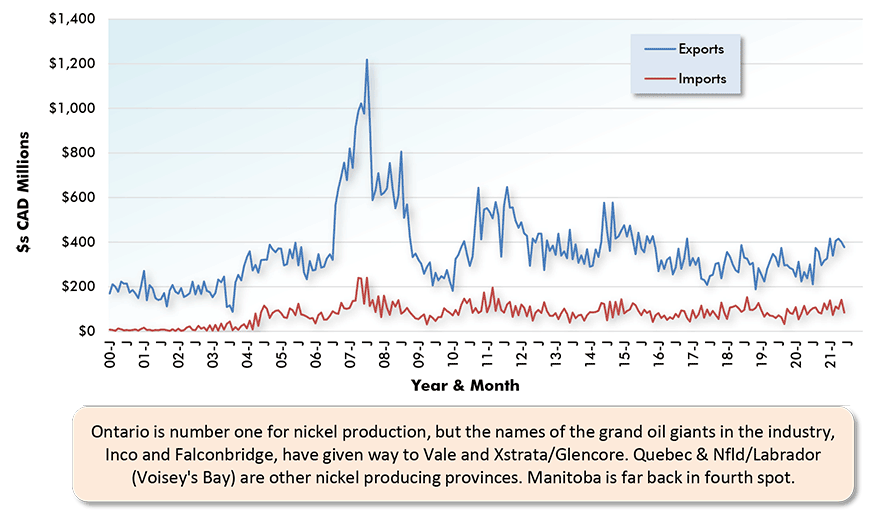
The latest data points are for June 2021.
Data source: Statistics Canada.
Chart: ConstructConnect.
Graph 10: Canada’s Foreign Trade in Gold, Silver & Platinum
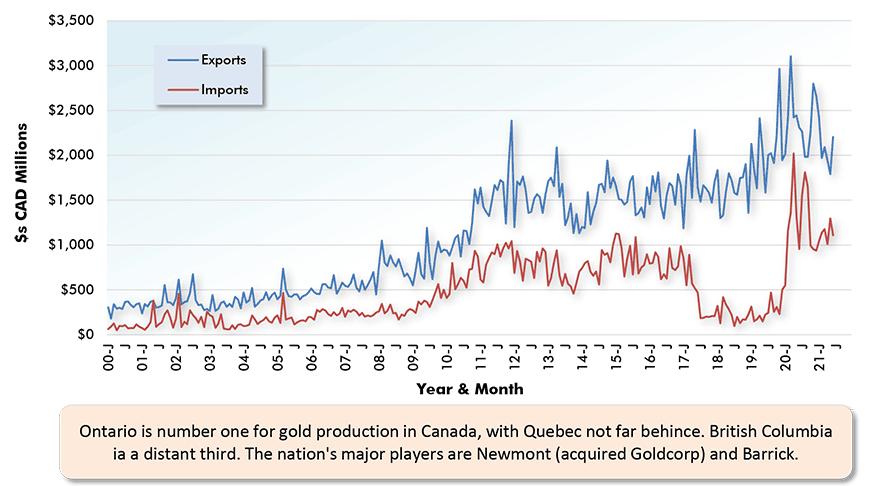
The latest data points are for June 2021.
Data source: Statistics Canada.
Chart: ConstructConnect.
Graph 11: Canada’s Foreign Trade in Potash
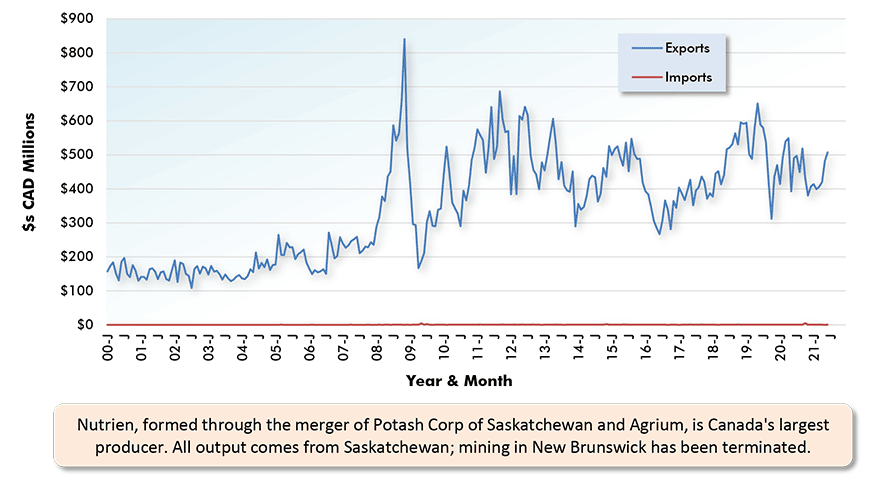
The latest data points are for June 2021.
Data source: Statistics Canada.
Chart: ConstructConnect.
Graph 12: Canada’s Foreign Trade in Aluminum
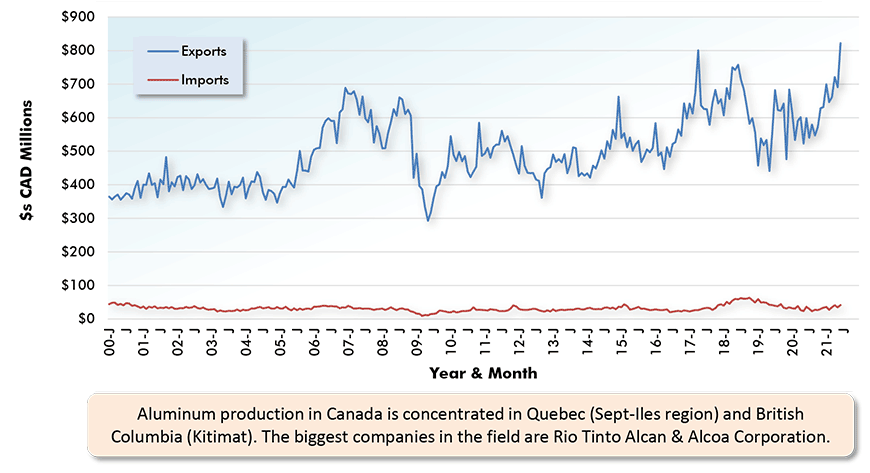
The latest data points are for June 2021.
Data source: Statistics Canada.
Chart: ConstructConnect.
Graph 13: Canada’s Foreign Trade in Lumber & Other Sawmill Products
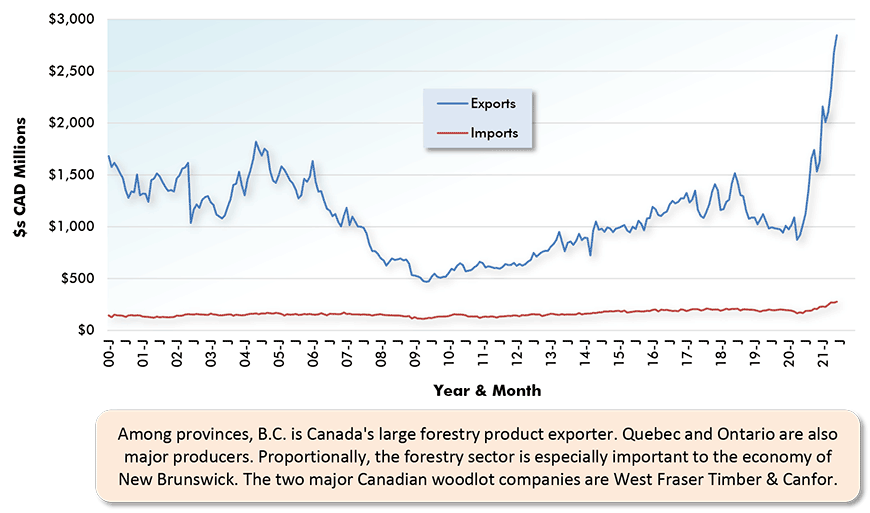
The latest data points are for June 2021.
Data source: Statistics Canada.
Chart: ConstructConnect.
Graph 14: United States’ Foreign Trade: Goods and Services Balance − June 2021
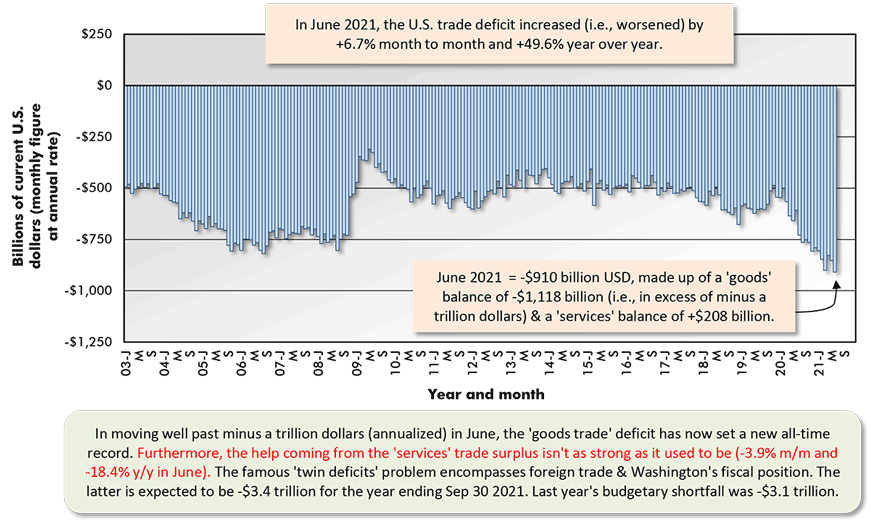
The last data point is for June 2021.
Based on seasonally adjusted monthly figures, projected at an annual rate.
Data source: Bureau of Economic Analysis (BEA).
Chart: ConstructConnect.
Graph 15: Geographic Sources of U.S. Total Foreign Trade Deficit in Goods – June 2021
Data source: U.S. Census Bureau and Bureau of Economic Analysis (BEA).
Chart: ConstructConnect.
Alex Carrick is Chief Economist for ConstructConnect. He has delivered presentations throughout North America on the U.S., Canadian and world construction outlooks. Mr. Carrick has been with the company since 1985. Links to his numerous articles are featured on Twitter @ConstructConnx, which has 50,000 followers.
Please click on the following link to download the PDF version of this article:
Economy at a Glance Vol. 17, Issues 130, 131 and 132 – Canada Achieves Foreign Trade Gains; U.S. Still Sinking – PDF


Recent Comments