
According to Statistics Canada, the Canadian total jobs count climbed by +90,000 in August to sit at just under 19 million. The year-over-year gain in employment has been only slightly under a million jobs (+958,000). Ontario (+419,000 jobs) and British Columbia (+201,000 jobs) have been the two provinces with the best records in nominal jobs creation over the past 12 months.

The Canadian seasonally adjusted (SA) unemployment rate downshifted to 7.1% in August from 7.5% in July and was a marked improvement over August 2020’s 10.2%. The not seasonally adjusted (NSA) unemployment rate, adjusted to the same calculation methodology as is adopted in the U.S., shrank to 5.8% from 6.2% in July and 9.0% in August a year ago. The R-3 U rate (i.e., its official title) was almost a match for the 5.3% NSA U rate rung up in the U.S. in August.
Some notable achievements were realized in Canada’s labour market in the latest month. The ‘total’ jobs recovery ratio in Canada, versus February-to-April’s huge drop last year, has now risen to 94.8%. But in ‘services’, and this is where breaking out the noisemakers is warranted, the jobs claw-back ratio has almost reached completion, 99.4%.
A full recovery (100.8%) in employment has been managed in the youngest worker cohort, those aged 15 to 24. The youth worker brigade saw many job casualties in the Spring of last year when measures to halt coronavirus infections shut down bars and restaurants and placed restrictions on the travel counted on to generate hotel and motel bookings.
Canadian construction employment in August moved ahead by +21,000 jobs. The year-over-year gain in construction payrolls has been +4.5%. The all-jobs increase in employment has been a little better, at +5.3%. And services employment has been another step up at +6.1% y/y.
‘Accommodation and food services’ employment within ‘services’ has been +10.1% y/y. Of course, this largely accounts for the strong jobs recovery rate among young workers.
Construction has performed better on the jobs front than manufacturing. The number of jobs with Canadian manufacturers in August was down by -5,000, leaving the y/y change at an unexciting +2.1%.
Returning to the provinces to wrap up, the lowest unemployment rate in the land in August was Manitoba’s 5.7%. Quebec, at 5.8%, barely missed being in a tie for number one. In third spot was British Columbia, at 6.2%.
Graph 1: Canada: Month-to-month Total Jobs Count Change
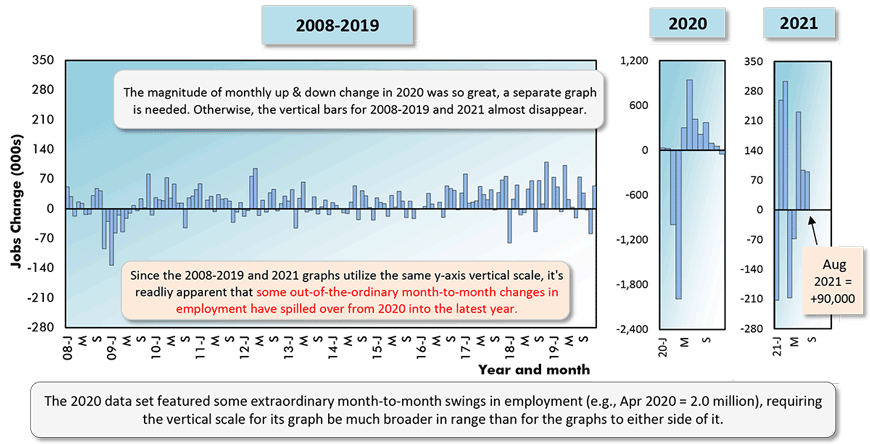
Chart: ConstructConnect.
Table 1: Monitoring the Canadian Employment Recovery ‒ August 2021
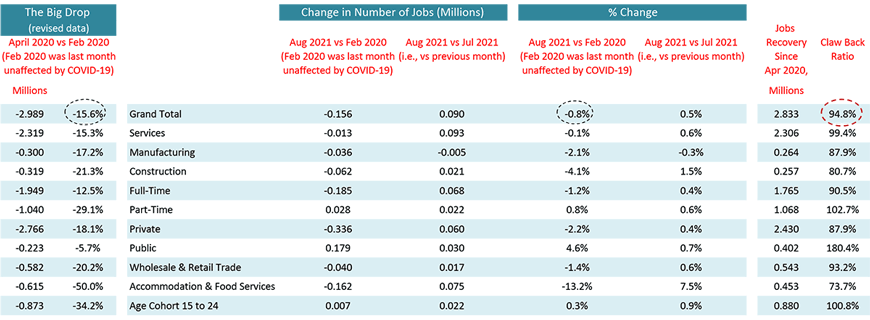
Table: ConstructConnect.
Table 2: U.S. and Canadian Jobs Markets ‒ August 2021
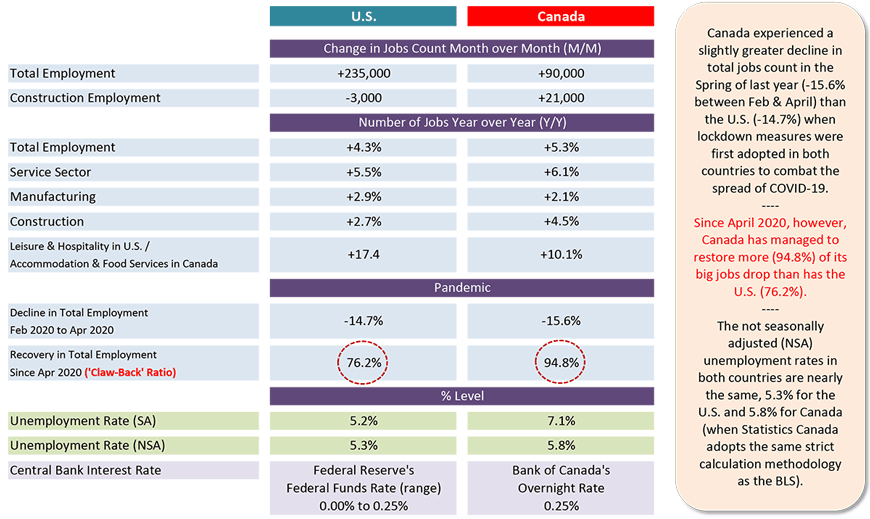
U.S. labor data is from a ‘payroll survey’ / Canadian labour data is from a ‘household survey’.
Cdn NSA unemployment rate known as ‘R3’ is adjusted to U.S. concepts (i.e., it adopts U.S. equivalent methodology).
Table: ConstructConnect.
Graph 2: Manufacturing vs Construction Employment in Canada
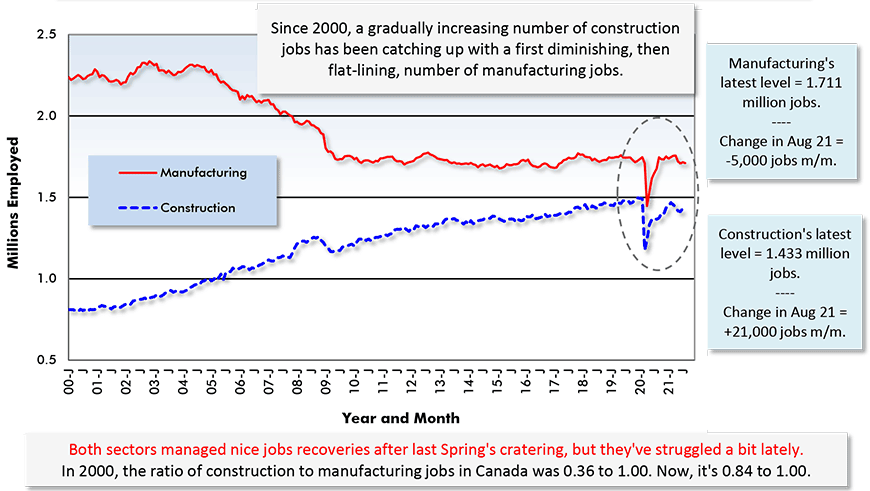
Chart: ConstructConnect.
Alex Carrick is Chief Economist for ConstructConnect. He has delivered presentations throughout North America on the U.S., Canadian and world construction outlooks. Mr. Carrick has been with the company since 1985. Links to his numerous articles are featured on Twitter @ConstructConnx, which has 50,000 followers.
Please click on the following link to download the PDF version of this article:
Economy at a Glance Vol. 17, Issue 136 – Canada Reached Some Labour Market Milestones in August – PDF


Recent Comments