Two of the major themes that will be governing U.S. construction activity as the coronavirus-caused downturn recedes into legend will be ‘electrification’ and ‘de-carbonization’. In most ways, they are two sides of the same coin, with the former seen by many in public governance, with environmental think tanks, and even among the general populace, as the best way to achieve the latter.

Spearheaded by the auto sector’s commitment to greatly expand EV production, a pronounced shift to more electric power usage and near zero-emitting carbon sources, such as wind and solar, will boost demand for nickel in batteries and copper in distribution and transmission lines. Many other resources are also experiencing a rebirth in demand and prices, after lying dormant for the previous dozen years.
With commodity prices moving higher in the background, inflation is threatening to become more entrenched than is desirable. Another likely underlying theme for the economy and construction markets in the years ahead is a framework of rising costs.
Download this article as a PDF.
Some of the shortages along supply lines that are occurring now, and contributing to price increases, are likely to prove temporary (e.g., exorbitant shipping charges for imports from overseas and costly delays for the offloading of cargo at ports). But there are additional inflationary factors waiting in the wings.
Bureau of Labor Statistics figures on year-over-year hourly and weekly wages are climbing at least twice as fast as normal, approaching +5.0%. The massive debt taken on by government to provide business and personal income support in much of 2020 and 2021 will almost certainly lead to tax increases. Nor will interest rates be remaining on the mat forever.
Also, worthy as they are as goals, it would be hard to argue that electrification and de-carbonization won’t be expensive. To be effective, many more homeowners will need to switch to solar paneling, a full range of electric appliances and backup power storage batteries. Heavy industry, including steel, cement and aluminum producers are proceeding with new expenditures on innovative production processes and scrubbing systems to restrain carbon emissions.
Finally, three other trends warrant mention. Currently high-speed residential construction will be handing the baton on to certain recovering segments of nonresidential activity by the mid-point of next year. Working to ensure this transition, especially in the engineering sphere, will be the heightened emphasis put on infrastructure undertakings. And as a final observation, recent events have moved high-rise office and multi-use complexes off center stage in favor of low-rise warehouse and data center structures.
‘Starts’ versus Put-in-place (PIP) Statistics
‘Starts’ compile the total estimated dollar value of all projects on which ground is broken in any given month. By way of contrast, put-in-place capital spending statistics are analogous to work-in-progress payments as the building of structures proceeds to completion.
Consider a $60 million office tower for which ground is broken in June 2021. For the ‘starts’ series, the entire estimated value ($60 million) will be entered in June 2021. In PIP numbers, it will be captured as spending of approximately $15 million in 2021; $25 million in 2022; and the final $20 million in 2023.
Table 1: U.S. Construction Spending (put-in-place investment)
(billions of “current” $s)
| Actuals | Forecasts | |||||||
| Type of Construction: | 2019 | 2020 | 2021 | 2022 | 2023 | 2024 | 2025 | |
| Grand Total | 1391.1 | 1469.2 | 1,565.9 | 1,673.8 | 1,812.0 | 1,913.9 | 1,990.4 | |
| (year vs previous year) | 4.3% | 5.6% | 6.6% | 6.9% | 8.3% | 5.6% | 4.0% | |
| Total Residential | 553.4 | 638.1 | 768.7 | 831.0 | 899.4 | 949.9 | 987.4 | |
| -1.9% | 15.3% | 20.5% | 8.1% | 8.2% | 5.6% | 3.9% | ||
| Total Non-residential | 837.6 | 831.1 | 797.2 | 842.8 | 912.6 | 964.0 | 1003.0 | |
| 8.9% | -0.8% | -4.1% | 5.7% | 8.3% | 5.6% | 4.0% | ||
| Total Commercial/for Lease | 206.5 | 203.3 | 189.1 | 189.4 | 202.5 | 215.2 | 223.9 | |
| 6.2% | -1.6% | -6.9% | 0.1% | 6.9% | 6.3% | 4.0% | ||
| Lodging | 33.5 | 29.1 | 20.6 | 19.1 | 21.7 | 23.9 | 25.7 | |
| 6.3% | -13.2% | -29.2% | -7.2% | 13.8% | 10.1% | 7.3% | ||
| Office | 88.7 | 87.4 | 81.1 | 77.0 | 76.8 | 79.6 | 82.2 | |
| 15.7% | -1.5% | -7.2% | -5.0% | -0.3% | 3.7% | 3.3% | ||
| Commercial (retail/warehouse) | 84.3 | 86.8 | 87.5 | 93.2 | 104.0 | 111.7 | 116.0 | |
| -2.4% | 2.9% | 0.8% | 6.6% | 11.5% | 7.4% | 3.8% | ||
| Total Institutional | 201.4 | 204.5 | 186.7 | 190.6 | 202.8 | 210.6 | 215.6 | |
| 8.5% | 1.5% | -8.7% | 2.1% | 6.4% | 3.9% | 2.4% | ||
| Health Care | 46.3 | 48.1 | 48.4 | 49.4 | 52.9 | 55.5 | 57.0 | |
| 6.5% | 4.0% | 0.7% | 2.0% | 7.1% | 4.9% | 2.7% | ||
| Educational | 109.0 | 107.4 | 97.2 | 97.1 | 103.6 | 106.9 | 108.7 | |
| 7.6% | -1.4% | -9.5% | -0.1% | 6.7% | 3.1% | 1.7% | ||
| Religious | 3.7 | 3.5 | 3.2 | 3.1 | 3.0 | 3.0 | 3.1 | |
| 6.5% | -6.2% | -9.1% | -2.3% | -3.2% | -0.2% | 2.8% | ||
| Public Safety | 12.0 | 17.9 | 12.7 | 13.8 | 15.2 | 15.7 | 15.8 | |
| 28.5% | 48.8% | -29.2% | 9.2% | 10.1% | 3.4% | 0.1% | ||
| Amusement and Recreation | 30.4 | 27.6 | 25.2 | 27.2 | 28.0 | 29.5 | 31.1 | |
| 8.4% | -9.4% | -8.7% | 8.0% | 3.1% | 5.4% | 5.2% | ||
| Total Engineering/Civil | 348.7 | 351.2 | 347.4 | 382.5 | 417.7 | 442.5 | 462.8 | |
| (year vs previous year) | 10.1% | 0.7% | -1.1% | 10.1% | 9.2% | 5.9% | 4.6% | |
| Transportation | 57.5 | 59.7 | 57.6 | 63.2 | 70.9 | 75.9 | 79.0 | |
| 7.9% | 3.9% | -3.5% | 9.7% | 12.3% | 7.0% | 4.1% | ||
| Communication | 22.2 | 22.5 | 21.8 | 22.1 | 23.5 | 25.1 | 26.6 | |
| -9.4% | 1.5% | -3.0% | 1.3% | 6.3% | 6.5% | 6.2% | ||
| Power | 118.0 | 115.0 | 117.2 | 132.7 | 142.5 | 148.8 | 155.6 | |
| 18.5% | -2.5% | 1.8% | 13.2% | 7.4% | 4.4% | 4.6% | ||
| Highway and Street | 99.4 | 99.9 | 96.8 | 102.8 | 110.6 | 118.3 | 124.4 | |
| 8.3% | 0.5% | -3.1% | 6.2% | 7.5% | 6.9% | 5.2% | ||
| Sewage/Waste Disposal & Water Supply | 42.5 | 45.1 | 46.3 | 52.6 | 59.3 | 62.5 | 64.9 | |
| 7.9% | 6.1% | 2.5% | 13.7% | 12.7% | 5.5% | 3.8% | ||
| Conservation and Development | 9.2 | 9.0 | 7.7 | 9.2 | 10.9 | 12.0 | 12.3 | |
| 11.9% | -2.8% | -14.0% | 19.1% | 18.8% | 9.8% | 3.0% | ||
| Total Industrial/Manufacturing | 81.0 | 72.1 | 74.0 | 80.2 | 89.6 | 95.7 | 100.8 | |
| 11.7% | -10.9% | 2.6% | 8.4% | 11.7% | 6.7% | 5.3% | ||
"Current" means not adjusted for inflation.
Source of actuals: U.S. Census Bureau / Forecasts: Oxford Economics and ConstructConnect.
Table: ConstructConnect.
Put-in-place (PIP) Investment
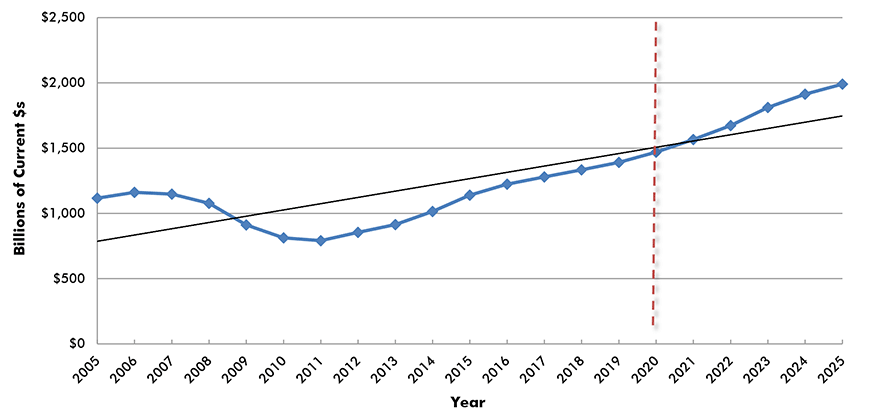
Chart: ConstructConnect.
Residential
Largely due to a strong run-up in prices, the boom in U.S. homebuilding earlier this year has now lost some momentum. Also, an upsurge in renovation activity has been brought short by a huge increase (since reversed) in the price of lumber. Nevertheless, the outlook for residential construction remains above trend line to counterbalance so many years spent underneath it.
Put-in-place (PIP) Investment
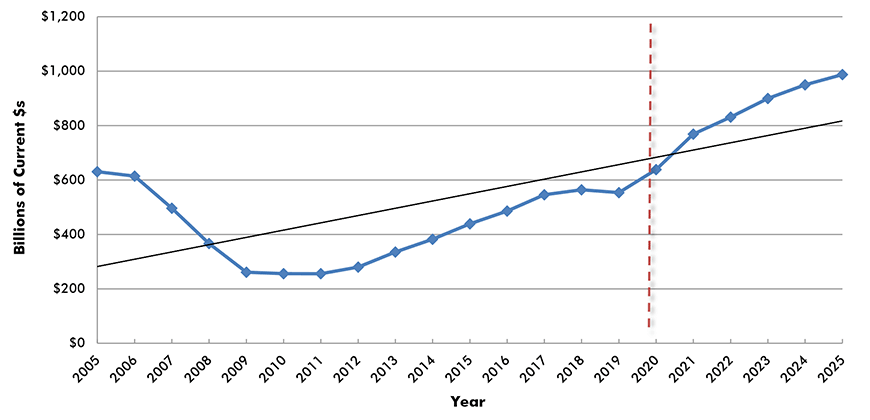
Chart: ConstructConnect.
Lodging
The lodging sector was especially ravaged by the arrival of the coronavirus. Employment and occupancy rates plummeted. Presently, with the economy becoming more fully open again, hotels and motels are on the comeback trail. But the recovery in tourism and trade show business still has a distance to go. New capital spending won’t be a priority for a while.
Put-in-place (PIP) Investment
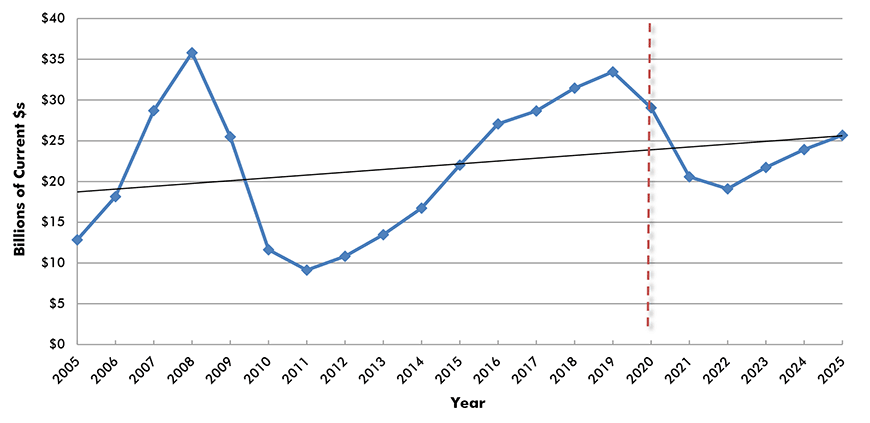
Chart: ConstructConnect.
Office Buildings
Stay at home directives have been devastating the demand for office space over the past 18 months. Many companies and individuals have learned to appreciate the advantages of setting up operations in one’s own residence. Major employers seem split on whether it’s desirable to have workers return to the office full-time. The need for new space remains questionable.
Put-in-place (PIP) Investment
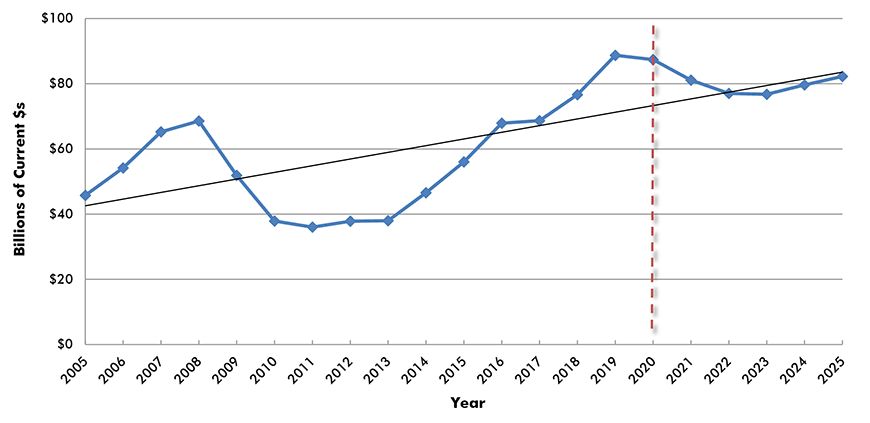
Chart: ConstructConnect.
Retail, Warehouse, Restaurant
The loss in retail construction during the pandemic due to social distancing was about equally made up by the building of ultra-large distribution centers to fulfill the surge in Internet sales. The demand for warehouse space will also be boosted by a shift away from just-in-time inventory management towards keeping more key component supplies closer to hand.
Put-in-place (PIP) Investment
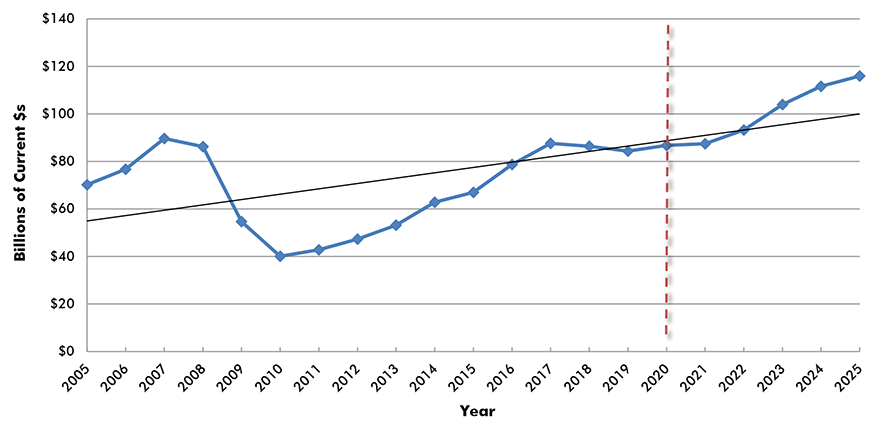
Chart: ConstructConnect.
Health Care
For the past year and a half, health care has been totally committed to helping patients survive the coronavirus outbreak. Soon, it will begin re-aligning to prioritize the needs of an aging population, as the graying of ‘baby boomers’ continues. The nursing home sector will benefit from design changes to accommodate improvements such as better isolation wards.
Put-in-place (PIP) Investment
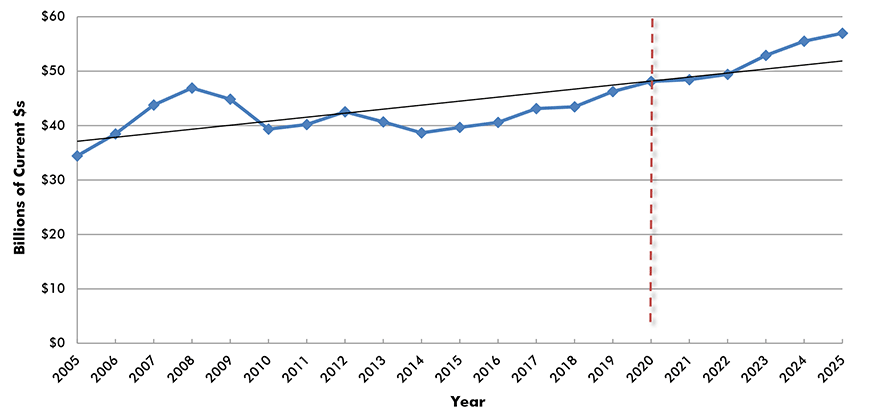
Chart: ConstructConnect.
Educational
Educational construction is facing changes tied to demographics. The births that feed into attendance at elementary schools are way down. Nor is immigration what it once was, cutting down on the arrivals of families with young children. In higher education, enrolments have suffered from a shift to online instruction and fewer foreign students.
Put-in-place (PIP) Investment
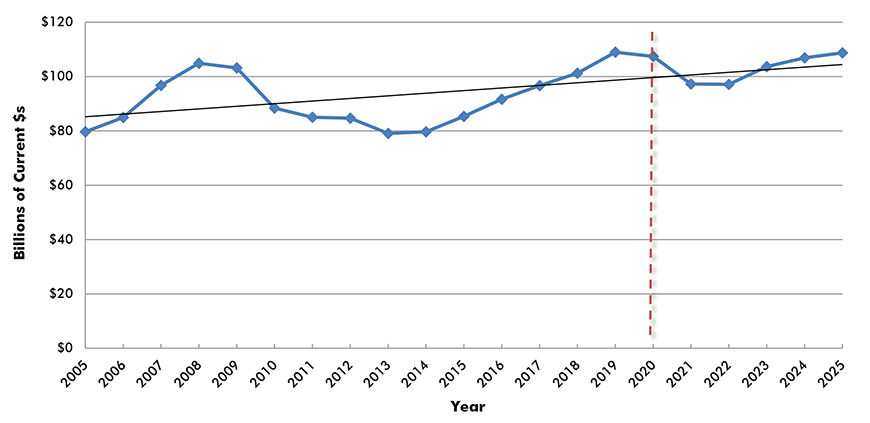
Chart: ConstructConnect.
Amusement and Recreation
For theater goers, cinephiles, sports fans and casino aficionados the past year and a half has been a period of denial like none other. The appetite for returning to pleasurable outings, once the coronavirus has been thoroughly kicked to the curb, is immense. A side effect of inactivity has been a surge in savings. The spending power exists to fuel a next wave of capital spending.
Put-in-place (PIP) Investment
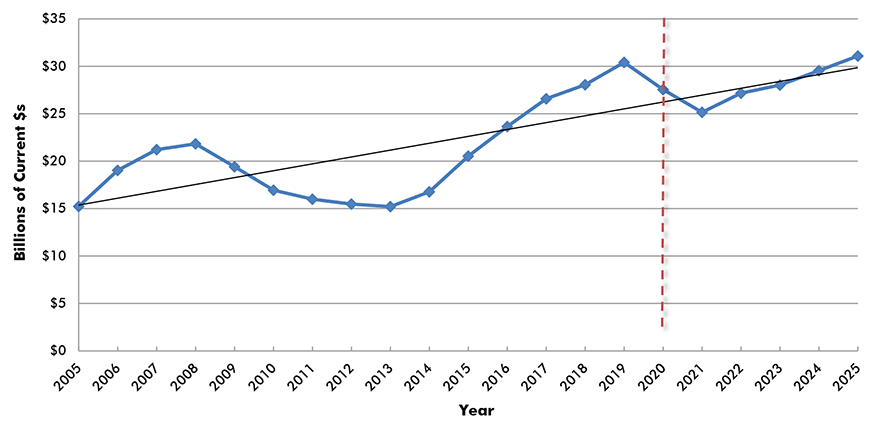
Chart: ConstructConnect.
Transportation
Decisions concerning new transportation projects should take direction from the new working arrangements and lifestyle choices being adopted. Less commuting and less domestic and foreign travel may somewhat mute the outlook for rapid transit and airport projects, but longer-term projections of capacity constraints will spark go-aheads for many such projects, nonetheless.
Put-in-place (PIP) Investment
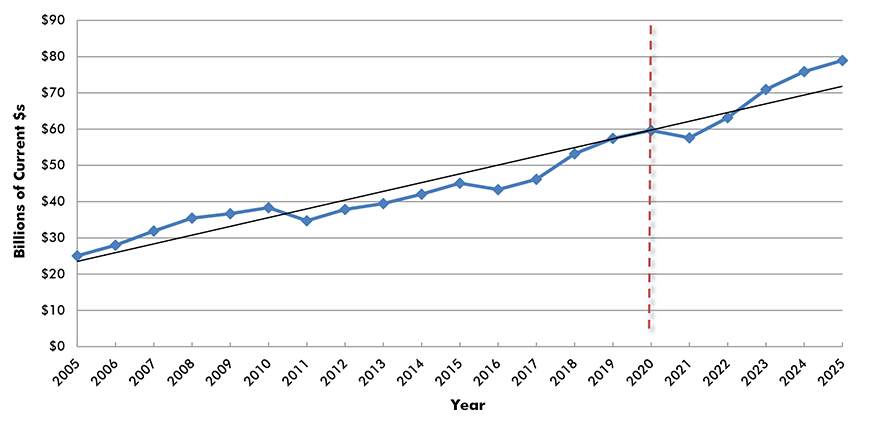
Chart: ConstructConnect.
Power
Booting aside carbon emissions in electric power generation is a top goal of the Biden Administration. The Clean Energy Performance Program (CEPP) proposes incentives for utilities when they increase their ‘green’ output component; and penalties when they fail to do so. Rippling outwards from the auto sector, economies everywhere are embracing electrification.
Put-in-place (PIP) Investment
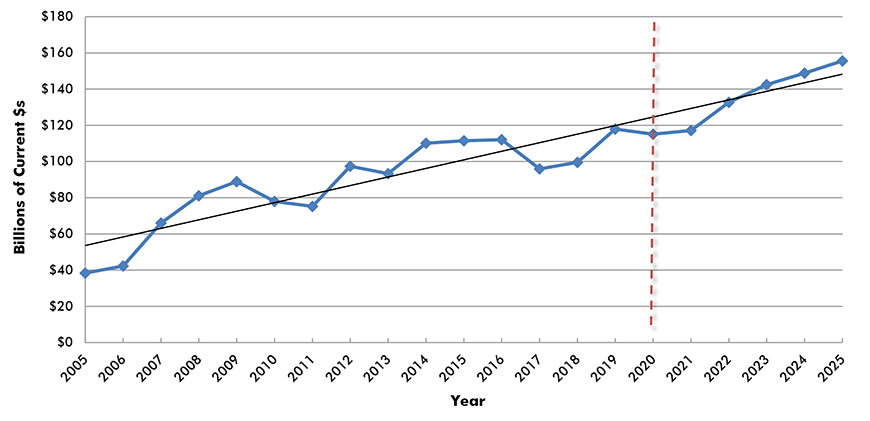
Chart: ConstructConnect.
Highways and Streets
More roadway construction, to serve new residential communities and to provide logistical support in the faster movement of goods to markets, will feature in upcoming more aggressive infrastructure spending plans. Specialty contractors will be forming alliances with GCs to provide the traffic monitoring systems to facilitate the shift to autonomous vehicles.
Put-in-place (PIP) Investment
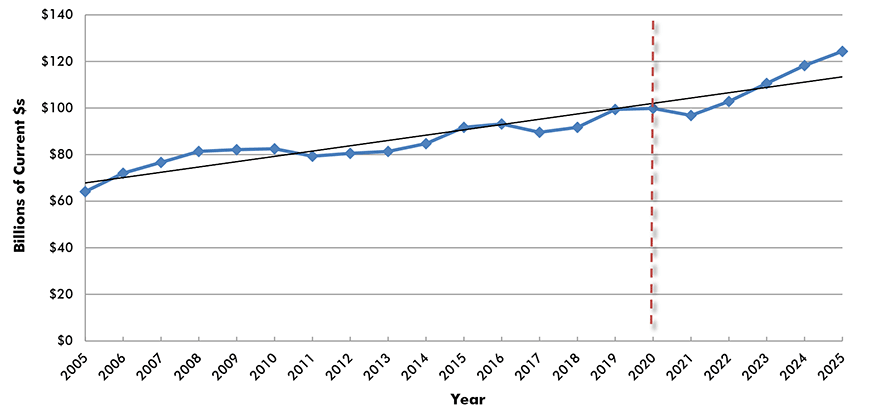
Chart: ConstructConnect.
Water Supply; Sewage and Waste Disposal
Water and waste system investments will be dictated by repair and maintenance requirements, the building of new residential communities and efforts to mitigate the harmful effects from climate change. The imperative moving forward will be the need for ‘resilient’ infrastructure to aid in the restoration of key physical assets after extensive storm or wildfire damage.
Put-in-place (PIP) Investment
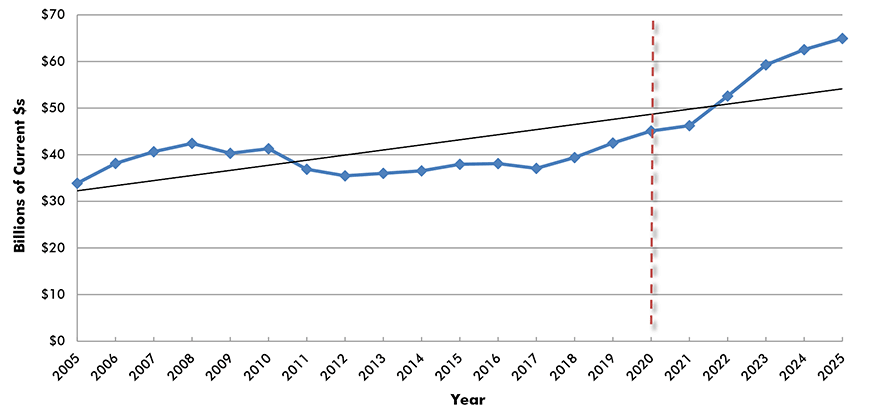
Chart: ConstructConnect.
Manufacturing
The current exposure of component shortages up and down supply chains (e.g., computer chips) and an experimental move towards de-globalization will spur investments in domestic manufacturing. Also, fertilizer and LNG producers will be mulling the opportunities from natural gas that is currently priced four times higher in Europe than in North America.
Put-in-place (PIP) Investment
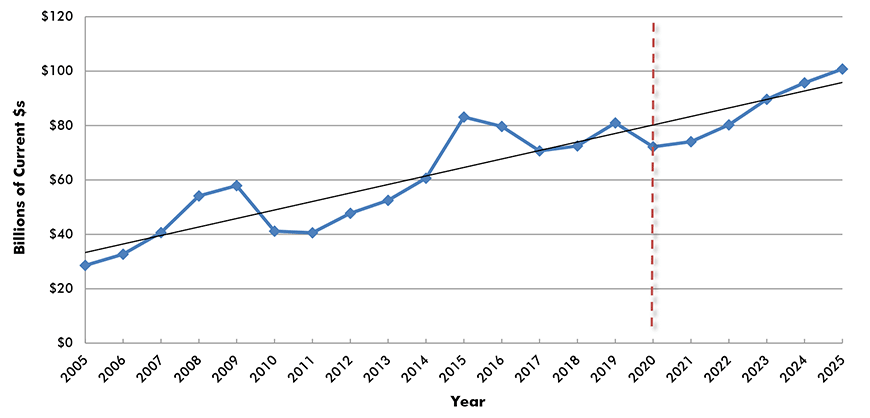
Chart: ConstructConnect.
Alex Carrick is Chief Economist for ConstructConnect. He has delivered presentations throughout North America on the U.S., Canadian and world construction outlooks. Mr. Carrick has been with the company since 1985. Links to his numerous articles are featured on Twitter @ConstructConnx, which has 50,000 followers.


Recent Comments