The latest (July 2021) U.S. put-in-place construction spending numbers from the Census Bureau are shown in Table 1 below. Year to date, the grand total is +6.2% (from the not seasonally adjusted/NSA column), but the decent-sized increase is only because of the extraordinary performance of residential capital spending, +25.3%. Nonresidential lingers in the doldrums, -7.5%.

The residential strength derives from two factors. More people working from home during the pandemic has led to an upsurge in renovation activity. (Graph 1 shows the buoyancy of retail sales by building material suppliers.) And housing starts are engaged in a mine-boom, ahead by one-fifth (in units) so far this year versus Jan-Jul 2020.
Among the 16 nonresidential sub-categories, only one has managed an increase in PIP construction spending so far this year, ‘sewage disposal’ at +2.5%.
The most stunning drops among nonresidential sub-categories so far in 2021 have occurred in lodging, -30.3%; public safety, -31.1%; and conservation, -18.9%.
The largest shares (more than 5% each) of total nonresidential work, however, are usually to be found among other sub-categories including office, commercial (which is mainly retail and warehouses), health care, educational, transportation, power and highways/streets.
Among those seven sub-categories, the most severe negative percentage changes year to date have been racked up by offices, -11.0%; educational, -10.9%; transportation, -6.0%; and highways and streets, -5.3%.
The horizontal lines in Table 1 separate the sub-categories in another handy way. From ‘lodging’ to ‘commercial’ is often simply called commercial construction. From ‘health care’ to ‘amuse and recreation’ is known as institutional. From ‘transportation’ to ‘conservation’ is engineering; and ‘manufacturing’ is industrial.
The year-to-date percentage changes for commercial, institutional, engineering and industrial have been -10.6%, -10.8%, -4.8% and -1.5% respectively.
By the way, the year-to-date pattern of construction capital spending numbers in Canada has been similar to the U.S., with residential strong (thanks to housing starts, in units, north of the border being ahead by two-fifths ytd) and nonresidential hanging back. According to Statistics Canada, the former is +46.9% and the latter, -5.2%. Monthly data on Canadian engineering construction, from which year-to-date figures would be calculated, is not readily available.
The month-to-month U.S. PIP numbers, though, do offer encouragement. Of the 16 nonresidential sub-categories, there are more increases of +0.2% or more than decreases, seven to three. (I’m considering a change of plus or minus 0.1% to be the equivalent of ‘flat’.)
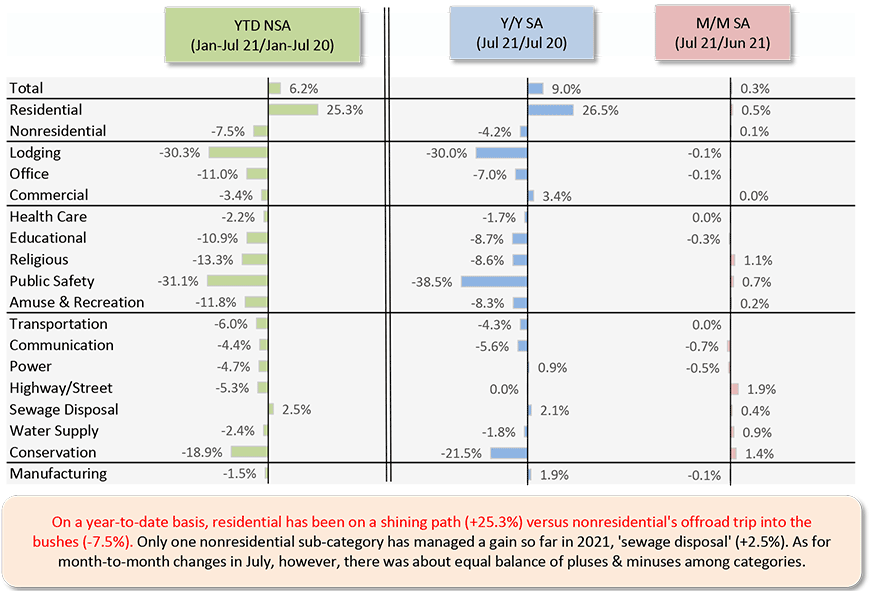
Chart: ConstructConnect.
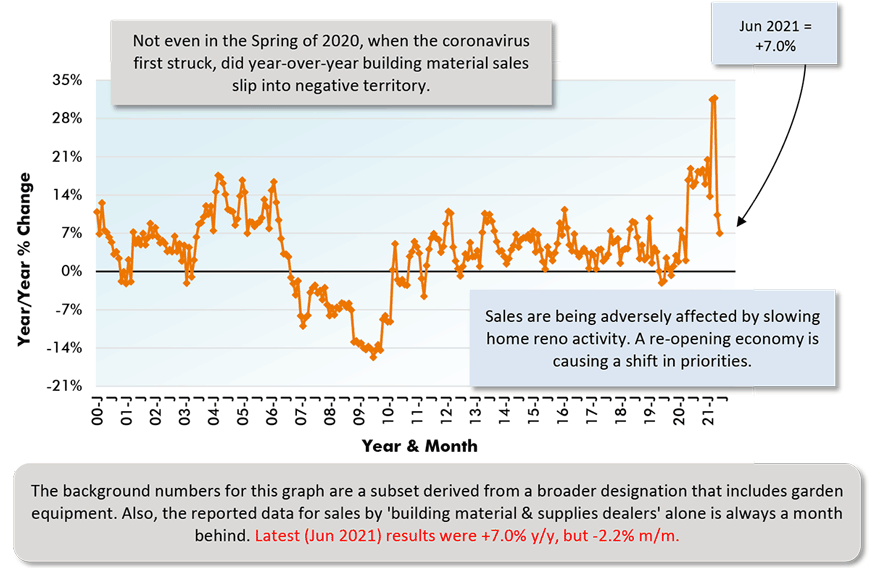
Chart: ConstructConnect.
Alex Carrick is Chief Economist for ConstructConnect. He has delivered presentations throughout North America on the U.S., Canadian and world construction outlooks. Mr. Carrick has been with the company since 1985. Links to his numerous articles are featured on Twitter @ConstructConnx, which has 50,000 followers.
Please click on the following link to download the PDF version of this article:
Economy at a Glance Vol. 17, Issue 129 – U.S. Put-in-place Construction Spending Picking Up M/M – PDF


Recent Comments