
The U.S. total jobs increase in October was +531,000 according to the latest Employment Situation report from the Bureau of Labor Statistics. A gain of more than half a million would have been met with cheering in any month prior to the pandemic. And it’s better than September’s +312,000 and August’s +483,000. But it still leaves total employment in the U.S. significantly below where it was in February 2020, just before COVID-19 touched down.

The total number of U.S. jobs at present is 148.3 million. Twenty months ago, in February 2020, the total number of jobs in the nation was 152.5 million. The difference is a remaining shortfall of -4.2 million positions.
The all-jobs claw-back ratio (i.e., the number-of-jobs rebound since April 2020 compared with the big number-of-jobs drop from February to April 2020) is now 81.2%. The jobs recovery ratio in the services sector is better at 84.9%.
Construction’s jobs claw-back ratio is 86.5%; manufacturing’s is 80.5%.
In October, the construction sector managed its best net jobs-creation month (+44,000) since March of this year (+93,000). The pattern of employment in construction in 2021 has been varied, with half the months through October recording increases and the other half registering declines.
The +44,000 pickup in construction jobs came mainly at the specialty trades level (+28,000 jobs). Subtrade contractors in nonresidential work were especially active in hiring, +19,000 jobs.
What’s known as the ‘headline’ unemployment rate (i.e., the seasonally adjusted national figure) tightened to 4.6% in October from 4.8% in September. A year ago, it had been 6.9%.
The not seasonally adjusted unemployment rate in the latest month was 4.3%, down from 4.6% the month prior and well below the 6.6% level of October 2020.
A Jobs Mystery To Be Sorted Out
There’s a bit of a mystery to be sorted out. History has shown that the NSA unemployment rate won’t likely decline much further. Its lower bound seems to be just above 3.0%. But there are still four million jobs to go before the economy reaches the height of employment achieved in early 2020.
Several explanations seem possible. Many individuals are sitting on the sidelines reassessing what they would like their careers to be, as opposed to what they’ve found themselves engaged in up to this point.
After ‘investing’ more than a year-and-a-half in social distancing, to stay safe healthwise, some people, even with the protection of vaccinations, are still uncomfortable with the notion of going elbow-to-elbow, or nose-to-nose, with the broader population.
Also, there’s been a trend for many individuals who’ve had to fend for themselves at home for a while to become creative in imagining the smaller business ventures they might launch to bring in income. Possibly the BLS has not yet become adept at capturing the extent of these endeavors.
Initial Jobless Claims Nearly Fully Healed
Recent week-to-week movements in initial jobless claims have been signaling an end to the soft spot in hiring. Graph 1 shows the number of first-time unemployment insurance seekers descending emphatically below 300,000.
In 2019, when the labor market was judged to be at full employment, there were several weeks when the initial jobless claims number tested and bested 200,000. The latest level, for the week ending October 30, 2021, was 269,000.
Earnings Bullish
Year-over-year wage hikes for all workers, including bosses, in October 2021 were +4.9% hourly and +4.6% weekly. Construction workers were compensated close to the norm, +4.7% hourly and +4.2% weekly.
For all jobs, but excluding supervisory personnel, October’s y/y earnings increases were +5.8% hourly and +5.4% weekly. Again, construction workers were close to the mark, +5.2% hourly and +5.8% weekly.
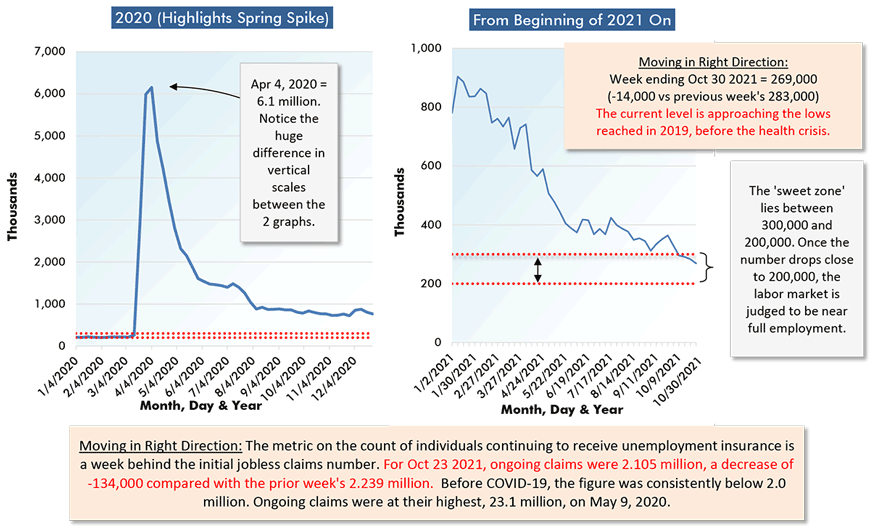
Chart: ConstructConnect.
Graph 2: U.S.: Month-to-month Total Jobs Count Change
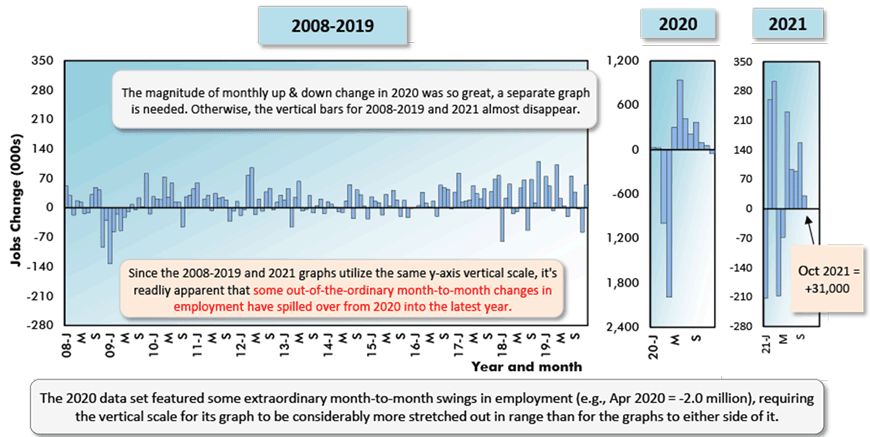
Chart: ConstructConnect.
Table 1: Monitoring the U.S. Employment Recovery – October 2021
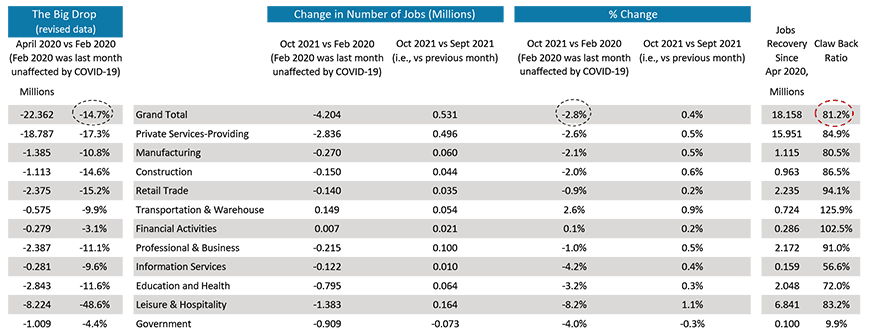
Chart: ConstructConnect.
Graph 3: Change in Level of U.S. Construction Employment, Month to Month (M/M) −
Total & by Categories – October 2021
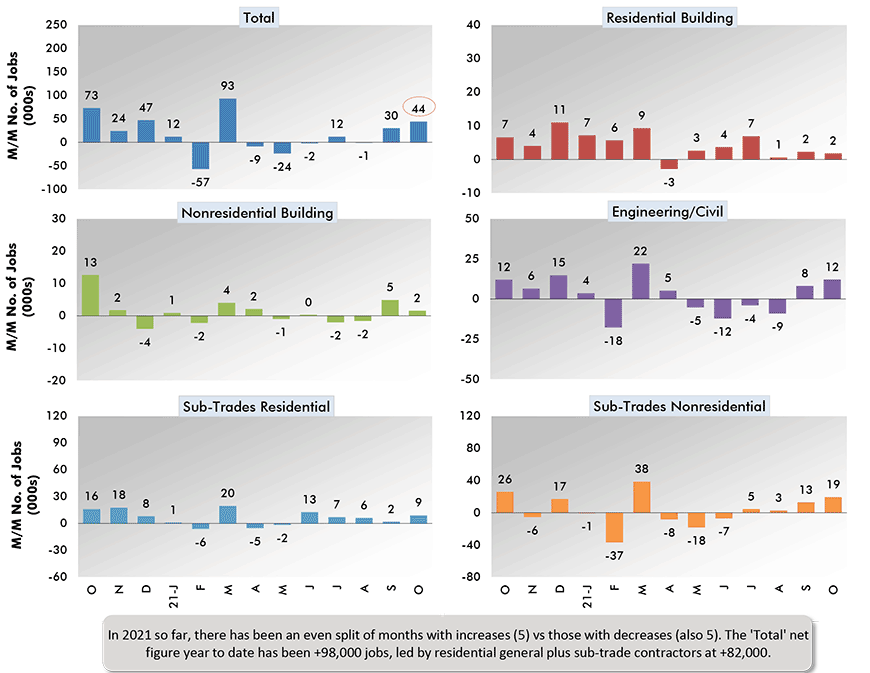
Chart: ConstructConnect.
Graph 4: U.S. Manufacturing vs Construction Employment –
October 2021 – Seasonally Adjusted (SA) Payroll Data
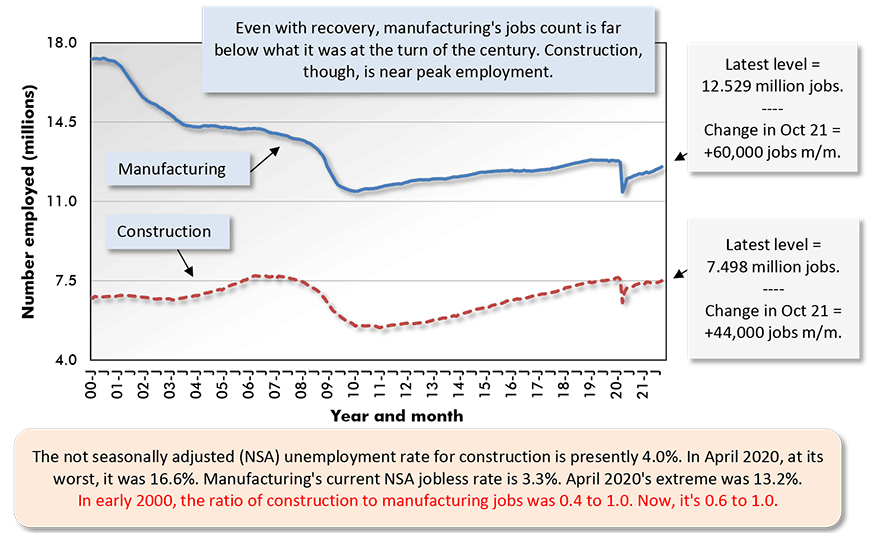
Chart: ConstructConnect.
Chart: ConstructConnect.
Canada’s October Employment +31,000
Canada’s total employment picture brightened to the tune of +31,000 jobs in October. Neither construction (+4,000) nor manufacturing (-8,000 jobs), however, played significant roles in the advance. The big bump came in ‘wholesale and retail trade’, +81,000 jobs.
Relatively speaking (i.e., the population of the U.S. is 9x greater), Canada may not have had as good a month for hiring as the U.S. in October, but it can rest on its jobs claw-back laurels. Canadian total employment at 19.2 million jobs is now higher than ever before. It has moved past February 2020’s previous peak level of 19.1 million.
All the jobs lost in the Spring of 2020 have been recovered, and then some. The mix has altered somewhat, though, with the public sector assuming more of the employment responsibility.
Canada’s SA unemployment rate in the latest month was 6.7%, down from 6.9% in September and a nice adjustment from October 2020’s 9.0%.
But the more dramatic number on unemployment is to be found in the NSA R-3 measure, which calculates Canadian unemployment using the same strict methodology (i.e., as to who is actively looking for work) as is adopted in the U.S. The R-3 U rate in Canada is presently only 4.8%, not much different from America’s 4.3%.
Regionally, Manitoba is the province with the lowest SA unemployment rate, 5.3%. Tied for second ‘stingiest’ are British Columbia and Quebec, both at 5.6%.
Finally, Canada may have added 31,000 jobs in October, but that was mainly due to net staffing in Ontario rising by +37,000 jobs.
Graph 6: Canada: Month-to-month Total Employment Change
Chart: ConstructConnect.
Table 2: Monitoring the Canadian Employment Recovery ‒ October 2021
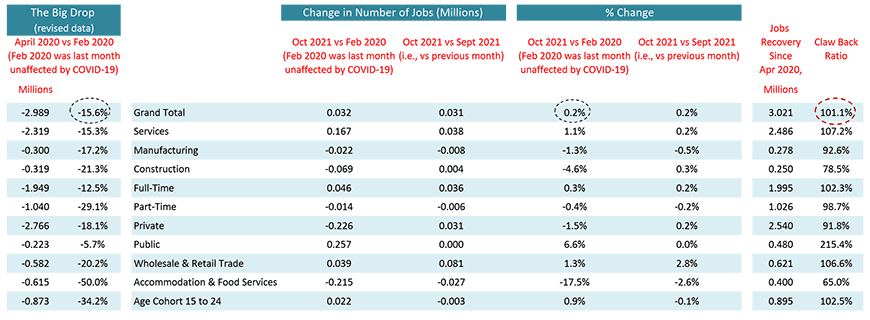
Table: ConstructConnect.
Alex Carrick is Chief Economist for ConstructConnect. He has delivered presentations throughout North America on the U.S., Canadian and world construction outlooks. Mr. Carrick has been with the company since 1985. Links to his numerous articles are featured on Twitter @ConstructConnx, which has 50,000 followers.


Recent Comments
comments for this post are closed