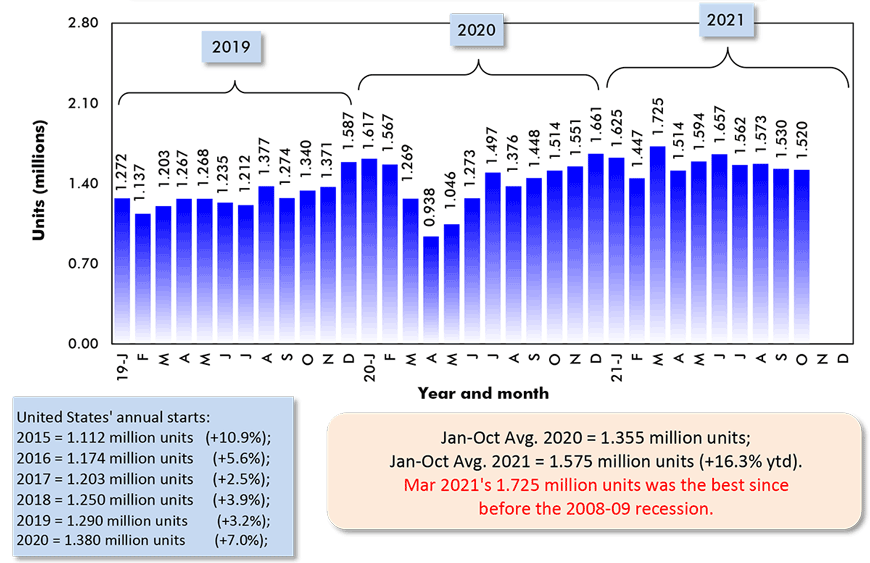
The vertical bars in Graph 1 tell the story of housing starts in the U.S. The monthly numbers of actual groundbreakings in units are seasonally adjusted at an annual rate (SAAR). ‘Annualized’ means they are projected from a single month to 12 months.
Graph 1 for the U.S. homebuilding market shows that beginning in April of last year, starts kept climbing in almost every subsequent period out to the end of 2020.
In 2021, however, the height of the vertical bars has stayed about the same. Only March’s 1.725 million units (SAAR) makes much of an impression. The levels in the other nine months of this year have ranged between 1.45 million and 1.65 million units. U.S. housing starts in 2021 have remained elevated but the growth momentum has dissipated.
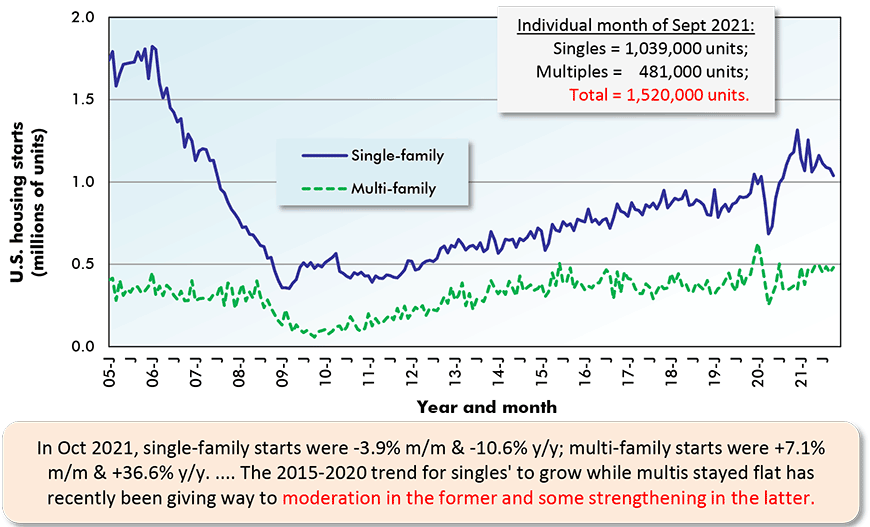
Graph 2 makes clear that it’s the single-family market in the U.S. that has gone into a skid. From 2015 through the end of 2020 (and disregarding the coronavirus-related slump in the Spring of 2020), starts of ‘singles’ were on a strong upward trajectory. In 2021, they’ve mainly been on a downward slide, although in jagged fashion.
One handy way to look at starts is to compare January-to-October monthly averages (based on SAAR figures) for 2021 versus January-to-October 2020 results. On such a basis, the ‘total’ this year has been +16.3%, with singles at +16.8% and multiples, +15.0%. By regions, it’s been the Northeast at +29.0%, followed by the West, +18.8%; South, +14.6%; and Midwest, +10.8%.
2020 Compared with Long-term
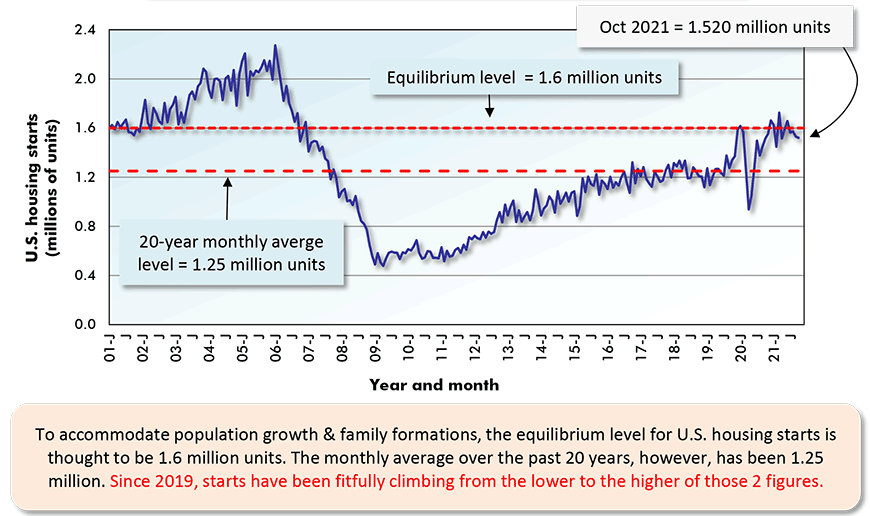
But a ‘bigger picture’ is revealed when 2021 results are compared with annual averages for the whole 21 preceding years of this century (i.e., 2000 to 2020 inclusive).
The monthly average of annualized total housing starts in 2021 so far is +24% compared with the annual average for 2000 to 2020. Single-family starts are +16% compared with their long-term average. Multi-family starts are much better at +48%.
The apartment and condominium portion of the marketplace has been expanding faster than the detached, semi-detached and townhouse portion, but it still holds only a relatively small share of total unit starts, at 30%. (Townhouses are considered ‘singles’ as long as blocks of units don’t have shared HVAC systems.)
Regionally, starts in the Northeast this year may be up the most compared with last year, +29.0%, but when held up against their long-term annual average, they are just +13%.
But that’s better than starts in the Midwest, which are a little worse than flat (-2%) when compared with their 2000-to-2020 annual average.
Population shifts in the country over recent decades have favored the South and the West Regions and that’s where housing starts have been showing the most strength.
Compared with its long-term (2000 to 2020) annual average, the West is currently +27% in housing starts.
Best of all, though, is the South, ahead by one-third (+34%).
Graph 1: U.S. Total Monthly Housing Starts
Seasonally Adjusted at Annual Rates (SAAR)
The last data points are for October 2021.
Data source: U.S. Census Bureau (Department of Commerce).
Chart: ConstructConnect.
Graph 2: U.S. Single-Family & Multi-Family Monthly Housing Starts
Seasonally Adjusted at Annual Rates (SAAR)
The last data points are for October 2021.
Data source: U.S. Census Bureau (Department of Commerce).
Chart: ConstructConnect.
Graph 3: U.S. Total Monthly Housing Starts
Seasonally Adjusted at Annual Rates (SAAR)
The last data point is for October 2021.
Data source: U.S. Census Bureau (Department of Commerce).
Chart: ConstructConnect.
Graph 4: U.S. Monthly Residential Building Permits
Seasonally Adjusted at Annual Rates (SAAR)
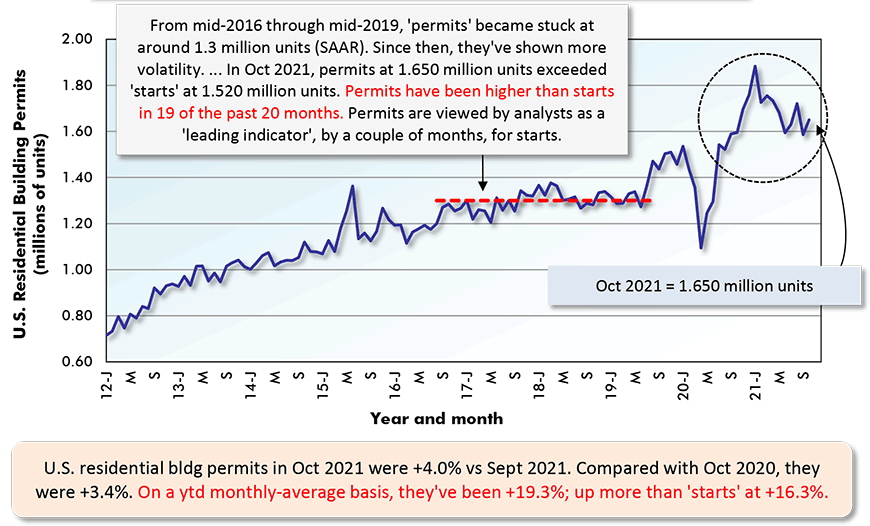
The last data point is for October 2021.
Data source: U.S. Census Bureau (Department of Commerce).
Chart: ConstructConnect.
Graph 5: U.S. Housing Starts
Jan-Oct 2021 vs Jan-Oct 2020 % Changes
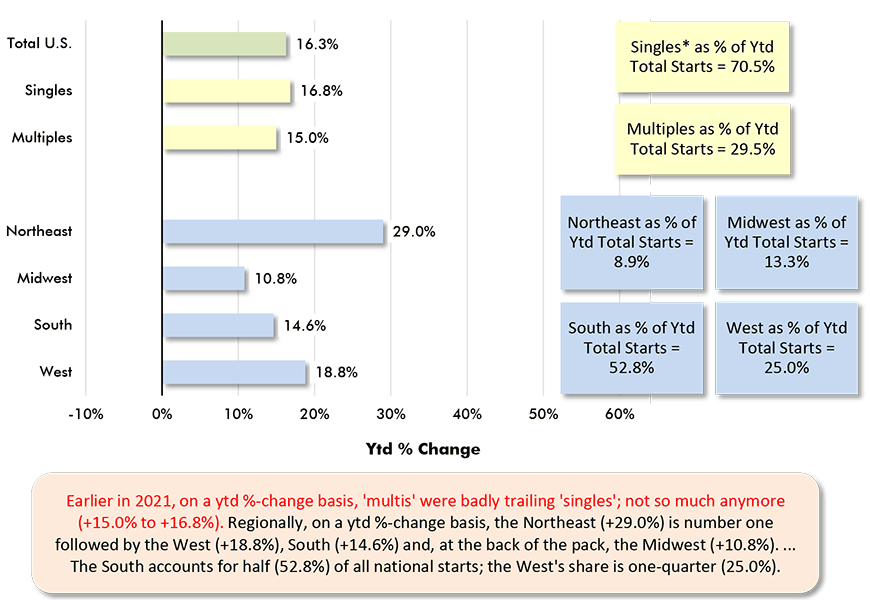
Based on averages of monthly seasonally adjusted and annualized (SAAR) unit starts.
* ‘Singles’ includes townhouse complexes, except when multiple units have common heating & air conditioning.
Data source: U.S. Census Bureau.
Chart: ConstructConnect.
Graph 6: Year to Date Residential Permits Issued (Units) in the 36 Most Populous U.S. Metro Statistical Areas (MSAs)
(Jan-Oct 2021)
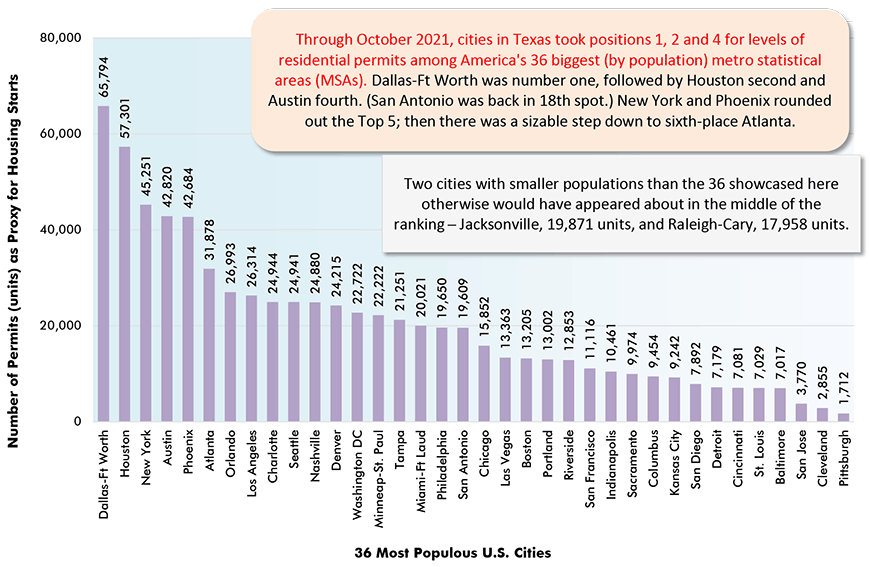
At the city level, the number of residential building permits issued serves as a proxy for housing starts.
Data source: U.S. Census Bureau.
Chart: ConstructConnect.
Graph 7: Percent Change in Year-to-Date Housing Permits Issued (Units) in the 36 Most Populous U.S. Metro Statistical Areas (MSAs)
(Jan-Oct 2021 vs Jan-Oct 2020)
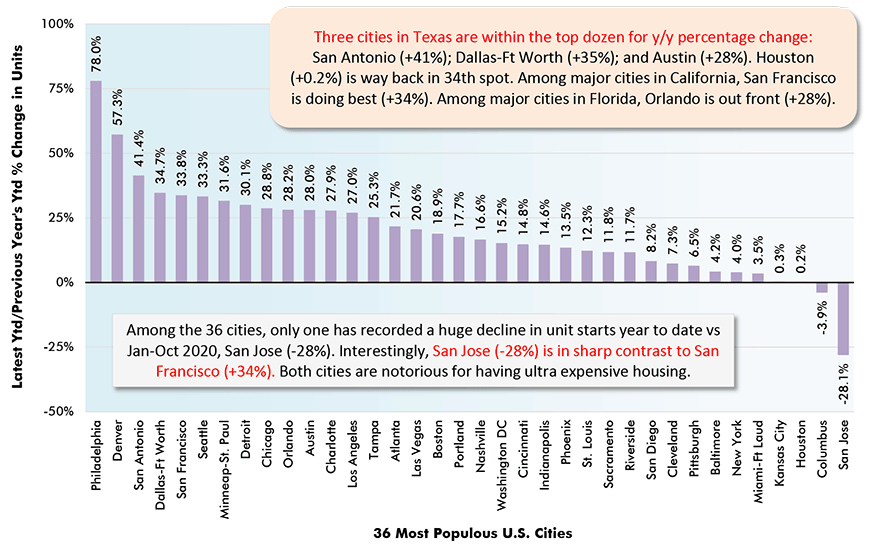
At the city level, the number of residential building permits issued serves as a proxy for housing starts.
Data source: U.S. Census Bureau.
Chart: ConstructConnect.
Canadians Obsess on Residential Real Estate
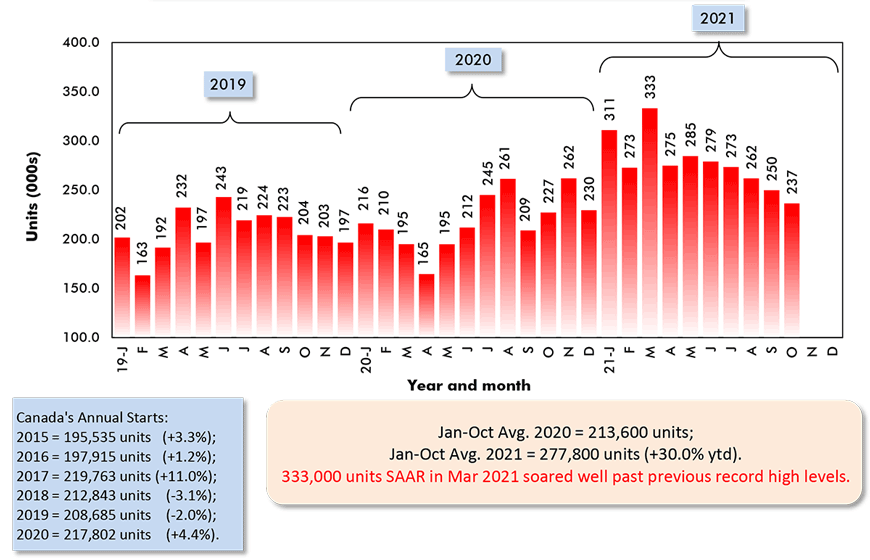
The vertical bars in Graph 8, for Canadian monthly housing starts (SAAR), appear as descending steps since May of this year. March ascended to an all-time high, 333,000 units (SAAR), but the afterglow has been seeping away.
With only two months still to go in 2021, Canadian housing starts will almost certainly end the year up by at least one-quarter compared with 2020 and by about one-third compared with their long-term average over the past 21 years (i.e., from 2000 to 2020 inclusive).
The long-term annual average for Canadian housing starts has been about 200,000 units, whether measured over the past decade, the prior decade, or both decades combined since the turn of the century. This is just another way of saying Canadian housing starts have stayed remarkably consistent, around 200,000 units per year, for a long time.
Graph 13 shows that only when the economy was being lashed most severely during the global financial crisis in 2019, and most recently during a year and a half of pandemic, have there been significant departures from the 200,000-unit level (SAAR) for Canadian housing starts.
Graph 13 also points out an astonishing fact. On a population adjusted basis, Canadian housing starts have exceeded U.S. new home groundbreakings in every single month over the past 16 years, dating back to January 2006. (The U.S. has nine times the population of Canada.)
U.S. stock markets since the 2008-2009 recession have performed much better than Canada’s major trading post, the Toronto Stock Exchange. As of ‘closing’ in October 2021, NASDAQ was +1,025% versus July 2009; the TSX was +159%.
America, hosting many of the world’s largest corporations and especially blessed with the head offices of high-tech leaders, has reveled in the enthusiastic equity participation of its citizens.
Canadians have been inclined to go in a different direction, counting more on home price appreciation than share purchases for wealth generation. At least, talking about startling instances of home price hikes has become a major pre-occupation of Canadians.
There’s another factor that’s traditionally provided more support for homebuilding north of the border. Among industrial nations, Canada has been the pacesetter in population growth, leading to a circular argument. Being home to more people means needing more homes.
Graph 8: Canada Monthly Housing Starts
Seasonally Adjusted at Annual Rates (SAAR)
Data source: Canada Mortgage and Housing Corporation (CMHC).
Chart: ConstructConnect.
Graph 9: Percent Change in Year-To-Date Housing Starts –
Ranking Of Canada’s Provinces
(Jan-Oct 2021 vs Jan-Oct 2020)
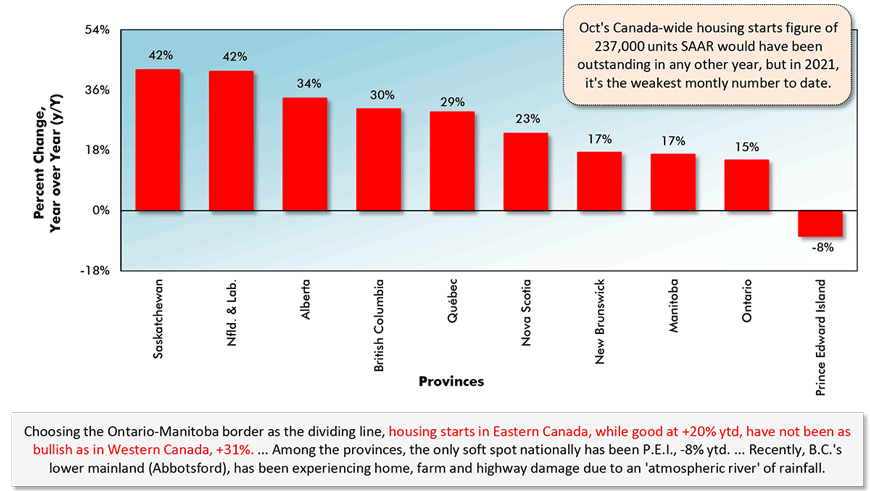
Data source: Canada Mortgage & Housing Corporation (CMHC) based on actuals rather than seasonally adjusted data.
Chart: ConstructConnect.
Graph 10: Percent Change in Year-To-Date Housing Starts –
Ranking Of Canada’s Major Cities
(Jan-Oct 2021 vs Jan-Oct 2020)
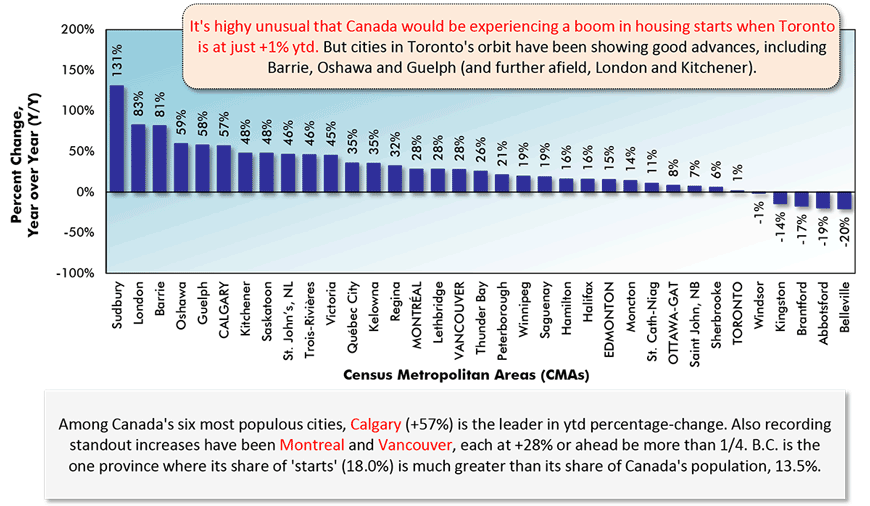
Canada’s Census Metropolitan Areas (CMAs) have core populations of 50,000 plus.
Canada’s 6 CMAs with populations in excess of 1 million are in capital letters.
Data source: Canada Mortgage & Housing Corporation (CMHC) based on actuals rather than seasonally adjusted data.
Chart: ConstructConnect.
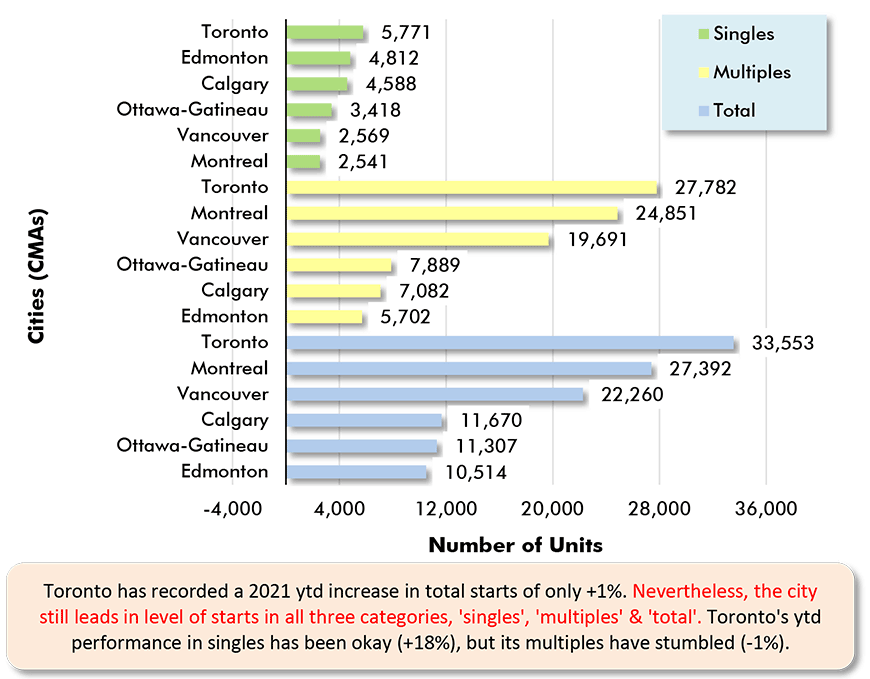
Graph 11: Housing Starts in Canada’s 6 Most Populous Cities
January to October 2021 Actuals
Data source: Canada Mortgage & Housing Corporation (CMHC).
Chart: ConstructConnect.
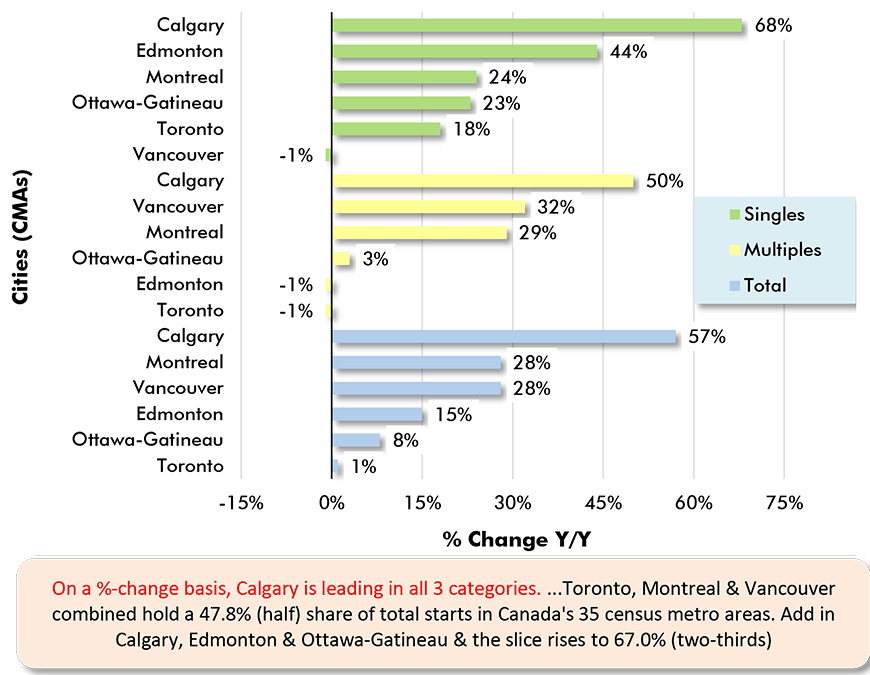
Graph 12: Housing Starts in Canada’s 6 Most Populous Cities
Jan-Oct 2021 vs Jan-Oct 2020
Data source: Canada Mortgage & Housing Corporation (CMHC).
Chart: ConstructConnect.
Graph 13: U.S. and Canada Monthly Housing Starts
Seasonally Adjusted at Annual Rates (SAAR)
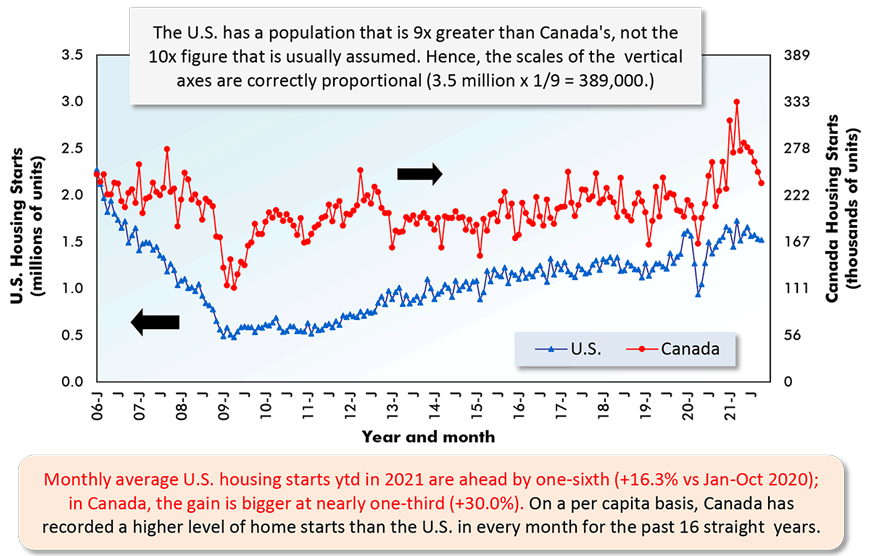
The last data points are for October 2021.
ARROWS: U.S. numbers to be read from left axis; Canadian from right axis.
Data sources: U.S. Census Bureau & Canada Mortgage and Housing Corp (CMHC).
Chart: ConstructConnect.
Alex Carrick is Chief Economist for ConstructConnect. He has delivered presentations throughout North America on the U.S., Canadian and world construction outlooks. Mr. Carrick has been with the company since 1985. Links to his numerous articles are featured on Twitter @ConstructConnx, which has 50,000 followers.






Recent Comments
comments for this post are closed