The $1.2 trillion infrastructure bill, even though the dollars going towards tangible projects will be slightly less than half that amount (approximately $500 billion), and the spending will be spread out over five years, is no small matter.
Current annual spending on what might be termed ‘hard’ infrastructure (i.e., mainly engineering works such as roads, bridges, transit systems, sewers, watermains, treatment plants, communication systems and power) will be about $350 billion.
Adding in ‘soft’ infrastructure (schools and hospitals) raises the annual ‘actual’ figure close to $500 billion, but educational and medical facilities are not a primary focus of the newly passed package.
The $500 billion mentioned in the opening paragraph relative to $350 billion usually allocated per annum suggests the plan is to squeeze another year-and-a-half’s worth of spending into the next five years.
This will be wonderful stimulus for the segments of construction that lean towards ‘civil’ works but it will also mean that the pressures lifting steel and other key material input prices won’t be easily relieved.
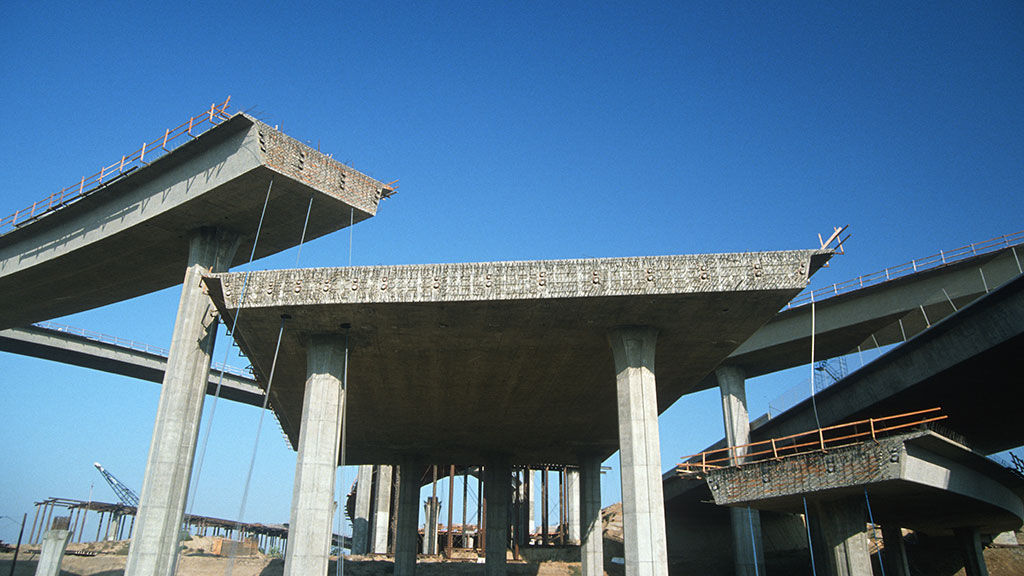
There are numerous specific construction spending areas covered in the bill. Foremost is the $100 billion that will go towards roads and bridges. (The bridges sub-portion has been estimated at $40 billion.)
Receiving between $40 billion and $70 billion each will be efforts to modernize public transit; improve and expand passenger and freight rail; extend broadband service to all parts of the country; upgrade water delivery and effluent takeaway systems (including the replacement of existing lead pipes); and more fully embrace renewable power generation, with accompanying new transmission lines.
Receiving smaller, but still substantial amounts, will be ports and airports. Plus, there will be major funding for clean-ups at the ‘brownfield’ sites of abandoned mines and gas wells.
Modernizing public transit will include financial help to convert buses to electric propulsion and away from diesel.
An overarching goal in the infrastructure improvement plans being set is that whatever does proceed be ‘resilient’; that it should be able to withstand buffeting from hurricanes, wildfires, and cyber assaults.
Besides the foregoing, there will be money going towards individual super-sized projects. Two priorities will be a new Portal Bridge over the Hackensack River in New Jersey and the much-ballyhooed Hudson River Tunnel, in New York. The latter has been endorsed by President Biden and is proceeding through the environmental review process. Both jobs fall within the Gateway Project to improve rail traffic flow from Boston to Richmond.
Also, not to be overlooked, is the federal establishment of half a million electric vehicle recharging stations across America.
The Biden Administration is confident that finding the funding for its infrastructure initiative will not prove too onerous. The debt doesn’t need to be tackled all at once. Current thinking is that it can be spread out over ten years.
There’s a danger, though, in unanticipated conundrums that can crop up.
For example, the government loses money in two ways when it makes a concerted push for the adoption of electric vehicles. First, there are the not inconsiderable subsidies offered as incentives to purchasers. Second, there’s the loss in the gallon-linked gasoline fuel tax when the EVs hit the road.
The extra expense and disappearing revenue need to be made up elsewhere. This has not yet become a big problem in America, but it’s already raising a devilish head in Europe.
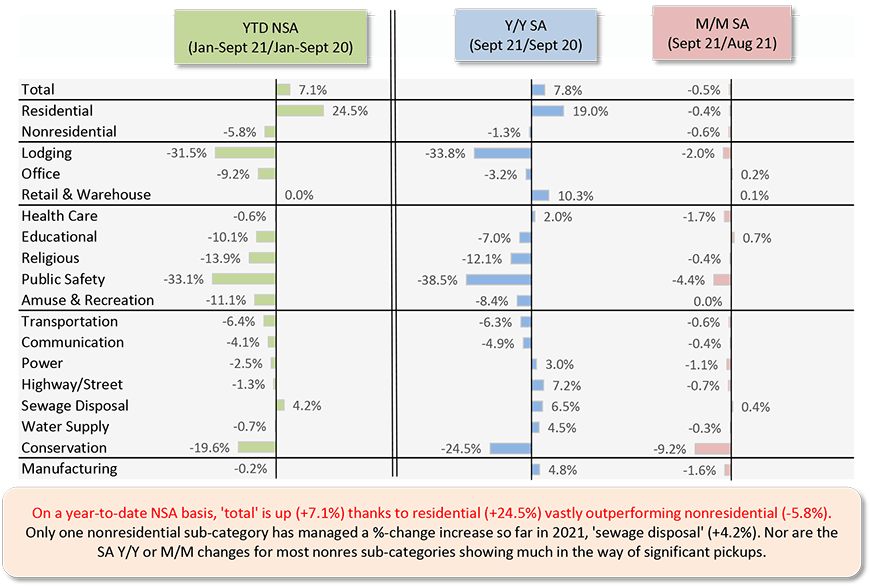
Chart: ConstructConnect.
Alex Carrick is Chief Economist for ConstructConnect. He has delivered presentations throughout North America on the U.S., Canadian and world construction outlooks. Mr. Carrick has been with the company since 1985. Links to his numerous articles are featured on Twitter @ConstructConnx, which has 50,000 followers.


Recent Comments
comments for this post are closed